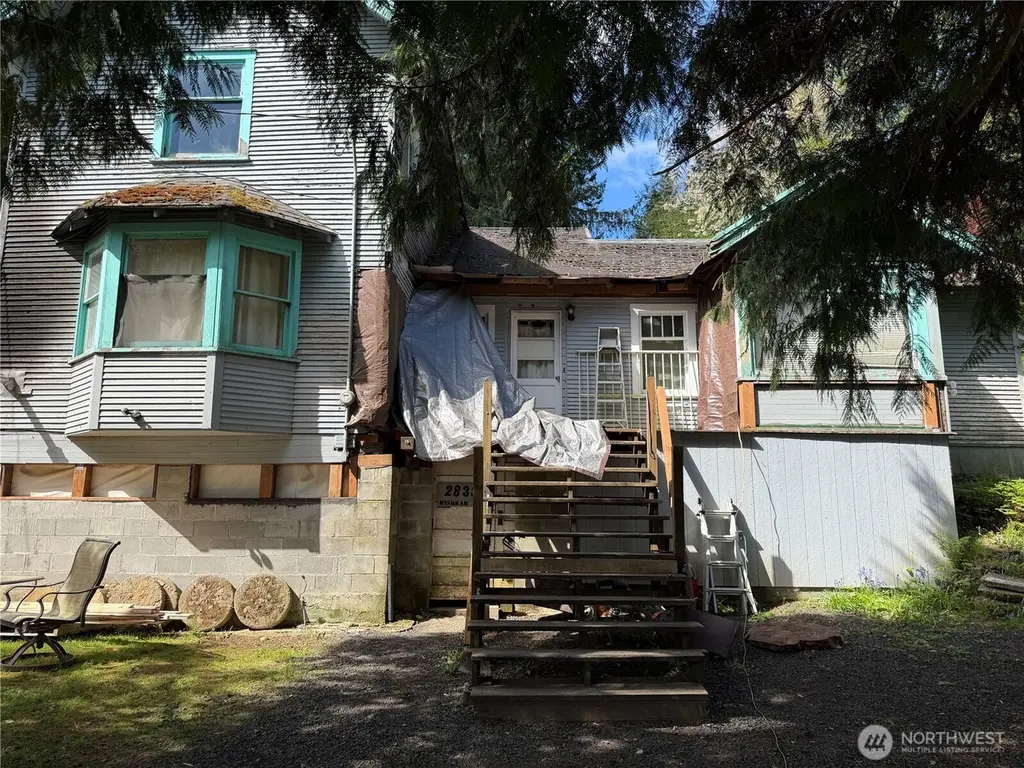
2833 Wishkah Rd · Aberdeen, WA
Flood risk 6/10 · Moderate
- FEMA flood zone
- X (unshaded)
- Chance of flooding over 30 yrs
- 0.61%
- Est. flood insurance / yr
- $473 – $860
Fire risk 1/10 · Minimal
- Est. fire insurance / yr
- $604 – $1,122
Heat risk 1/10 · Minimal
- Hot days now (above 78°F)
- 8 days/yr
- Hot days in 30 yrs
- 16 days/yr
Wind risk 1/10 · Minimal
- Chance of severe wind over 30 yrs
- —
Air-quality risk 6/10 · Moderate
- Unhealthy air days now
- 7 days/yr
- Unhealthy air days in 30 yrs
- 7 days/yr
Risk factors via First Street. Map © Google.
Why this score? — see what drove the B grade
The composite is a weighted blend of 9 inputs, each scored 0–100. Each bar is that input's sub-score; the figure is the points it added to the 100-point composite (weight × sub-score).
- Cash flow +30.0/30.0
- DSCR +10.0/10.0
- 1% rule +9.3/10.0
- ARV discount +7.5/15.0
- Livability +4.0/5.0
- Rent growth +3.6/5.0
- Schools +3.6/10.0
- Condition / age +2.5/5.0
- Appreciation +0.0/10.0
$145,000
🖨 Deal sheet (PDF) 📄 Offer letter ✓ Due diligence
Listing remarks
Bench Drive area value with some serious potential. This 4-bed, 1-bath fixer comes with ample land for future development. The main level has a living room, kitchen, primary bedroom, full bath, and utility room and the upper level has three bedrooms. Basement area is recorded as 600 sq. ft. , but appears to be larger. The house needs work, and the price reflects that. Offered as-is for the buyer ready to roll up their sleeves and unlock the opportunity. Square footage per county records; additional finished space not reflected in public records. Buyer to verify all measurements. Buyer is responsible for the remaining personal property.
Key facts
- Ample land
- Utility room
- Kitchen
Tags
Property features AI
Finance
- Other: Lot dimensions approximately 99' x 188' x 111' x 233' (about 0.5122 acres); Zoned: City
- Financial info: Listing terms: Cash
Exterior
- Parking: Off-street parking for 4 vehicles (uncovered)
- Utilities: Public water (City of Aberdeen); Sewer connected (City of Aberdeen); Electric power (Grays Harbor PUD); Cable and internet via Comcast
- Home design: Single-family residence; One and one-half story; Entry on main level; Built on lot; Fixer condition
- Construction: Wood construction; Composition roof; Pillar/post/pier foundation; Built on lot (no year provided)
- Exterior features: Wood exterior; Paved lot; Property has a view; Basement unfinished
Interior
- Kitchen: Kitchen on main level (no eating space indicated)
- Bedrooms: Primary bedroom on main level; Three additional bedrooms on the upper level (total 4 bedrooms)
- Flooring: Hardwood; Laminate; Vinyl
- Bathrooms: One full bathroom with bathtub and shower on main level
- Heating & cooling: Wall furnace heating; No central cooling
- Interior features: Fireplace with pellet stove; French doors; Jetted tub; Water heater (electric, located in basement)
- Laundry & utility: Washer and dryer included; Utility room on main level
Neighborhood map
What this means for you Summary
Snapshot
- This is a 4-bed/1.0-bath single-family listed at $145k.
Deal economics
- At list price, monthly cash flow is $701 ($8k/yr) — positive.
- The deal already cash-flows at list — no discount required.
- Meets the 1% rule at list price ($2k rent vs $145k).
- Recommended offer: $141k (3.0% below list) — sets the bar for market timing.
- Cap rate 12.1% vs local median 4.1% in Aberdeen — top-decile yield for the area; either an underpriced asset or a hidden risk that comps aren't pricing in. Stress-test before assuming the spread holds.
Location & tenants
- Location reads 81/100 on livability (#73 in WA, #1,320 nationally) — a professional / high-income tenant draw. Strengths: amenities A+, commute A+, cost of living A+; Watch: crime D-, employment F.
- Aberdeen School District (town): math 35% / reading 45% proficiency, ranked #222 of 291 in WA (top 76%) — families likely to look elsewhere, expect single-tenant / working-renter base with shorter leases; 61% free/reduced lunch — lower-income household profile, screen leases tightly.
- Zoned schools: Robert Gray Elementary (260 students, 81% FRL); Miller Junior High (718 students, 68% FRL); J M Weatherwax High School (916 students, 63% FRL).
- Market conditions: Rents rising fast (+4.3%/yr); 266 active listings in the ZIP; 2 comparable units currently listed for rent nearby; 297 units permitted in Grays Harbor County in 2024 (17 in 5+ unit buildings).
Forward outlook
- Local home prices are declining (-3.0%/yr); year-one equity from $1k of loan paydown is wiped out by about $4k of value loss. Plan a longer hold.
- Grays Harbor County population projected at -24% by 2050 — secular population decline; favor cash flow + early exit over multi-decade hold.
- At projected returns (-3.0% appreciation + 4.3% rent growth), your $41k cash investment doubles in ~6 years — after that, you're playing with house money.
Negotiation context
- It's been on market 41 days — a 3% lower offer ($141k) is reasonable based on typical stale-listing flexibility.
- 3 sale attempts since 8y ago with the ask held roughly flat each time — persistent listings suggest the price (not the market) is what's stuck; bring a comps-based counter.
- Current owner paid $40k; list at $145k implies a 262% gain — meaningful room to come down on a strong offer.
Risks & watch-outs
- Watch-outs: built in 1923 — expect roof / HVAC / electrical / plumbing capex.
- Climate carrying-cost: major flood risk — expect insurance premiums to compound above CPI over the hold.
Questions for the listing agent
- It's been on market 41 days. Have you received any prior offers? Is the seller open to a 3% concession, seller financing, or rate buy-down credit?
- Built in 1923 — when were the roof, HVAC, electrical panel, plumbing, and water heater last replaced?
- Is there a deadline driving the sale (1031 exchange, divorce, estate, relocation)? That informs how much negotiation room exists.
- Schools are D-rated, which usually means shorter tenancies and higher turnover. Who's the typical renter profile here, and what's been the actual vacancy rate?
- Crime grade is D in this area — have there been break-ins, vandalism, or insurance claims at this property in the last 3 years? What carrier currently insures it and at what premium?
- What's the average days-on-market for RENTAL listings here right now (not sales)? A rising rental-DOM trend means longer vacancies and softer asking-rent achievability than the comps imply.
- What's the recent tenant-quality profile in this submarket — average credit score on applications, eviction rate, late-payment / NSF rate, and stable-employment percentage? A property-management company in the area should have these aggregated.
- How much new for-sale + rental construction is in the pipeline within 1–3 miles? Heavy new supply typically softens prices + rents 12–24 months out; constrained supply supports both.
Investment metrics
- 1% rule
- 1.43% ✓
- Cap rate
- 12.10%
- Cash-on-cash
- 20.72%
- DSCR
- 1.92
- GRM
- 5.8
CMA / ARV
- ARV (median comp)
- $320,056
- List price
- $145,000
- Delta
- -53.16%
- Verdict
- UNDERPRICED
- Comps
- 20 within 1.0 mi
Show comp detail 11 sales within ~0.75 mi
| Address | Dist | Beds/Ba | Sqft | Sold | Price | $/sf | Match |
|---|---|---|---|---|---|---|---|
| 2751 Bench Dr | 0.12mi | 3/2.0 (-1) | 1,612 (-1%) | 17mo | $375,000 | $233 | 70 |
| 2625 Bench Dr | 0.30mi | 3/1.5 (-1) | 1,774 (+9%) | 2mo | $205,000 | $116 | 63 |
| 3003 Wishkah Rd | 0.44mi | 4/1.0 | 1,764 (+8%) | 8mo | $250,000 | $142 | 58 |
| 2717 Bench Dr | 0.19mi | 3/2.0 (-1) | 1,808 (+11%) | 9mo | $308,500 | $171 | 56 |
| 2316 Wishkah Rd | 0.44mi | 3/2.0 (-1) | 1,568 (-4%) | 10mo | $339,000 | $216 | 56 |
| 2736 Riverview Dr | 0.22mi | 3/1.0 (-1) | 1,816 (+12%) | 12mo | $319,000 | $176 | 56 |
| 2747 Highland Dr | 0.18mi | 3/1.5 (-1) | 1,765 (+8%) | 21mo | $323,000 | $183 | 53 |
| 1100 Hayes St | 0.75mi | 4/2.0 | 1,624 (-0%) | 15mo | $315,000 | $194 | 48 |
| 2014 Young St | 0.59mi | 4/2.0 | 1,560 (-4%) | 17mo | $370,000 | $237 | 48 |
| 24 Baretich Rd | 0.54mi | 3/1.0 (-1) | 1,764 (+8%) | 16mo | $293,000 | $166 | 42 |
| 726 10th Ave | 0.62mi | 3/2.0 (-1) | 1,867 (+15%) | 9mo | $341,000 | $183 | 30 |
Match score weights: distance 35% · size 25% · config 20% · recency 20%. Top-matched comps best support the ARV.
Projected returns pro-forma
-3.0% appreciation · 4.35% rent growth · sell at horizon
- IRR
- 14.5%
- Equity multiple
- 1.59×
- Total profit
- $23,999
- Equity at exit
- $21,620
- IRR
- 24.2%
- Equity multiple
- 3.23×
- Total profit
- $90,380
- Equity at exit
- $12,537
Cash invested: $40,600 (down + closing). Projections, not guarantees.
Landlord ↔ Tenant lean methodology
- Overall (STATE)
- 28 Tenant-Leaning
- State Washington
- 28 Tenant-Leaning · D+8
- County
- — inherits STATE
- City
- — inherits STATE
ZIP-level market 98520
- Rents YoY
- 4.3%
- Active inventory
- 266
- Price-to-rent
- 5.8×
Monthly cashflow live
- Estimated rent
- $2,071 medium interval (Pro) →
- Mortgage (P&I)
- −$760
- Tax from tax record
- −$114 /mo · $1,368/yr
- Insurance
- −$60
- HOA
- −$0
- Vacancy / Maint / Mgmt
- −$435
- Net cashflow
- $701
Break-even live
Sensitivity live
| Price | -10% $783 | -5% $742 | +0% $701 | +5% $660 | +10% $619 |
|---|---|---|---|---|---|
| Rent | -10% $538 | -5% $619 | +0% $701 | +5% $783 | +10% $865 |
| Rate | -1.0pp $774 | -0.5pp $738 | base $701 | +0.5pp $664 | +1.0pp $625 |
UW: 25.0% down · 7.5% · 30yr · 1.5% tax · 5.0% vac · 8.0% maint · 8.0% mgmt
Financing live
Cash to close
- Down payment
- $36,250
- Closing costs
- $4,350
- Reserves months
- —
- Total cash needed
- —
Loan-product check · same deal, 3 products live
Conventional
25% down · 7.5% · 30yr
- Down + closing
- —
- Monthly P&I
- —
- Monthly cashflow
- —
- DSCR
- —
- Eligible?
- —
Personal DTI + credit; lowest rate.
DSCR
20% down · 8.5% · 30yr
- Down + closing
- —
- Monthly P&I
- —
- Monthly cashflow
- —
- DSCR
- —
- Eligible?
- —
No personal income docs; deal must DSCR.
Hard money
10% down · 12.0% · 12mo
- Down + closing
- —
- Monthly P&I
- —
- Monthly cashflow
- —
- DSCR
- —
- Eligible?
- —
Short-term bridge; refi at stabilization.
Rent comps 2 comps
| Address | Beds | Baths | Sqft | Rent | $/sqft | DOM | Units | Dist |
|---|---|---|---|---|---|---|---|---|
| 801 Olympic Sq Aberdeen, MD | 2.0–3.0 | 2.0 | 1344 | $2,267 | $1.69 | 45d | 3 | 0.78mi |
| 908 E 1st St Aberdeen, WA | 3.0 | 1.0 | 1608 | $2,100 | $1.31 | 45d | 1 | 1.31mi |
Listing history 21 events
-
2026-06-21days on market $145,000 Active 41 DOM
-
2026-06-19pricedays on market $145,000 Active 39 DOM
-
2026-06-18days on market $149,900 Active 38 DOM
-
2026-06-17days on market $149,900 Active 37 DOM
-
2026-06-16days on market $149,900 Active 36 DOM
-
2026-06-15days on market $149,900 Active 35 DOM
-
2026-06-14days on market $149,900 Active 33 DOM
-
2026-06-12days on market $149,900 Active 32 DOM
-
2026-06-09days on market $149,900 Active 29 DOM
-
2026-06-08days on market $149,900 Active 28 DOM
-
2026-06-07days on market $149,900 Active 27 DOM
-
2026-06-03days on market $149,900 Active 23 DOM
-
2026-06-02days on market $149,900 Active 22 DOM
-
2026-06-01days on market $149,900 Active 21 DOM
-
2026-05-31days on market $149,900 Active 20 DOM
-
2026-05-30days on market $149,900 Active 19 DOM
-
2026-05-18status Pending
-
2026-04-29$149,900 Active
-
2018-04-13soldstatus $40,000 Sold
-
2018-03-31status Pending
-
2018-03-29$36,000 Active
ⓘ Source: listings_history table (triggers on properties + properties_extension) + one-shot
backfill from property_details.listing_events for pre-trigger history.
Tax reassessment forecast WA · Resets to sale price
- Current annual tax
- $1,368 · $114/mo
- Projected year-2 tax
- $1,421 · $118/mo
- Expected delta
- +$53/yr (+$4/mo · 3.9%)
ⓘ Screening estimate from a state-policy table — verify with the county assessor before closing.
Climate risk First Street
- Flood 6/10 Major FEMA zone X (unshaded) · 61% chance over 30 yrs
- Wildfire 1/10 Low
- Heat 1/10 Low 8 d/yr ≥78°F today · 16 d/yr by 30 yrs out
- Wind 1/10 Low
- Air quality 6/10 Major 7 unhealthy d/yr today · 7 by 30 yrs out
Nearby sold comps map
Loading sold comps map…
Walkable amenities ~0.75 mi
Loading nearby amenities…
Taxation est. · year 1
- Rental income
- $24,850
- − Mortgage interest
- −$8,122
- − Property taxes
- −$1,368
- − Insurance
- −$725
- − Repairs & maintenance
- −$1,988
- − Management
- −$1,988
- − Depreciation
- −$4,218
- Taxable income
- $6,440
- Est. tax owed @ 24.0%
- −$1,546
- After-tax cash flow
- $6,868/yr
For passive investors: Depreciation is non-cash, so a rental often shows a tax loss while cash-flowing — sheltering income. Rental losses are passive: they offset passive income freely, and up to $25,000/yr can offset ordinary (W-2) income if you actively participate and your MAGI is under $100k (phasing out to $0 by $150k); unused losses carry forward. On sale, claimed depreciation is recaptured at up to 25%, and gains may owe capital-gains tax (a 1031 exchange can defer both). Figures are a year-1 estimate at your 24.0% rate — not tax advice; consult a CPA.
Schools (NCES district)
- District
- Aberdeen School District
- NCES district ID
- 5300030
- Math proficiency
- 35% ▼ -1.00%
- Reading proficiency
- 45% ▬ 0.00%
- Median HH income
- $41,896
- Composite
- 36.13/100
- National rank
- #9477
- State rank
- #222 of 291 in WA
Livability — Aberdeen
- Score
- 81/100
- State rank
- #73
- US rank
- #1320
Category grades
Schools grade is shown separately in the Schools card above.
Census & demographics
- Census place
- Aberdeen, WA
- County
- Grays Harbor County · 44,693 people
- City population
- 24,888
- Metro
- Aberdeen, WA
- Population (ZIP)
- 24,888
- Household income
- $58,153
- Rent vs Own
- Severe rent burden
- 635.0
Population outlook (Grays Harbor County) Hauer SSP2
- Today (2025)
- 66,443 people
- By 2030
- 63,255 · -4.8%
- By 2040
- 56,466 · -15.0%
- By 2050
- 50,516 · -24.0%
- By 2075
- 39,296 · -40.9%
- By 2100
- 31,142 · -53.1%
Race, ethnicity, and origin ACS 2023
- Neighborhood character
- Predominantly White (70%)
- Race & ethnicity
- White 70% Hispanic / Latino 16% Two or more races 9% Black 4% Native American 3% Asian 1% Pacific Islander 1%
- Hispanic origin (detail)
- Mexican 11%
- Common ancestry
- Portuguese 4% Italian 3% Lithuanian 2%
- Foreign-born
- 7% · Canada
- Languages at home
- 87% English-only · Spanish 10% Other Asian/Pacific 1% German/W. Germanic 1%
Political lean MEDSL · Grays Harbor
- 2024 margin
- Lean R (+6.0) · D 45.6% · R 51.6% · Other 2.8%
- 2008→2024 swing
- -20.6pp toward R · 2008: 14.6pp · 2024: -6.0pp
- All cycles
- 2024: R+6.0 2020: R+6.6 2016: R+7.1 2012: D+14.0 2008: D+14.6
Not yet ingested
- Civics
- —
Market trends
- HPI YoY
- ▼ -138.75%
- Current HPI
- 207.7393
- Rent YoY
- ▲ 4.35%
- Metro
- Aberdeen, WA
- State GDP YoY
- ▲ 4.65%
- F500 in state
- 22
Industry mix (Fortune 500 HQ in WA)
| Industry | F500 HQs | Revenue |
|---|---|---|
| Retail | 2 | $269B |
|
||
| Technology / Retail | 1 | $638B |
|
||
| Technology | 1 | $245B |
|
||
| Telecommunications | 1 | $38B |
|
||
| Food / Beverage | 1 | $36B |
|
||
| Automotive / Trucks | 1 | $34B |
|
||
Price history
+302.8% since first listed7 events — show timeline
- 2026-06-18 Price Changed $145,000 NWMLS as Distributed by MLS Grid
- 2026-05-29 Relisted — NWMLS as Distributed by MLS Grid
- 2026-05-18 Pending — NWMLS as Distributed by MLS Grid
- 2026-04-29 Listed $149,900 NWMLS as Distributed by MLS Grid
- 2018-04-13 Sold (MLS) $40,000 NWMLS as Distributed by MLS Grid
- 2018-03-31 Pending — NWMLS as Distributed by MLS Grid
- 2018-03-29 Listed $36,000 NWMLS as Distributed by MLS Grid
Property tax history
+4.1%/yrLatest (2026): $1,368 · +116.8% YoY. Source: county tax records.
Cash-flow waterfall
monthlySold comps — $/sqft
last 12 mo · ≤1 miLoading sold comps…