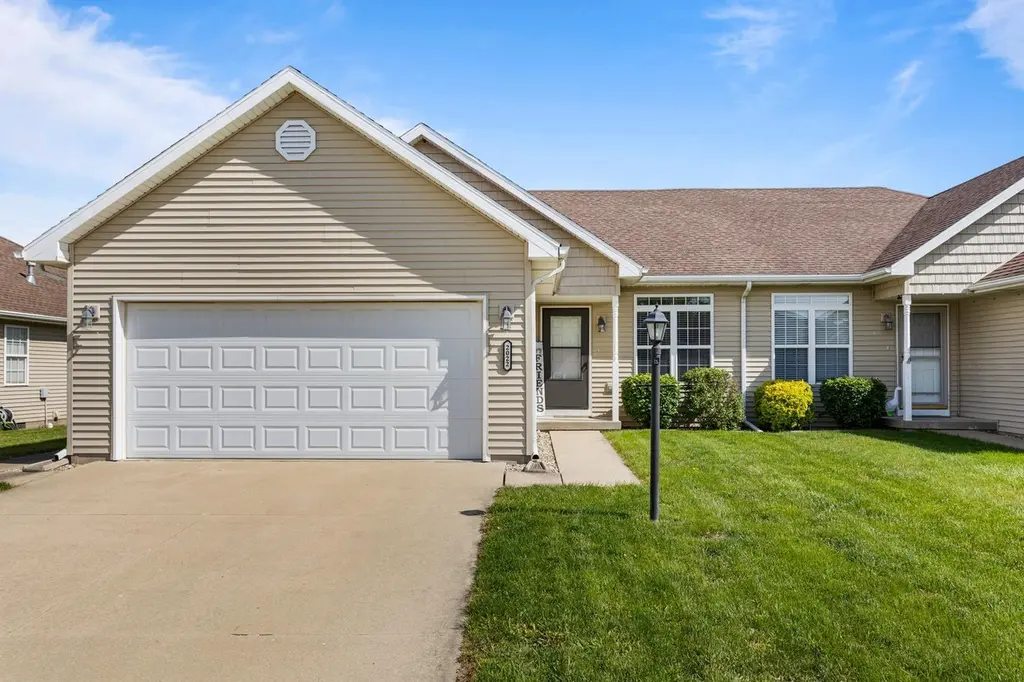
2022 Macon St · Mahomet, IL
Flood risk 1/10 · Minimal
- FEMA flood zone
- X (unshaded)
- Chance of flooding over 30 yrs
- 0.0%
- Est. flood insurance / yr
- $507 – $1,088
Fire risk 1/10 · Minimal
- Est. fire insurance / yr
- $804 – $1,492
Heat risk 3/10 · Minor
- Hot days now (above 103°F)
- 7 days/yr
- Hot days in 30 yrs
- 19 days/yr
Wind risk 2/10 · Minimal
- Chance of severe wind over 30 yrs
- 1.0%
Air-quality risk 2/10 · Minimal
- Unhealthy air days now
- 1 days/yr
- Unhealthy air days in 30 yrs
- 1 days/yr
Risk factors via First Street. Map © Google.
Why this score? — see what drove the C- grade
The composite is a weighted blend of 9 inputs, each scored 0–100. Each bar is that input's sub-score; the figure is the points it added to the 100-point composite (weight × sub-score).
- ARV discount +15.0/15.0
- Cash flow +14.2/30.0
- 1% rule +4.5/10.0
- DSCR +4.3/10.0
- Livability +4.0/5.0
- Schools +3.5/10.0
- Rent growth +2.5/5.0
- Condition / age +2.5/5.0
- Appreciation +0.0/10.0
$239,900
🖨 Deal sheet (PDF) 📄 Offer letter ✓ Due diligence
Listing remarks MLS
Zero lot ranch style plan with nice open floor plan. Large eat-in kitchen. Ready to move into! Great access to I-74. *Photos and Interactive Floor Plan are of similar listing.
Key facts
- $13 HOA
- 2 garage spots
- Built 2009
Neighborhood map
What this means for you Summary
Snapshot
- This is a 3-bed/2.0-bath other listed at $240k.
Deal economics
- At list price, monthly cash flow is $38 ($458/yr) — positive.
- The deal already cash-flows at list — no discount required.
- To meet the 1% rule (rent ≥ 1% of price), the offer needs to be $228k (5.0% below list).
- Recommended offer: $228k (5.0% below list) — sets the bar for 1% rule.
- Cap rate 6.5% vs local median 2.8% in Mahomet — top-decile yield for the area; either an underpriced asset or a hidden risk that comps aren't pricing in. Stress-test before assuming the spread holds.
Location & tenants
- Location reads 79/100 on livability (#117 in IL, #2,038 nationally) — a middle-class / working-renter tenant base. Strengths: employment A+, housing A+, health & safety A+; Watch: amenities F, commute F.
- Mahomet-Seymour CUSD 3 (town): math 40% / reading 35% proficiency, ranked #140 of 620 in IL (top 23%) — families likely to look elsewhere, expect single-tenant / working-renter base with shorter leases; only 19% free/reduced lunch — higher-income household profile.
- Zoned schools: Middletown Prairie Elementary (825 students, 0% FRL); Mahomet-Seymour Jr High School (math 38% / reading 34%, grade F, #182 of 665 statewide, top 28%, 810 students, 0% FRL); Mahomet-Seymour High School (math 53% / reading 50%, grade D+, #38 of 693 statewide, top 6%, 997 students, 0% FRL) — zoned schools average 0% FRL vs 19% district-wide (19 pts lower); this property's tenant base skews higher-income than the district average.
- Market conditions: 140 active listings in the ZIP; 3 comparable units currently listed for rent nearby; rentals at typical pace (median 16d on market — plan ~3-4 weeks tenant-placement turnaround); high-income renter base; 573 units permitted in Champaign County in 2024 (359 in 5+ unit buildings).
Forward outlook
- Local home prices are declining (-3.0%/yr); year-one equity from $2k of loan paydown is wiped out by about $7k of value loss. Plan a longer hold.
- Champaign County population projected at +15% by 2050 — modest demand growth; plan on rents tracking national, not racing it.
Negotiation context
- Only 0 days on market — expect competitive offers; lowballing is unlikely to land.
- 5 sale attempts since 17y ago with the ask held roughly flat each time — persistent listings suggest the price (not the market) is what's stuck; bring a comps-based counter.
- Current owner paid $134k; list at $240k implies a 79% gain — meaningful room to come down on a strong offer.
Questions for the listing agent
- What does the HOA fee cover, when was the last increase, and are there any pending special assessments or reserve-fund shortfalls?
- Is there a deadline driving the sale (1031 exchange, divorce, estate, relocation)? That informs how much negotiation room exists.
- Schools are B-rated — typically a magnet for longer-tenancy family renters. What's the average tenant stay here, and is there a school-zone premium baked into asking?
- What's the average days-on-market for RENTAL listings here right now (not sales)? A rising rental-DOM trend means longer vacancies and softer asking-rent achievability than the comps imply.
- What's the recent tenant-quality profile in this submarket — average credit score on applications, eviction rate, late-payment / NSF rate, and stable-employment percentage? A property-management company in the area should have these aggregated.
- How much new for-sale + rental construction is in the pipeline within 1–3 miles? Heavy new supply typically softens prices + rents 12–24 months out; constrained supply supports both.
Investment metrics
- 1% rule
- 0.95% ✗
- Cap rate
- 6.48%
- Cash-on-cash
- 0.68%
- DSCR
- 1.03
- GRM
- 8.8
CMA / ARV
- ARV (median comp)
- $353,711
- List price
- $239,900
- Delta
- -32.18%
- Verdict
- UNDERPRICED
- Comps
- 20 within 1.0 mi
Projected returns pro-forma
-3.0% appreciation · 3.0% rent growth · sell at horizon
- IRR
- -15.2%
- Equity multiple
- 0.46×
- Total profit
- $-36,345
- Equity at exit
- $35,770
- IRR
- -6.5%
- Equity multiple
- 0.58×
- Total profit
- $-28,120
- Equity at exit
- $20,742
Cash invested: $67,172 (down + closing). Projections, not guarantees.
Landlord ↔ Tenant lean methodology
- Overall (STATE)
- 43 Moderately Tenant-Leaning
- State Illinois
- 43 Moderately Tenant-Leaning · D+7
- County
- — inherits STATE
- City
- — inherits STATE
ZIP-level market 61853
- Home prices YoY
- -26.5%
- Active inventory
- 140
- Price-to-rent
- 8.8×
Monthly cashflow live
- Estimated rent
- $2,278 medium interval (Pro) →
- Mortgage (P&I)
- −$1,258
- Tax from tax record
- −$391 /mo · $4,689/yr
- Insurance
- −$100
- HOA
- −$13
- Vacancy / Maint / Mgmt
- −$478
- Net cashflow
- $38
Break-even live
Sensitivity live
| Price | -10% $174 | -5% $106 | +0% $38 | +5% $-30 | +10% $-98 |
|---|---|---|---|---|---|
| Rent | -10% $-142 | -5% $-52 | +0% $38 | +5% $128 | +10% $218 |
| Rate | -1.0pp $159 | -0.5pp $99 | base $38 | +0.5pp $-24 | +1.0pp $-87 |
UW: 25.0% down · 7.5% · 30yr · 1.5% tax · 5.0% vac · 8.0% maint · 8.0% mgmt
Financing live
Cash to close
- Down payment
- $59,975
- Closing costs
- $7,197
- Reserves months
- —
- Total cash needed
- —
Loan-product check · same deal, 3 products live
Conventional
25% down · 7.5% · 30yr
- Down + closing
- —
- Monthly P&I
- —
- Monthly cashflow
- —
- DSCR
- —
- Eligible?
- —
Personal DTI + credit; lowest rate.
DSCR
20% down · 8.5% · 30yr
- Down + closing
- —
- Monthly P&I
- —
- Monthly cashflow
- —
- DSCR
- —
- Eligible?
- —
No personal income docs; deal must DSCR.
Hard money
10% down · 12.0% · 12mo
- Down + closing
- —
- Monthly P&I
- —
- Monthly cashflow
- —
- DSCR
- —
- Eligible?
- —
Short-term bridge; refi at stabilization.
Rent comps 3 comps
| Address | Beds | Baths | Sqft | Rent | $/sqft | DOM | Units | Dist |
|---|---|---|---|---|---|---|---|---|
| 901 Cates Dr Unit 903B Mahomet, IL | 3.0 | 2.5 | 1641 | $2,160 | $1.32 | 15d | 1 | 1.17mi |
| 1202 Churchill Rd Unit 1218-201 Mahomet, IL | 2.0 | 2.0 | 1422 | $1,760 | $1.24 | 23d | 1 | 1.25mi |
| 1608 Delane Dr Unit B Mahomet, IL | 3.0 | 2.0 | 1495 | $2,450 | $1.64 | 15d | 1 | 1.26mi |
HOA detail
- Monthly dues
- $13 · $156/yr
Listing history 13 events
-
2026-05-08historical
-
2026-05-07historical 515-char remark
-
2026-05-06$239,900 515-char remark
-
2012-04-04soldstatus $134,000
-
2012-04-02soldstatus $134,000
Show marketing remark (175 chars)
Zero lot ranch style plan with nice open floor plan. Large eat-in kitchen. Ready to move into! Great access to I-74. *Photos and Interactive Floor Plan are of similar listing.
-
2012-02-21historical
Show marketing remark (175 chars)
Zero lot ranch style plan with nice open floor plan. Large eat-in kitchen. Ready to move into! Great access to I-74. *Photos and Interactive Floor Plan are of similar listing.
-
2011-12-02$136,900
Show marketing remark (175 chars)
Zero lot ranch style plan with nice open floor plan. Large eat-in kitchen. Ready to move into! Great access to I-74. *Photos and Interactive Floor Plan are of similar listing.
-
2011-07-18historical
-
2011-04-27
-
2009-08-17historical
-
2009-02-28
-
2009-02-25historical
-
2009-02-02
ⓘ Source: listings_history table (triggers on properties + properties_extension) + one-shot
backfill from property_details.listing_events for pre-trigger history.
Tax reassessment forecast IL · Partial reset (capped growth)
- Current annual tax
- $4,689 · $391/mo
- Projected year-2 tax
- $5,067 · $422/mo
- Expected delta
- +$378/yr (+$32/mo · 8.1%)
ⓘ Screening estimate from a state-policy table — verify with the county assessor before closing.
Climate risk First Street
- Flood 1/10 Low FEMA zone X (unshaded) · 0% chance over 30 yrs
- Wildfire 1/10 Low
- Heat 3/10 Moderate 7 d/yr ≥103°F today · 19 d/yr by 30 yrs out
- Wind 2/10 Low 100% chance of damaging wind over 30 yrs
- Air quality 2/10 Low 1 unhealthy d/yr today · 1 by 30 yrs out
Nearby sold comps map
Loading sold comps map…
Walkable amenities ~0.75 mi
Loading nearby amenities…
Taxation est. · year 1
- Rental income
- $27,341
- − Mortgage interest
- −$13,438
- − Property taxes
- −$4,689
- − Insurance
- −$1,200
- − Repairs & maintenance
- −$2,187
- − Management
- −$2,187
- − HOA
- −$156
- − Depreciation
- −$6,979
- Taxable loss
- −$3,495
- Est. tax savings @ 24.0%
- +$839
- After-tax cash flow
- $1,297/yr
For passive investors: Depreciation is non-cash, so a rental often shows a tax loss while cash-flowing — sheltering income. Rental losses are passive: they offset passive income freely, and up to $25,000/yr can offset ordinary (W-2) income if you actively participate and your MAGI is under $100k (phasing out to $0 by $150k); unused losses carry forward. On sale, claimed depreciation is recaptured at up to 25%, and gains may owe capital-gains tax (a 1031 exchange can defer both). Figures are a year-1 estimate at your 24.0% rate — not tax advice; consult a CPA.
Schools (NCES district)
- District
- Mahomet-Seymour CUSD 3
- NCES district ID
- 1724060
- Math proficiency
- 40% ▼ -8.00%
- Reading proficiency
- 35% ▼ -15.00%
- Median HH income
- $73,748
- Composite
- 34.72/100
- National rank
- #5134
- State rank
- #140 of 620 in IL
Livability — Mahomet
- Score
- 79/100
- State rank
- #117
- US rank
- #2038
Category grades
Schools grade is shown separately in the Schools card above.
Census & demographics
- Census place
- Mahomet, IL
- County
- Champaign County · 182,148 people
- City population
- 14,831
- Metro
- Champaign-Urbana, IL
- Population (ZIP)
- 14,831
- Household income
- $115,512
- Rent vs Own
- Severe rent burden
- 163.0
Population outlook (Champaign County) Hauer SSP2
- Today (2025)
- 223,848 people
- By 2030
- 231,416 · +3.4%
- By 2040
- 244,321 · +9.1%
- By 2050
- 256,432 · +14.6%
- By 2075
- 285,823 · +27.7%
- By 2100
- 296,406 · +32.4%
Race, ethnicity, and origin ACS 2023
- Neighborhood character
- Predominantly White (89%)
- Race & ethnicity
- White 89% Hispanic / Latino 5% Two or more races 3% Asian 3%
- Hispanic origin (detail)
- Mexican 5%
- Common ancestry
- Italian 3% Iranian 2% Romanian 2%
- Foreign-born
- 5% · Canada, China
- Languages at home
- 92% English-only · Spanish 4% Other Indo-European 2% French/Haitian/Cajun 1%
Political lean MEDSL · Champaign
- 2024 margin
- Strong D (+24.1) · D 61.3% · R 37.2% · Other 1.5%
- 2008→2024 swing
- +6.6pp toward D · 2008: 17.5pp · 2024: 24.1pp
- All cycles
- 2024: D+24.1 2020: D+22.8 2016: D+18.4 2012: D+6.8 2008: D+17.5
Not yet ingested
- Civics
- —
Market trends
- HPI YoY
- ▼ -72.54%
- Current HPI
- 200.9388
- Rent YoY
- —
- Metro
- Champaign-Urbana, IL
- State GDP YoY
- ▲ 1.59%
- F500 in state
- 60
Industry mix (Fortune 500 HQ in IL)
| Industry | F500 HQs | Revenue |
|---|---|---|
| Insurance | 4 | $201B |
|
||
| Consumer Goods | 4 | $87B |
|
||
| Industrial Machinery | 3 | $64B |
|
||
| Healthcare | 2 | $55B |
|
||
| Retail / Pharmacy | 1 | $148B |
|
||
| Agriculture / Food | 1 | $86B |
|
||
Price history
+75.2% since first listed13 events — show timeline
- 2026-05-08 Listing Removed — MRED as Distributed by MLS Grid
- 2026-05-07 Listing Removed — MRED as Distributed by MLS Grid
- 2026-05-06 Listed $239,900 MRED as Distributed by MLS Grid
- 2012-04-04 Sold (Public Records) $134,000 Public Records
- 2012-04-02 Sold (MLS) $134,000 MRED as Distributed by MLS Grid
- 2012-02-21 Listing Removed — MRED as Distributed by MLS Grid
- 2011-12-02 Listed $136,900 MRED as Distributed by MLS Grid
- 2011-07-18 Listing Removed — MRED as Distributed by MLS Grid
- 2011-04-27 Listed — MRED as Distributed by MLS Grid
- 2009-08-17 Listing Removed — MRED as Distributed by MLS Grid
- 2009-02-28 Listed — MRED as Distributed by MLS Grid
- 2009-02-25 Listing Removed — MRED as Distributed by MLS Grid
- 2009-02-02 Listed — MRED as Distributed by MLS Grid
Property tax history
+3.3%/yrLatest (2025): $4,689 · +4.9% YoY. Source: county tax records.
Cash-flow waterfall
monthlySold comps — $/sqft
last 12 mo · ≤1 miLoading sold comps…