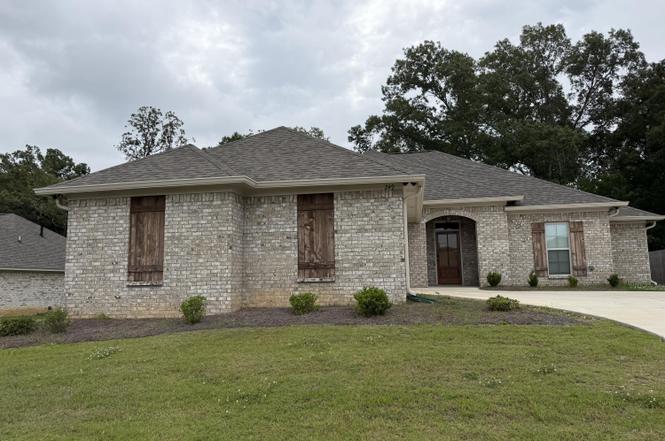
249 Hemingway Cir · Canton, MS
Flood risk No data
- FEMA flood zone
- —
- Chance of flooding over 30 yrs
- —
- Est. flood insurance / yr
- —
Fire risk No data
- Est. fire insurance / yr
- —
Heat risk No data
- Hot days now (above threshold)
- —
- Hot days in 30 yrs
- —
Wind risk No data
- Chance of severe wind over 30 yrs
- —
Air-quality risk No data
- Unhealthy air days now
- —
- Unhealthy air days in 30 yrs
- —
Risk factors via First Street. Map © Google.
Why this score? — see what drove the D- grade
The composite is a weighted blend of 9 inputs, each scored 0–100. Each bar is that input's sub-score; the figure is the points it added to the 100-point composite (weight × sub-score).
- Cash flow +11.2/30.0
- ARV discount +7.1/15.0
- Schools +4.8/10.0
- Condition / age +4.0/5.0
- 1% rule +3.4/10.0
- DSCR +3.3/10.0
- Livability +3.0/5.0
- Rent growth +2.5/5.0
- Appreciation +0.0/10.0
$297,900
🖨 Deal sheet 📄 Offer letter ✓ Due diligence
Listing remarks
Come check out this custom-built home with a private lot and was built with many upgrades. This 3/2 split plan was built with upgrades like high end LVP flooring throughout the home. It has custom built cabinets throughout the home. A office custom office with bookshelves in the back so you can get away to do some work or just relax. A private fence in backyard with additional concrete to set up additional furniture for guest. This one will not last long so call a Realtor today to set up a showing.
Key facts
- Private lot
- Custom office
- Additional concrete
Tags
Property features AI
Finance
- Other: Property address: 249 Hemingway Circle, Canton, MS 39046; Living area reported as 1,632 (source: appraiser)
- Financial info: Financial details such as taxes and assessments excluded
- HOA & community: Homeowners association with annual fee of $400 (includes management)
Exterior
- Parking: 2-car garage; Garage door opener; Concrete driveway/garage flooring
- Security: No specific security features listed
- Utilities: Public water; Public sewer; Electricity connected; Natural gas connected (kitchen gas available); Cable available; Water connected
- Home design: Single family residence (house); One story; Move-in ready
- Construction: Brick construction; Architectural shingle roof; Slab foundation; Built year from public records
- Exterior features: Slab patio/porch; Wood full fencing; Front yard; Fenced yard
Interior
- Kitchen: Dishwasher; Disposal; Microwave; Exhaust fan; Gas water heater
- Bedrooms: Bedrooms information not provided
- Flooring: Luxury vinyl; Wood
- Bathrooms: 2 full bathrooms
- Heating & cooling: Central heating (natural gas); Fireplace provides additional heating; Central air conditioning; Ceiling fans; Gas-powered cooling components
- Interior features: Ceiling fans; High ceilings; Insulated windows; Gas log fireplace with gas starter
- Laundry & utility: Washer/dryer information not provided
Neighborhood map
What this means for you Summary
Snapshot
- This is a 3-bed/2.0-bath single-family listed at $298k. Condition is rated good.
Deal economics
- At list price, monthly cash flow is $-117 ($-1k/yr) — negative.
- To cash-flow at today's rent, offer at most $281k (5.7% below list).
- To meet the 1% rule (rent ≥ 1% of price), the offer needs to be $250k (16.1% below list).
- Recommended offer: $250k (16.1% below list) — sets the bar for 1% rule.
- Cap rate 5.8% vs local median 4.2% in Canton — top-decile yield for the area; either an underpriced asset or a hidden risk that comps aren't pricing in. Stress-test before assuming the spread holds.
Location & tenants
- Location reads 60/100 on livability (#229 in MS) — a middle-class / working-renter tenant base. Strengths: cost of living A+, crime B+; Watch: amenities F, commute F, employment F.
- Madison County School District (rural): math 54% / reading 54% proficiency, ranked #3 of 130 in MS (top 2%) — acceptable for families but not a draw, mixed tenant base, ~2y average lease.
- Zoned schools: Madison Crossing Elementary (math 52% / reading 55%, grade C, #49 of 375 statewide, top 13%, 775 students, 100% FRL); Germantown Middle School (math 55% / reading 58%, grade B, #14 of 179 statewide, top 7%, 1,008 students, 100% FRL); Germantown High School (math 34% / reading 41%, grade F, #59 of 197 statewide, top 30%, 1,396 students, 100% FRL) — zoned schools average 100% FRL vs 29% district-wide (70 pts higher); higher-poverty schools than district average — tighter screening recommended.
- Market conditions: 358 active listings in the ZIP; 1 comparable units currently listed for rent nearby; 553 units permitted in Madison County in 2024 (0 in 5+ unit buildings).
Forward outlook
- Local home prices are declining (-3.0%/yr); year-one equity from $2k of loan paydown is wiped out by about $9k of value loss. Plan a longer hold.
- Madison County population projected at +34% by 2050 — long-run rental-demand tailwind backs the buy-and-hold thesis.
Negotiation context
- Only 3 days on market — expect competitive offers; lowballing is unlikely to land.
Questions for the listing agent
- What do current leases actually rent for vs. the listed asking? Can we see a recent rent roll and the last 12 months of T-12 income?
- What does the HOA fee cover, when was the last increase, and are there any pending special assessments or reserve-fund shortfalls?
- Is there a deadline driving the sale (1031 exchange, divorce, estate, relocation)? That informs how much negotiation room exists.
- Schools are F-rated, which usually means shorter tenancies and higher turnover. Who's the typical renter profile here, and what's been the actual vacancy rate?
- The area grade is low — what's the realistic commute time and amenity access for the typical tenant pool here? Any planned neighborhood developments (good or bad) we should know about?
- What's the average days-on-market for RENTAL listings here right now (not sales)? A rising rental-DOM trend means longer vacancies and softer asking-rent achievability than the comps imply.
- What's the recent tenant-quality profile in this submarket — average credit score on applications, eviction rate, late-payment / NSF rate, and stable-employment percentage? A property-management company in the area should have these aggregated.
- How much new for-sale + rental construction is in the pipeline within 1–3 miles? Heavy new supply typically softens prices + rents 12–24 months out; constrained supply supports both.
Investment metrics
- 1% rule
- 0.84% ✗
- Cap rate
- 5.82%
- Cash-on-cash
- -1.68%
- DSCR
- 0.93
- GRM
- 9.9
CMA / ARV
- ARV (on-the-fly)
- $295,392
- Comps found
- 12
Show comp detail 12 sales within ~0.75 mi
| Address | Dist | Beds/Ba | Sqft | Sold | Price | $/sf | Match |
|---|---|---|---|---|---|---|---|
| 247 Hemingway Cir | 0.01mi | 3/2.0 | 1,506 (-8%) | 4mo | $275,000 | $183 | 84 |
| 126 Madisonville Dr | 0.11mi | 3/2.0 | 1,725 (+6%) | 3mo | $299,999 | $174 | 83 |
| 136 Madisonville Dr | 0.07mi | 3/2.0 | 1,524 (-7%) | 9mo | $275,900 | $181 | 78 |
| 134 Madisonville Dr | 0.07mi | 3/2.0 | 1,506 (-8%) | 9mo | $272,900 | $181 | 76 |
| 106 Madisonville Dr | 0.24mi | 3/2.0 | 1,735 (+6%) | 3mo | $294,999 | $170 | 76 |
| 140 Madisonville Dr | 0.14mi | 3/2.0 | 1,506 (-8%) | 9mo | $272,900 | $181 | 73 |
| 201 Hemingway Cir | 0.22mi | 3/2.0 | 1,524 (-7%) | 9mo | $274,900 | $180 | 71 |
| 104 Bridge Hollow Ln | 0.51mi | 3/2.0 | 1,672 (+2%) | 4mo | $279,000 | $167 | 69 |
| 205 Hemingway Cir | 0.29mi | 3/2.0 | 1,506 (-8%) | 9mo | $274,400 | $182 | 66 |
| 203 Hemingway Cir | 0.29mi | 3/2.0 | 1,506 (-8%) | 9mo | $274,400 | $182 | 66 |
| 111 Bridge Park Cir | 0.58mi | 3/2.0 | 1,758 (+8%) | 6mo | $269,900 | $154 | 55 |
| 110 Bridge Park Dr | 0.68mi | 3/2.0 | 1,796 (+10%) | 4mo | $285,000 | $159 | 49 |
Match score weights: distance 35% · size 25% · config 20% · recency 20%. Top-matched comps best support the ARV.
Projected returns pro-forma
-3.0% appreciation · 3.0% rent growth · sell at horizon
- IRR
- -19.0%
- Equity multiple
- 0.33×
- Total profit
- $-55,649
- Equity at exit
- $44,418
- IRR
- -11.6%
- Equity multiple
- 0.31×
- Total profit
- $-57,795
- Equity at exit
- $25,757
Cash invested: $83,412 (down + closing). Projections, not guarantees.
Landlord ↔ Tenant lean methodology
- Overall (STATE)
- 90 Strongly Landlord-Friendly
- State Mississippi
- 90 Strongly Landlord-Friendly · R+11
- County
- — inherits STATE
- City
- — inherits STATE
ZIP-level market 39046
- Home prices YoY
- -30.1%
- Active inventory
- 358
- Price-to-rent
- 9.9×
Monthly cashflow live
- Estimated rent
- $2,500 medium interval (Pro) →
- Mortgage (P&I)
- −$1,562
- Tax est. 1.5%
- −$372 /mo · $4,468/yr
- Insurance
- −$124
- HOA
- −$33
- Vacancy / Maint / Mgmt
- −$525
- Net cashflow
- $-117
Break-even live
UW: 25.0% down · 7.5% · 30yr · 1.5% tax · 5.0% vac · 8.0% maint · 8.0% mgmt
Financing live
Cash to close
- Down payment
- $74,475
- Closing costs
- $8,937
- Reserves months
- —
- Total cash needed
- —
Loan-product check · same deal, 3 products live
Conventional
25% down · 7.5% · 30yr
- Down + closing
- —
- Monthly P&I
- —
- Monthly cashflow
- —
- DSCR
- —
- Eligible?
- —
Personal DTI + credit; lowest rate.
DSCR
20% down · 8.5% · 30yr
- Down + closing
- —
- Monthly P&I
- —
- Monthly cashflow
- —
- DSCR
- —
- Eligible?
- —
No personal income docs; deal must DSCR.
Hard money
10% down · 12.0% · 12mo
- Down + closing
- —
- Monthly P&I
- —
- Monthly cashflow
- —
- DSCR
- —
- Eligible?
- —
Short-term bridge; refi at stabilization.
Rent comps 1 comps
| Address | Beds | Baths | Sqft | Rent | $/sqft | DOM | Units | Dist |
|---|---|---|---|---|---|---|---|---|
| 125 Trailbridge Crossing Canton, MS | 3.0 | 2.0 | 1750 | $2,500 | $1.43 | 14d | 1 | 0.59mi |
HOA detail
- Monthly dues
- $33 · $396/yr
Listing history 4 events
-
2026-06-18days on market $297,900 Active 3 DOM
-
2026-06-17days on market $297,900 Active 2 DOM
-
2026-06-15remarks 503-char remark
-
2026-06-15$297,900 Active 1 DOM
ⓘ Source: listings_history table (triggers on properties + properties_extension) + one-shot
backfill from property_details.listing_events for pre-trigger history.
Nearby sold comps map
Loading sold comps map…
Walkable amenities ~0.75 mi
Loading nearby amenities…
Taxation est. · year 1
- Rental income
- $30,000
- − Mortgage interest
- −$16,687
- − Property taxes
- −$4,468
- − Insurance
- −$1,490
- − Repairs & maintenance
- −$2,400
- − Management
- −$2,400
- − HOA
- −$396
- − Depreciation
- −$8,666
- Taxable loss
- −$6,507
- Est. tax savings @ 24.0%
- +$1,562
- After-tax cash flow
- $161/yr
For passive investors: Depreciation is non-cash, so a rental often shows a tax loss while cash-flowing — sheltering income. Rental losses are passive: they offset passive income freely, and up to $25,000/yr can offset ordinary (W-2) income if you actively participate and your MAGI is under $100k (phasing out to $0 by $150k); unused losses carry forward. On sale, claimed depreciation is recaptured at up to 25%, and gains may owe capital-gains tax (a 1031 exchange can defer both). Figures are a year-1 estimate at your 24.0% rate — not tax advice; consult a CPA.
Condition & rehab AI · 12 photos
This custom-built home with upgrades and a private lot is in good condition, ready for a new owner.
Value-add opportunities
- Resale Paint exterior trim — Enhances curb appeal
- Rental Clean and maintain gutters — Keeps home in good condition
Renovation cost estimate screening
Value-add ROI direction
- Resale Paint exterior trim — Enhances curb appeal ↑
- Rental Clean and maintain gutters — Keeps home in good condition ↑
ⓘ Cost ranges are severity-bucket heuristics (US national rule-of-thumb). Get contractor quotes + a written scope before underwriting a rehab budget.
Schools (NCES district)
- District
- Madison County School District
- NCES district ID
- 2802790
- Math proficiency
- 54% ▼ -7.00%
- Reading proficiency
- 54% ▼ -7.00%
- Median HH income
- $70,579
- Composite
- 48.08/100
- National rank
- #2188
- State rank
- #3 of 130 in MS
Livability — Canton
- Score
- 60/100
- State rank
- #229
- US rank
- #19396
Category grades
Schools grade is shown separately in the Schools card above.
Census & demographics
- City population
- 29,160
- Population (ZIP)
- 29,160
Population outlook (Madison County) Hauer SSP2
- Today (2025)
- 122,509 people
- By 2030
- 131,737 · +7.5%
- By 2040
- 148,930 · +21.6%
- By 2050
- 164,300 · +34.1%
- By 2075
- 197,495 · +61.2%
- By 2100
- 211,429 · +72.6%
Race, ethnicity, and origin ACS 2023
- Neighborhood character
- Majority Black (63%)
- Race & ethnicity
- Black 63% White 31% Hispanic / Latino 4% Two or more races 2%
- Common ancestry
- Italian 2% Slovak 1% Serbian 1%
- Foreign-born
- 2% · Canada, China
- Languages at home
- 95% English-only · Spanish 4%
Political lean MEDSL · Madison
- 2024 margin
- R (+17.3) · D 40.8% · R 58.0% · Other 1.2%
- 2008→2024 swing
- -1.7pp toward R · 2008: -15.6pp · 2024: -17.3pp
- All cycles
- 2024: R+17.3 2020: R+11.8 2016: R+16.1 2012: R+15.7 2008: R+15.6
Not yet ingested
- Civics
- —
Market trends
- HPI YoY
- ▼ -66.50%
- Current HPI
- 154.0441
- Rent YoY
- —
- Metro
- —
- State GDP YoY
- —
- F500 in state
- 0
Price history
1 event — show timeline
- 2026-06-15 Listed $297,900 MLSU
Cash-flow waterfall
monthlySold comps — $/sqft
last 12 mo · ≤1 miLoading sold comps…