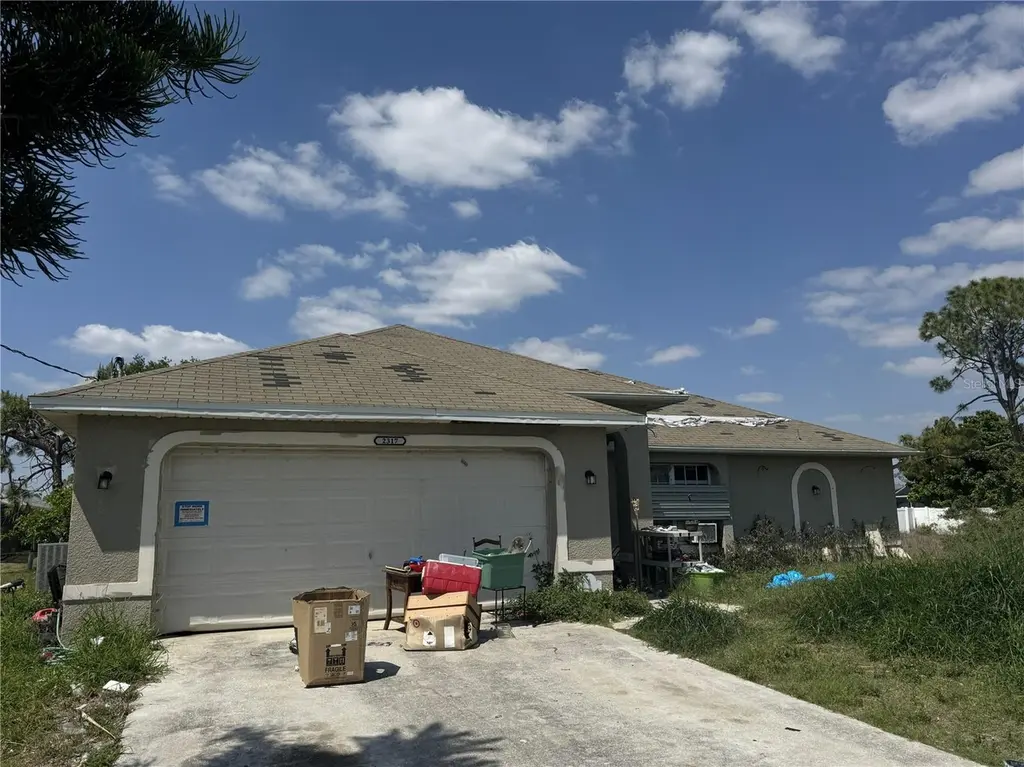
2317 NW 30th Ter · Cape Coral, FL
Flood risk 6/10 · Moderate
- FEMA flood zone
- X (shaded)
- Chance of flooding over 30 yrs
- 0.68%
- Est. flood insurance / yr
- $507 – $1,088
Fire risk 7/10 · Major
- Est. fire insurance / yr
- $947 – $1,759
Heat risk 10/10 · Severe
- Hot days now (above 107°F)
- 7 days/yr
- Hot days in 30 yrs
- 31 days/yr
Wind risk 10/10 · Severe
- Chance of severe wind over 30 yrs
- 99.0%
Air-quality risk 2/10 · Minimal
- Unhealthy air days now
- 1 days/yr
- Unhealthy air days in 30 yrs
- 1 days/yr
Risk factors via First Street. Map © Google.
Why this score? — see what drove the B- grade
The composite is a weighted blend of 9 inputs, each scored 0–100. Each bar is that input's sub-score; the figure is the points it added to the 100-point composite (weight × sub-score).
- Cash flow +26.6/30.0
- ARV discount +15.0/15.0
- DSCR +9.1/10.0
- 1% rule +6.7/10.0
- Schools +4.1/10.0
- Livability +3.9/5.0
- Condition / age +2.5/5.0
- Rent growth +1.1/5.0
- Appreciation +0.0/10.0
$195,000
🖨 Deal sheet 📄 Offer letter ✓ Due diligence
Listing remarks
* Attention Investors & Savvy Owner-Occupants * Rare fixer-upper pool home opportunity in one of Cape Coral's fastest-growing neighborhoods. The owner's relocation gives you the unique chance to secure this spacious 4 bed / 2 bath pool home on a large . 23-acre lot at a compelling value. While the property requires a full renovation, the home offers great bones and a desirable layout at the lowest price per sqft for a flip in the area. So what makes this one so special? 1) Spacious 4 bed / 2 bath floorplan with generous living areas and excellent renovation potential throughout. 2) Original structure with strong bones, built in 2004. 3) Screen-enclosed pool with a huge outdoor patio
Key facts
- Tile kitchen
- Screen-enclosed pool
- Large lot
Tags
Property features AI
Finance
- Other: Zoning: R1
- Financial info: No lease restrictions
- HOA & community: No HOA association listed
Exterior
- Parking: Attached 2-car garage
- Utilities: Electricity connected; Water connected; Septic tank
- Home design: Single family residence; One level; South-facing; Homesteaded
- Construction: Block and stucco construction; Shingle roof; Slab foundation; Built on a 0.23-acre lot
- Exterior features: Private in-ground pool; Asphalt road access
Interior
- Kitchen: Range; Refrigerator
- Bedrooms: 4 bedrooms
- Flooring: Carpet; Tile
- Bathrooms: 2 full bathrooms
- Heating & cooling: Electric heating; Wall/window air conditioning units
- Interior features: No interior features listed
- Laundry & utility: Washer hookup; Electric dryer hookup
Neighborhood map
What this means for you Summary
Snapshot
- This is a 4-bed/2.0-bath single-family listed at $195k.
Deal economics
- At list price, monthly cash flow is $523 ($6k/yr) — positive.
- The deal already cash-flows at list — no discount required.
- Meets the 1% rule at list price ($2k rent vs $195k).
- Cap rate 9.5% vs local median 3.1% in Cape Coral — top-decile yield for the area; either an underpriced asset or a hidden risk that comps aren't pricing in. Stress-test before assuming the spread holds.
Location & tenants
- Location reads 77/100 on livability (#208 in FL, #3,098 nationally) — a middle-class / working-renter tenant base. Strengths: housing A+, health & safety A+, amenities B+; Watch: commute F.
- Lee (suburban): math 47% / reading 50% proficiency, ranked #42 of 73 in FL (top 58%) — families likely to look elsewhere, expect single-tenant / working-renter base with shorter leases.
- Market conditions: Rents falling (-5.5%/yr); 2652 active listings in the ZIP; 28 comparable units currently listed for rent nearby; rentals at typical pace (median 16d on market — plan ~3-4 weeks tenant-placement turnaround); solid renter incomes; 15,411 units permitted in Lee County in 2024 (4,686 in 5+ unit buildings).
- This rent runs 30% of the median local income ($91k/yr) — at the standard rent-burdened threshold; future hikes will face affordability resistance.
Forward outlook
- Local home prices are declining (-3.0%/yr); year-one equity from $1k of loan paydown is wiped out by about $6k of value loss. Plan a longer hold.
- Lee County population projected at +44% by 2050 — long-run rental-demand tailwind backs the buy-and-hold thesis.
Negotiation context
- Only 13 days on market — expect competitive offers; lowballing is unlikely to land.
- 2 sale attempts with the ask held roughly flat each time — persistent listings suggest the price (not the market) is what's stuck; bring a comps-based counter.
- Current owner paid $66k; list at $195k implies a 195% gain — meaningful room to come down on a strong offer.
Risks & watch-outs
- Climate carrying-cost: major flood risk; severe wind risk, 99% chance of damaging wind over 30y; major wildfire risk; extreme-heat days projected 7→31/yr by 2055 (HVAC capex compounding) — expect insurance premiums to compound above CPI over the hold.
Questions for the listing agent
- Is there a deadline driving the sale (1031 exchange, divorce, estate, relocation)? That informs how much negotiation room exists.
- Schools are B-rated — typically a magnet for longer-tenancy family renters. What's the average tenant stay here, and is there a school-zone premium baked into asking?
- What's the average days-on-market for RENTAL listings here right now (not sales)? A rising rental-DOM trend means longer vacancies and softer asking-rent achievability than the comps imply.
- What's the recent tenant-quality profile in this submarket — average credit score on applications, eviction rate, late-payment / NSF rate, and stable-employment percentage? A property-management company in the area should have these aggregated.
- How much new for-sale + rental construction is in the pipeline within 1–3 miles? Heavy new supply typically softens prices + rents 12–24 months out; constrained supply supports both.
Investment metrics
- 1% rule
- 1.17% ✓
- Cap rate
- 9.51%
- Cash-on-cash
- 11.49%
- DSCR
- 1.51
- GRM
- 7.1
CMA / ARV
- ARV (on-the-fly)
- $335,552
- Comps found
- 12
Show comp detail 12 sales within ~0.75 mi
| Address | Dist | Beds/Ba | Sqft | Sold | Price | $/sf | Match |
|---|---|---|---|---|---|---|---|
| 2226 NW 31st St | 0.08mi | 4/2.0 | 1,829 (+7%) | 8mo | $343,990 | $188 | 78 |
| 2841 NW 21st Pl | 0.31mi | 4/2.0 | 1,691 (-1%) | 9mo | $379,000 | $224 | 76 |
| 1901 NW 30th St | 0.55mi | 4/3.0 | 1,690 (-1%) | 2mo | $335,000 | $198 | 67 |
| 2817 NW 22nd Pl | 0.29mi | 4/2.0 | 1,563 (-9%) | 15mo | $315,000 | $202 | 59 |
| 3033 NW 18th Ave | 0.73mi | 4/3.0 | 1,683 (-2%) | 4mo | $318,000 | $189 | 56 |
| 2320 NW 26th St | 0.53mi | 4/2.0 | 1,810 (+6%) | 12mo | $318,700 | $176 | 56 |
| 2224 NW 25th Ter | 0.65mi | 4/3.0 | 1,683 (-2%) | 9mo | $330,000 | $196 | 55 |
| 2317 NW 25th Ter | 0.61mi | 4/2.0 | 1,829 (+7%) | 8mo | $343,990 | $188 | 54 |
| 2321 NW 25th Ter | 0.61mi | 4/2.0 | 1,837 (+7%) | 8mo | $284,899 | $155 | 52 |
| 2917 NW 19th Pl | 0.51mi | 4/2.0 | 1,829 (+7%) | 16mo | $359,990 | $197 | 52 |
| 2617 NW 26th Pl | 0.65mi | 4/2.0 | 1,831 (+7%) | 14mo | $220,000 | $120 | 46 |
| 1901 NW 27th St | 0.67mi | 3/3.0 (-1) | 1,888 (+10%) | 4mo | $420,000 | $222 | 40 |
Match score weights: distance 35% · size 25% · config 20% · recency 20%. Top-matched comps best support the ARV.
Projected returns pro-forma
-3.0% appreciation · 0.0% rent growth · sell at horizon
- IRR
- -2.5%
- Equity multiple
- 0.91×
- Total profit
- $-4,992
- Equity at exit
- $29,075
- IRR
- 3.7%
- Equity multiple
- 1.23×
- Total profit
- $12,642
- Equity at exit
- $16,860
Cash invested: $54,600 (down + closing). Projections, not guarantees.
Landlord ↔ Tenant lean methodology
- Overall (STATE)
- 87 Strongly Landlord-Friendly
- State Florida
- 87 Strongly Landlord-Friendly · R+3
- County
- — inherits STATE
- City
- — inherits STATE
ZIP-level market 33993
- Home prices YoY
- -14.1%
- Rents YoY
- -5.5%
- Active inventory
- 2652
- Price-to-rent
- 7.1×
Monthly cashflow live
- Estimated rent
- $2,285 high interval (Pro) →
- Mortgage (P&I)
- −$1,023
- Tax from tax record
- −$178 /mo · $2,138/yr
- Insurance
- −$81
- HOA
- −$0
- Vacancy / Maint / Mgmt
- −$480
- Net cashflow
- $523
Break-even live
UW: 25.0% down · 7.5% · 30yr · 1.5% tax · 5.0% vac · 8.0% maint · 8.0% mgmt
Financing live
Cash to close
- Down payment
- $48,750
- Closing costs
- $5,850
- Reserves months
- —
- Total cash needed
- —
Loan-product check · same deal, 3 products live
Conventional
25% down · 7.5% · 30yr
- Down + closing
- —
- Monthly P&I
- —
- Monthly cashflow
- —
- DSCR
- —
- Eligible?
- —
Personal DTI + credit; lowest rate.
DSCR
20% down · 8.5% · 30yr
- Down + closing
- —
- Monthly P&I
- —
- Monthly cashflow
- —
- DSCR
- —
- Eligible?
- —
No personal income docs; deal must DSCR.
Hard money
10% down · 12.0% · 12mo
- Down + closing
- —
- Monthly P&I
- —
- Monthly cashflow
- —
- DSCR
- —
- Eligible?
- —
Short-term bridge; refi at stabilization.
Rent comps 28 comps
| Address | Beds | Baths | Sqft | Rent | $/sqft | DOM | Units | Dist |
|---|---|---|---|---|---|---|---|---|
| 2837 NW 24th Ave Cape Coral, FL | 3.0 | 2.0 | 1286 | $4,470 | $3.48 | 23d | 1 | 0.18mi |
| 2824 NW 23rd Ave Cape Coral, FL | 3.0 | 2.0 | 1462 | $1,641 | $1.12 | 21d | 1 | 0.23mi |
| 2630 NW 23rd Ave Cape Coral, FL | 3.0 | 2.0 | 1515 | $2,299 | $1.52 | 23d | 1 | 0.39mi |
| 2837 NW 27th Ave Cape Coral, FL | 3.0 | 2.0 | 1408 | $1,691 | $1.20 | 3d | 1 | 0.42mi |
| 2838 NW 19th Pl Cape Coral, FL | 4.0 | 2.0 | 1650 | $1,845 | $1.12 | 23d | 1 | 0.50mi |
| 2538 NW 24th Pl Cape Coral, FL | 4.0 | 2.0 | 1565 | $1,950 | $1.25 | 3d | 1 | 0.56mi |
| 1823 NW 31st St Cape Coral, FL | 3.0 | 2.0 | 1408 | $1,950 | $1.38 | 3d | 1 | 0.62mi |
| 2901 NW 18th Pl Cape Coral, FL | 3.0 | 2.0 | 1555 | $2,190 | $1.41 | 13d | 1 | 0.64mi |
| 1907 NW 26th St Cape Coral, FL | 3.0 | 2.0 | 1842 | $2,200 | $1.19 | 14d | 1 | 0.69mi |
| 1818 NW 27th Ter Cape Coral, FL | 4.0 | 2.0 | 1665 | $1,975 | $1.19 | 3d | 1 | 0.71mi |
| 2507 NW 25th St Cape Coral, FL | 4.0 | 2.0 | 1842 | $2,200 | $1.19 | 14d | 1 | 0.72mi |
| 2511 NW 25th St Cape Coral, FL | 4.0 | 2.0 | 1842 | $2,200 | $1.19 | 14d | 1 | 0.72mi |
| 2800 NW 25th Ter Cape Coral, FL | 3.0 | 2.0 | 1469 | $2,000 | $1.36 | 3d | 1 | 0.87mi |
| 2423 NW 19th Pl Cape Coral, FL | 4.0 | 2.0 | 1829 | $1,761 | $0.96 | 10d | 1 | 0.89mi |
| 1719 NW 25th Ln Cape Coral, FL | 4.0 | 2.0 | 1829 | $2,291 | $1.25 | 3d | 1 | 0.94mi |
| 2329 NW 27th Ave Cape Coral, FL | 3.0 | 2.0 | 1761 | $2,300 | $1.31 | 15d | 1 | 0.94mi |
| 2812 NW 25th St Cape Coral, FL | 4.0 | 2.0 | 1657 | $1,950 | $1.18 | 23d | 1 | 0.95mi |
| 2928 NW 27th St Cape Coral, FL | 4.0 | 2.0 | 1853 | $1,999 | $1.08 | 23d | 1 | 0.96mi |
| 2928 NW 27th St Cape Coral, FL | 4.0 | 2.0 | 1853 | $1,999 | $1.08 | 21d | 1 | 0.96mi |
| 2152 NW 22nd Pl Cape Coral, FL | 3.0 | 2.0 | 1418 | $2,550 | $1.80 | 11d | 1 | 1.00mi |
| 2302 NW 27th Ave Cape Coral, FL | 3.0 | 2.0 | 2136 | $1,691 | $0.79 | 21d | 1 | 1.02mi |
| 2532 NW 31st Ave Cape Coral, FL | 3.0 | 2.0 | 1750 | $2,400 | $1.37 | 23d | 1 | 1.09mi |
| 2105 NW 22nd Ave Cape Coral, FL | 4.0 | 2.0 | 1833 | $2,265 | $1.24 | 14d | 1 | 1.20mi |
| 2206 NW 17th Pl Cape Coral, FL | 4.0 | 2.0 | 1779 | $2,075 | $1.17 | 23d | 1 | 1.23mi |
| 2001 NW 25th Ave Cape Coral, FL | 3.0 | 2.0 | 1887 | $2,500 | $1.32 | 23d | 1 | 1.29mi |
| 2124 NW 18th Ave Cape Coral, FL | 3.0 | 2.0 | 1556 | $2,000 | $1.29 | 19d | 1 | 1.31mi |
| 1903 NW 22nd Ave Cape Coral, FL | 4.0 | 2.0 | 1984 | $2,200 | $1.11 | 23d | 1 | 1.40mi |
| 1821 NW 23rd Ave Cape Coral, FL | 3.0 | 2.0 | 1876 | $1,856 | $0.99 | 13d | 1 | 1.45mi |
Listing history 10 events
-
2026-06-18days on market $195,000 Active 13 DOM
-
2026-06-17days on market $195,000 Active 12 DOM
-
2026-06-16days on market $195,000 Active 11 DOM
-
2026-06-15days on market $195,000 Active 10 DOM
-
2026-06-13days on market $195,000 Active 8 DOM
-
2026-06-10days on market $195,000 Active 5 DOM
-
2026-06-09days on market $195,000 Active 4 DOM
-
2026-06-08days on market $195,000 Active 3 DOM
-
2026-06-07remarks 695-char remark
-
2026-06-07$195,000 Active 2 DOM
ⓘ Source: listings_history table (triggers on properties + properties_extension) + one-shot
backfill from property_details.listing_events for pre-trigger history.
Tax reassessment forecast FL · Resets to sale price
- Current annual tax
- $2,138 · $178/mo
- Projected year-2 tax
- $2,138 · $178/mo
- Expected delta
- $0/yr ($0/mo · 0.0%)
ⓘ Screening estimate from a state-policy table — verify with the county assessor before closing.
Climate risk First Street
- Flood 6/10 Major FEMA zone X (shaded) · 68% chance over 30 yrs
- Wildfire 7/10 Severe
- Heat 10/10 Extreme 7 d/yr ≥107°F today · 31 d/yr by 30 yrs out
- Wind 10/10 Extreme 99% chance of damaging wind over 30 yrs
- Air quality 2/10 Low 1 unhealthy d/yr today · 1 by 30 yrs out
Nearby sold comps map
Loading sold comps map…
Walkable amenities ~0.75 mi
Loading nearby amenities…
Taxation est. · year 1
- Rental income
- $27,417
- − Mortgage interest
- −$10,923
- − Property taxes
- −$2,138
- − Insurance
- −$975
- − Repairs & maintenance
- −$2,193
- − Management
- −$2,193
- − Depreciation
- −$5,673
- Taxable income
- $3,322
- Est. tax owed @ 24.0%
- −$797
- After-tax cash flow
- $5,478/yr
For passive investors: Depreciation is non-cash, so a rental often shows a tax loss while cash-flowing — sheltering income. Rental losses are passive: they offset passive income freely, and up to $25,000/yr can offset ordinary (W-2) income if you actively participate and your MAGI is under $100k (phasing out to $0 by $150k); unused losses carry forward. On sale, claimed depreciation is recaptured at up to 25%, and gains may owe capital-gains tax (a 1031 exchange can defer both). Figures are a year-1 estimate at your 24.0% rate — not tax advice; consult a CPA.
Schools (NCES district)
- District
- Lee
- NCES district ID
- 1201080
- Math proficiency
- 47% ▼ -11.00%
- Reading proficiency
- 50% ▼ -4.00%
- Median HH income
- $49,518
- Composite
- 41.49/100
- National rank
- #3458
- State rank
- #42 of 73 in FL
Livability — Cape Coral
- Score
- 77/100
- State rank
- #208
- US rank
- #3098
Category grades
Schools grade is shown separately in the Schools card above.
Census & demographics
- Census place
- Cape Coral, FL
- County
- Lee County · 788,662 people
- City population
- 217,388
- Metro
- Cape Coral-Fort Myers, FL
- Population (ZIP)
- 35,580
- Household income
- $90,577
- Rent vs Own
- Severe rent burden
- 286.0
Population outlook (Lee County) Hauer SSP2
- Today (2025)
- 871,946 people
- By 2030
- 955,468 · +9.6%
- By 2040
- 1,113,587 · +27.7%
- By 2050
- 1,256,891 · +44.1%
- By 2075
- 1,560,270 · +78.9%
- By 2100
- 1,726,848 · +98.0%
Race, ethnicity, and origin ACS 2023
- Neighborhood character
- Diverse neighborhood (Simpson 0.58)
- Race & ethnicity
- White 57% Hispanic / Latino 30% Two or more races 21% Black 7% Asian 2%
- Hispanic origin (detail)
- Mexican 2% Puerto Rican 6% Cuban 17% Dominican 1%
- Common ancestry
- Romanian 2% Hispanic 2% Lithuanian 2%
- Foreign-born
- 21% · Canada, Jamaica, China
- Languages at home
- 73% English-only · Spanish 24% French/Haitian/Cajun 1% Russian/Polish/Slavic 1%
Political lean MEDSL · Lee
- 2024 margin
- Strong R (+28.4) · D 35.5% · R 63.9%
- 2008→2024 swing
- -18.0pp toward R · 2008: -10.4pp · 2024: -28.4pp
- All cycles
- 2024: R+28.4 2020: R+19.2 2016: R+20.4 2012: R+16.6 2008: R+10.4
Not yet ingested
- Civics
- —
Market trends
- HPI YoY
- ▼ -55.34%
- Current HPI
- 337.0575
- Rent YoY
- ▼ -5.51%
- Metro
- Cape Coral-Fort Myers, FL
- State GDP YoY
- ▲ 3.28%
- F500 in state
- 36
Industry mix (Fortune 500 HQ in FL)
| Industry | F500 HQs | Revenue |
|---|---|---|
| Industrial Technology | 2 | $29B |
|
||
| Insurance | 2 | $17B |
|
||
| Retail | 1 | $60B |
|
||
| Technology Distribution | 1 | $58B |
|
||
| Homebuilding | 1 | $35B |
|
||
| Technology Manufacturing | 1 | $35B |
|
||
Price history
+18.2% since first listed6 events — show timeline
- 2026-06-05 Listed $195,000 Stellar MLS as Distributed by MLS Grid
- 2026-05-19 Listing Removed — NAPLESMLS
- 2026-05-08 Price Changed $223,000 NAPLESMLS
- 2026-04-30 Listed $199,400 NAPLESMLS
- 2020-02-07 Sold (Public Records) $66,000 Public Records
- 2007-06-04 Sold (Public Records) $165,000 Public Records
Property tax history
+6.2%/yrLatest (2025): $2,138 · +9.1% YoY. Source: county tax records.
Cash-flow waterfall
monthlySold comps — $/sqft
last 12 mo · ≤1 miLoading sold comps…