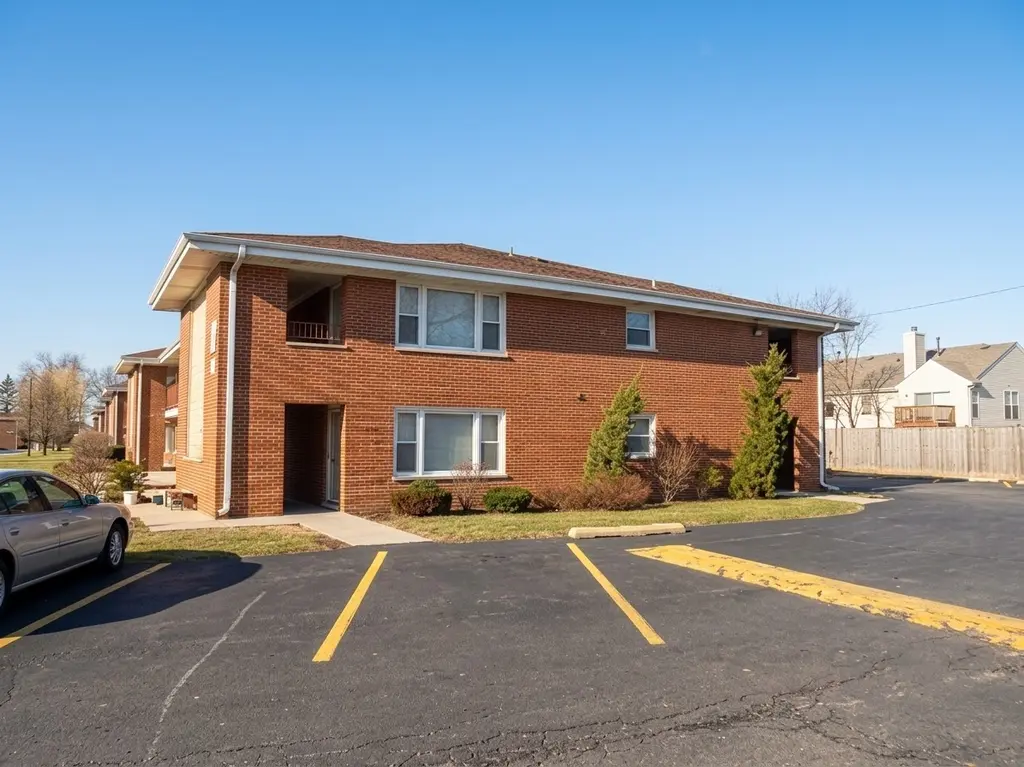
1101 E Algonquin Rd #18 · Arlington Heights, IL
Flood risk 1/10 · Minimal
- FEMA flood zone
- X (unshaded)
- Chance of flooding over 30 yrs
- 0.0%
- Est. flood insurance / yr
- $507 – $1,088
Fire risk 3/10 · Minor
- Est. fire insurance / yr
- $804 – $1,492
Heat risk 3/10 · Minor
- Hot days now (above 100°F)
- 7 days/yr
- Hot days in 30 yrs
- 14 days/yr
Wind risk 2/10 · Minimal
- Chance of severe wind over 30 yrs
- 0.0%
Air-quality risk 4/10 · Minor
- Unhealthy air days now
- 4 days/yr
- Unhealthy air days in 30 yrs
- 5 days/yr
Risk factors via First Street. Map © Google.
Why this score? — see what drove the C grade
The composite is a weighted blend of 9 inputs, each scored 0–100. Each bar is that input's sub-score; the figure is the points it added to the 100-point composite (weight × sub-score).
- Cash flow +22.5/30.0
- 1% rule +8.2/10.0
- ARV discount +7.5/15.0
- DSCR +7.2/10.0
- Livability +4.1/5.0
- Schools +3.9/10.0
- Condition / age +2.5/5.0
- Rent growth +1.3/5.0
- Appreciation +0.0/10.0
$130,000
🖨 Deal sheet 📄 Offer letter ✓ Due diligence
Listing remarks MLS
Great condition condo that only needs paint and appliances. Sold as-is. Submit earnest money as certified funds. Provide proof of funds or pre-approval. Information not guaranteed. Tax proration 100%. 2 Year home warranty for owner occupants. This property is eligible under the Freddie Mac First Look Initiative through 12/26/2011
Key facts
- $250 HOA
- Parking
- Built 1974
Property features AI
Finance
- Other: Part of a building with 20 units
- Financial info: Property currently being leased; Special service area: No
- HOA & community: Monthly association fee of $250; Association fee includes heat, water, exterior maintenance, lawn care, scavenger (trash), and snow removal; Pets allowed (cats and dogs OK), maximum pet weight listed as 99 lbs
Exterior
- Parking: One assigned parking space
- Utilities: Water source: Lake Michigan; Public sewer
- Home design: Attached single-unit condo; Entry level is 2
- Construction: Brick construction; Built approximately 51–60 years ago; Built before 1978
- Exterior features: Common lot/grounds; School bus access; Interstate access
Interior
- Kitchen: Range; Refrigerator
- Bedrooms: Master bedroom (main level, approximately 16 x 12); Three additional bedrooms (one listed as Bedroom 2, Bedroom 3, Bedroom 4)
- Bathrooms: One full bathroom
- Heating & cooling: Natural gas heating with baseboard; Window air conditioning units; Ceiling fan(s)
- Interior features: Four total rooms; Family room; Living room (main level, approximately 19 x 16); Dining area (main level, combo)
- Laundry & utility: Laundry room
Neighborhood map
What this means for you Summary
Snapshot
- This is a 1-bed/1.0-bath condo listed at $130k.
Deal economics
- At list price, monthly cash flow is $219 ($3k/yr) — positive.
- The deal already cash-flows at list — no discount required.
- Meets the 1% rule at list price ($2k rent vs $130k).
- Recommended offer: $128k (1.5% below list) — sets the bar for market timing.
- Cap rate 8.3% vs local median 2.9% in Arlington Heights — top-decile yield for the area; either an underpriced asset or a hidden risk that comps aren't pricing in. Stress-test before assuming the spread holds.
Location & tenants
- Location reads 82/100 on livability (#60 in IL, #1,055 nationally) — a professional / high-income tenant draw. Strengths: crime A+, commute A+, employment A+; Watch: health & safety D+, amenities F, cost of living F.
- Township Hsd 214 (suburban): math 42% / reading 45% proficiency, ranked #103 of 620 in IL (top 17%) — families likely to look elsewhere, expect single-tenant / working-renter base with shorter leases.
- Zoned schools: Rolling Meadows High School (math 35% / reading 39%, grade F, #107 of 693 statewide, top 17%, 2,044 students, 0% FRL).
- Market conditions: Rents falling (-5.0%/yr); 68 active listings in the ZIP; 28 comparable units currently listed for rent nearby; rentals leasing fast (median 3d on market — plan ~1-2 weeks tenant-placement turnaround); solid renter incomes; 6,272 units permitted in Cook County in 2024 (4,658 in 5+ unit buildings).
Forward outlook
- Local home prices are declining (-3.0%/yr); year-one equity from $899 of loan paydown is wiped out by about $4k of value loss. Plan a longer hold.
Negotiation context
- It's been on market 30 days — a 2% lower offer ($128k) is reasonable based on typical stale-listing flexibility.
- 2 sale attempts since 15y ago with the ask held roughly flat each time — persistent listings suggest the price (not the market) is what's stuck; bring a comps-based counter.
- Current owner paid $26k; list at $130k implies a 391% gain — meaningful room to come down on a strong offer.
Questions for the listing agent
- Built in 1974 — when were the roof, HVAC, electrical panel, plumbing, and water heater last replaced?
- What does the HOA fee cover, when was the last increase, and are there any pending special assessments or reserve-fund shortfalls?
- Any open or pending special assessments — roof, HVAC, plumbing, elevator, façade? What's the per-unit balance and payoff schedule, and is the seller paying it off at close or rolling it to the buyer?
- Is there a deadline driving the sale (1031 exchange, divorce, estate, relocation)? That informs how much negotiation room exists.
- Schools are A-rated — typically a magnet for longer-tenancy family renters. What's the average tenant stay here, and is there a school-zone premium baked into asking?
- What's the average days-on-market for RENTAL listings here right now (not sales)? A rising rental-DOM trend means longer vacancies and softer asking-rent achievability than the comps imply.
- What's the recent tenant-quality profile in this submarket — average credit score on applications, eviction rate, late-payment / NSF rate, and stable-employment percentage? A property-management company in the area should have these aggregated.
- How much new apartment / multifamily construction is in the pipeline within 1–3 miles? Heavy new supply (>2% of stock underway) typically softens rents 12–24 months out; light construction supports rent growth.
Investment metrics
- 1% rule
- 1.32% ✓
- Cap rate
- 8.32%
- Cash-on-cash
- 7.23%
- DSCR
- 1.32
- GRM
- 6.3
CMA / ARV
No comps found within radius.
Projected returns pro-forma
-3.0% appreciation · 0.0% rent growth · sell at horizon
- IRR
- -9.3%
- Equity multiple
- 0.67×
- Total profit
- $-11,961
- Equity at exit
- $19,383
- IRR
- -5.7%
- Equity multiple
- 0.69×
- Total profit
- $-11,167
- Equity at exit
- $11,240
Cash invested: $36,400 (down + closing). Projections, not guarantees.
Landlord ↔ Tenant lean methodology
- Overall (STATE)
- 43 Moderately Tenant-Leaning
- State Illinois
- 43 Moderately Tenant-Leaning · D+7
- County
- — inherits STATE
- City
- — inherits STATE
ZIP-level market 60005
- Rents YoY
- -5.0%
- Active inventory
- 68
- Price-to-rent
- 6.3×
Monthly cashflow live
- Estimated rent
- $1,715 high interval (Pro) →
- Mortgage (P&I)
- −$682
- Tax from tax record
- −$150 /mo · $1,796/yr
- Insurance
- −$54
- HOA
- −$250
- Vacancy / Maint / Mgmt
- −$360
- Net cashflow
- $219
Break-even live
UW: 25.0% down · 7.5% · 30yr · 1.5% tax · 5.0% vac · 8.0% maint · 8.0% mgmt
Financing live
Cash to close
- Down payment
- $32,500
- Closing costs
- $3,900
- Reserves months
- —
- Total cash needed
- —
Loan-product check · same deal, 3 products live
Conventional
25% down · 7.5% · 30yr
- Down + closing
- —
- Monthly P&I
- —
- Monthly cashflow
- —
- DSCR
- —
- Eligible?
- —
Personal DTI + credit; lowest rate.
DSCR
20% down · 8.5% · 30yr
- Down + closing
- —
- Monthly P&I
- —
- Monthly cashflow
- —
- DSCR
- —
- Eligible?
- —
No personal income docs; deal must DSCR.
Hard money
10% down · 12.0% · 12mo
- Down + closing
- —
- Monthly P&I
- —
- Monthly cashflow
- —
- DSCR
- —
- Eligible?
- —
Short-term bridge; refi at stabilization.
Rent comps 28 comps
| Address | Beds | Baths | Sqft | Rent | $/sqft | DOM | Units | Dist |
|---|---|---|---|---|---|---|---|---|
| 1119 E Algonquin Rd #2 Arlington Heights, IL | 2.0 | 1.0 | 1100 | $1,745 | $1.59 | 10d | 1 | 0.08mi |
| 1958 W Algonquin Rd Mount Prospect, IL | 1.0–2.0 | 1.0–1.5 | 987 | $1,529 | $1.55 | 1d | 18 | 0.23mi |
| 1910 W Hatherleigh Ct Unit 2E Mount Prospect, IL | 2.0 | 1.0 | 1100 | $1,650 | $1.50 | 10d | 1 | 0.35mi |
| 1900 W Knightsbridge Dr Unit 2A Mt Prospect, IL | 1.0 | 1.0 | 750 | $1,450 | $1.93 | 1d | 1 | 0.35mi |
| 1910 W Hatherleigh Ct Mount Prospect, IL | 1.0–2.0 | 1.0 | 900 | $1,400 | $1.56 | 21d | 2 | 0.36mi |
| 1840 W Hatherleigh Ct Unit 2D Mount Prospect, IL | 1.0 | 1.0 | 750 | $1,500 | $2.00 | 1d | 1 | 0.39mi |
| 2400 S Goebbert Rd Arlington Heights, IL | 2.0 | 2.0 | 991 | $2,172 | $2.19 | 3d | 1 | 0.44mi |
| 2400 S Goebbert Rd Arlington Heights, IL | 1.0 | 1.0 | 695 | $1,825 | $2.63 | 20d | 1 | 0.44mi |
| 2400 S Goebbert Rd Arlington Heights, IL | 1.0 | 1.0 | 695 | $2,450 | $3.53 | 1d | 1 | 0.44mi |
| 2400 S Goebbert Rd Arlington Heights, IL | 1.0 | 1.0 | 695 | $2,425 | $3.49 | 2d | 1 | 0.44mi |
| 707 Falcon Dr Unit 207 Arlington Heights, IL | 2.0 | 1.0 | 1000 | $1,750 | $1.75 | 10d | 1 | 0.45mi |
| 1706 Forest Cove Dr Mount Prospect, IL | 2.0 | 1.0 | 836 | $1,814 | $2.17 | 13d | 1 | 0.49mi |
| 1550 Dempster St Mt Prospect, IL | 1.0–3.0 | 1.0–2.0 | 1225 | $1,410 | $1.15 | 1d | 49 | 0.51mi |
| 1703 W Mansard Ln Unit 103 Mt Prospect, IL | 2.0 | 1.0 | 800 | $1,650 | $2.06 | 1d | 1 | 0.62mi |
| 1703 W Dennis Dr Unit 2 B Mt Prospect, IL | 2.0 | 1.0 | 900 | $1,675 | $1.86 | 1d | 1 | 0.63mi |
| 2226 S Goebbert Rd #471 Arlington Heights, IL | 2.0 | 2.0 | 1000 | $1,900 | $1.90 | 2d | 1 | 0.65mi |
| 2214 S Goebbert Rd Arlington Heights, IL | 2.0 | 2.0 | 1075 | $2,048 | $1.90 | 7d | 2 | 0.70mi |
| 2214 S Goebbert Rd #478 Arlington Heights, IL | 2.0 | 2.0 | 1100 | $2,100 | $1.91 | 2d | 1 | 0.70mi |
| 2134 S Goebbert Rd Arlington Heights, IL | 1.0–3.0 | 1.0–2.0 | 864 | $1,470 | $1.70 | 1d | 72 | 0.75mi |
| 25 E Algonquin Rd Arlington Heights, IL | 3.0 | 1.0–2.0 | 925 | $2,817 | $3.05 | 1d | 142 | 0.76mi |
| 726 Dempster St #5 Mt Prospect, IL | 2.0 | 1.0 | 1100 | $1,850 | $1.68 | 1d | 1 | 0.79mi |
| 1308 S Sir Galahad Ln Mount Prospect, IL | 2.0 | 1.0 | 850 | $1,660 | $1.95 | 1d | 2 | 1.13mi |
| 710 W Huntington Commons Rd Unit 1A Mt Prospect, IL | 1.0 | 1.0 | 700 | $1,350 | $1.93 | 16d | 1 | 1.15mi |
| 710 W Huntington Commons Rd Unit 3A Mt Prospect, IL | 1.0 | 1.0 | 750 | $1,450 | $1.93 | 13d | 1 | 1.15mi |
| 710 W Huntington Commons Rd Unit 2B Mt Prospect, IL | 2.0 | 1.0 | 900 | $1,699 | $1.89 | 10d | 1 | 1.16mi |
| 601 W Huntington Commons Rd Mount Prospect, IL | 2.0 | 1.5 | 1100 | $2,300 | $2.09 | 1d | 1 | 1.28mi |
| 1300 S Elmhurst Rd Mount Prospect, IL | 1.0–3.0 | 1.0–2.0 | 950 | $1,600 | $1.68 | 1d | 1 | 1.44mi |
| 650 Perrie Dr #301 Elk Grove Village, IL | 1.0 | 1.0 | 700 | $1,650 | $2.36 | 1d | 1 | 1.49mi |
HOA detail condo
- Monthly dues
- $250 · $3,000/yr
- Assessments
- None detected in remarks — confirm with the listing agent.
Listing history 18 events
-
2026-06-18days on market $130,000 Active 30 DOM
-
2026-06-17statusdays on market $130,000 Active 29 DOM
-
2026-06-16days on market $130,000 Contingent - Continue to Show 28 DOM
-
2026-06-15days on market $130,000 Contingent - Continue to Show 27 DOM
-
2026-06-13days on market $130,000 Contingent - Continue to Show 25 DOM
-
2026-06-10days on market $130,000 Contingent - Continue to Show 22 DOM
-
2026-06-09days on market $130,000 Contingent - Continue to Show 21 DOM
-
2026-06-08days on market $130,000 Contingent - Continue to Show 20 DOM
-
2026-06-07days on market $130,000 Contingent - Continue to Show 19 DOM
-
2026-06-04statusdays on market $130,000 Contingent - Continue to Show 16 DOM
-
2026-06-03days on market $130,000 Active 15 DOM
-
2026-06-02days on market $130,000 Active 14 DOM
-
2026-06-01days on market $130,000 Active 13 DOM
-
2026-05-31days on market $130,000 Active 12 DOM
-
2026-05-20$130,000 Active
-
2012-01-31soldstatus $26,500 Closed Sale 331-char remark
Show marketing remark (331 chars)
Great condition condo that only needs paint and appliances. Sold as-is. Submit earnest money as certified funds. Provide proof of funds or pre-approval. Information not guaranteed. Tax proration 100%. 2 Year home warranty for owner occupants. This property is eligible under the Freddie Mac First Look Initiative through 12/26/2011
-
2012-01-14status Pending 331-char remark
Show marketing remark (331 chars)
Great condition condo that only needs paint and appliances. Sold as-is. Submit earnest money as certified funds. Provide proof of funds or pre-approval. Information not guaranteed. Tax proration 100%. 2 Year home warranty for owner occupants. This property is eligible under the Freddie Mac First Look Initiative through 12/26/2011
-
2011-12-12$28,900 New 331-char remark
Show marketing remark (331 chars)
Great condition condo that only needs paint and appliances. Sold as-is. Submit earnest money as certified funds. Provide proof of funds or pre-approval. Information not guaranteed. Tax proration 100%. 2 Year home warranty for owner occupants. This property is eligible under the Freddie Mac First Look Initiative through 12/26/2011
ⓘ Source: listings_history table (triggers on properties + properties_extension) + one-shot
backfill from property_details.listing_events for pre-trigger history.
Tax reassessment forecast IL · Partial reset (capped growth)
- Current annual tax
- $1,796 · $150/mo
- Projected year-2 tax
- $2,374 · $198/mo
- Expected delta
- +$577/yr (+$48/mo · 32.1%)
ⓘ Screening estimate from a state-policy table — verify with the county assessor before closing.
Climate risk First Street
- Flood 1/10 Low FEMA zone X (unshaded) · 0% chance over 30 yrs
- Wildfire 3/10 Moderate
- Heat 3/10 Moderate 7 d/yr ≥100°F today · 14 d/yr by 30 yrs out
- Wind 2/10 Low 0% chance of damaging wind over 30 yrs
- Air quality 4/10 Moderate 4 unhealthy d/yr today · 5 by 30 yrs out
Nearby sold comps map
Loading sold comps map…
Walkable amenities ~0.75 mi
Loading nearby amenities…
Taxation est. · year 1
- Rental income
- $20,578
- − Mortgage interest
- −$7,282
- − Property taxes
- −$1,796
- − Insurance
- −$650
- − Repairs & maintenance
- −$1,646
- − Management
- −$1,646
- − HOA
- −$3,000
- − Depreciation
- −$3,782
- Taxable income
- $776
- Est. tax owed @ 24.0%
- −$186
- After-tax cash flow
- $2,444/yr
For passive investors: Depreciation is non-cash, so a rental often shows a tax loss while cash-flowing — sheltering income. Rental losses are passive: they offset passive income freely, and up to $25,000/yr can offset ordinary (W-2) income if you actively participate and your MAGI is under $100k (phasing out to $0 by $150k); unused losses carry forward. On sale, claimed depreciation is recaptured at up to 25%, and gains may owe capital-gains tax (a 1031 exchange can defer both). Figures are a year-1 estimate at your 24.0% rate — not tax advice; consult a CPA.
Schools (NCES district)
- District
- Township Hsd 214
- NCES district ID
- 1704170
- Math proficiency
- 42% ▼ -10.00%
- Reading proficiency
- 45% ▼ -4.00%
- Median HH income
- $68,267
- Composite
- 39.13/100
- National rank
- #4035
- State rank
- #103 of 620 in IL
Livability — Arlington Heights
- Score
- 82/100
- State rank
- #60
- US rank
- #1055
Category grades
Schools grade is shown separately in the Schools card above.
Census & demographics
- Census place
- Arlington Heights, IL
- County
- Cook County · 4,486,803 people
- City population
- 80,678
- Metro
- Chicago-Naperville-Elgin, IL-IN-WI
- Population (ZIP)
- 28,843
- Household income
- $99,743
- Rent vs Own
- Severe rent burden
- 818.0
Population outlook (Cook County) Hauer SSP2
- Today (2025)
- 5,347,519 people
- By 2030
- 5,357,703 · +0.2%
- By 2040
- 5,324,924 · -0.4%
- By 2050
- 5,230,762 · -2.2%
- By 2075
- 4,785,735 · -10.5%
- By 2100
- 4,188,836 · -21.7%
Race, ethnicity, and origin ACS 2023
- Neighborhood character
- Predominantly White (71%)
- Race & ethnicity
- White 71% Hispanic / Latino 15% Two or more races 11% Asian 8% Black 3%
- Hispanic origin (detail)
- Mexican 6% Puerto Rican 5% Cuban 1%
- Common ancestry
- Romanian 13% French 3% Slovak 2%
- Foreign-born
- 26% · Canada, South Korea, China
- Languages at home
- 64% English-only · Russian/Polish/Slavic 13% Spanish 10% Other Indo-European 6%
Political lean MEDSL · Cook
- 2024 margin
- Solid D (+42.0) · D 70.4% · R 28.4% · Other 1.2%
- 2008→2024 swing
- -11.4pp toward R · 2008: 53.4pp · 2024: 42.0pp
- All cycles
- 2024: D+42.0 2020: D+50.3 2016: D+53.0 2012: D+49.4 2008: D+53.4
Not yet ingested
- Civics
- —
Market trends
- HPI YoY
- ▼ -301.88%
- Current HPI
- 209.777
- Rent YoY
- ▼ -4.96%
- Metro
- Chicago-Naperville-Elgin, IL-IN-WI
- State GDP YoY
- ▲ 1.59%
- F500 in state
- 60
Industry mix (Fortune 500 HQ in IL)
| Industry | F500 HQs | Revenue |
|---|---|---|
| Insurance | 4 | $201B |
|
||
| Consumer Goods | 4 | $87B |
|
||
| Industrial Machinery | 3 | $64B |
|
||
| Healthcare | 2 | $55B |
|
||
| Retail / Pharmacy | 1 | $148B |
|
||
| Agriculture / Food | 1 | $86B |
|
||
Price history
+349.8% since first listed4 events — show timeline
- 2026-05-20 Listed $130,000 MRED as Distributed by MLS Grid
- 2012-01-31 Sold (MLS) $26,500 MRED as Distributed by MLS Grid
- 2012-01-14 Pending — MRED as Distributed by MLS Grid
- 2011-12-12 Listed $28,900 MRED as Distributed by MLS Grid
Property tax history
+0.9%/yrLatest (2023): $1,796 · +4.8% YoY. Source: county tax records.
Cash-flow waterfall
monthlySold comps — $/sqft
last 12 mo · ≤1 miLoading sold comps…