 Duplex
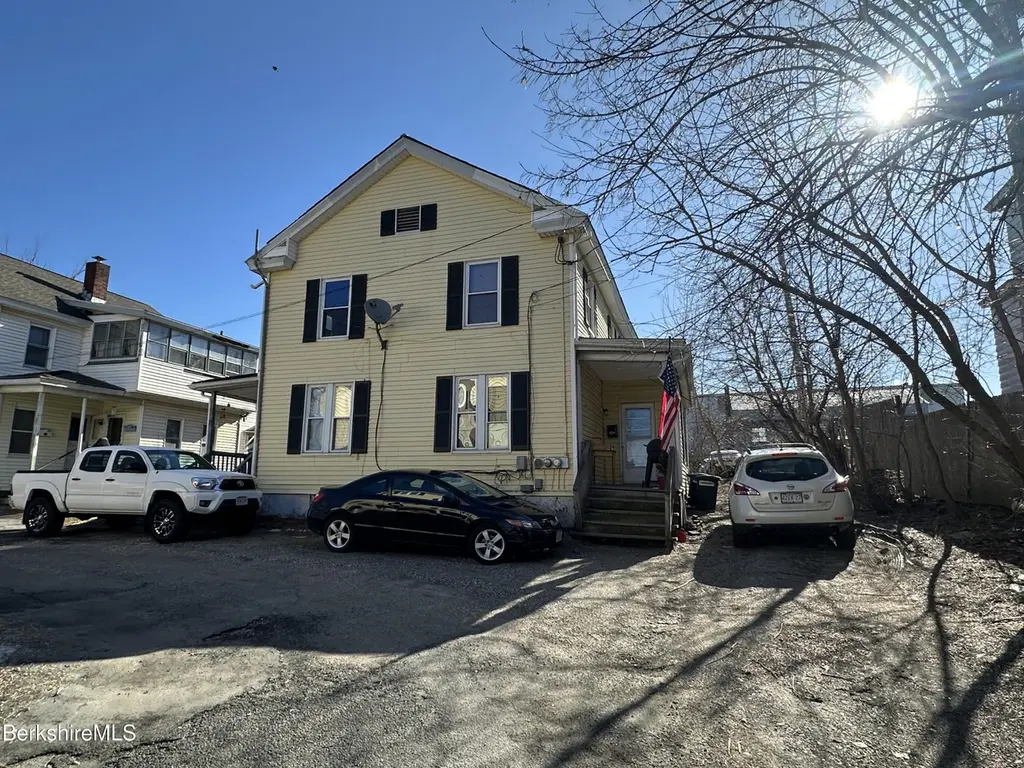
15-17 Noble Ave · Pittsfield, MA
Flood risk 1/10 · Minimal
- FEMA flood zone
- X
- Chance of flooding over 30 yrs
- 0.0%
- Est. flood insurance / yr
- $473 – $860
Fire risk 1/10 · Minimal
- Est. fire insurance / yr
- $915 – $1,699
Heat risk 3/10 · Minor
- Hot days now (above 92°F)
- 7 days/yr
- Hot days in 30 yrs
- 17 days/yr
Wind risk 4/10 · Minor
- Chance of severe wind over 30 yrs
- 10.0%
Air-quality risk 2/10 · Minimal
- Unhealthy air days now
- 1 days/yr
- Unhealthy air days in 30 yrs
- 1 days/yr
Risk factors via First Street. Map © Google.
Why this score? — see what drove the C+ grade
The composite is a weighted blend of 9 inputs, each scored 0–100. Each bar is that input's sub-score; the figure is the points it added to the 100-point composite (weight × sub-score).
- Cash flow +26.1/30.0
- DSCR +8.8/10.0
- ARV discount +7.5/15.0
- 1% rule +6.9/10.0
- Rent growth +4.4/5.0
- Livability +3.8/5.0
- Schools +2.3/10.0
- Condition / age +2.2/5.0
- Appreciation +0.0/10.0
$235,000
🖨 Deal sheet 📄 Offer letter ✓ Due diligence
Multi-family units
County records classify this as Multi-Family (5+ Unit). Listing-text estimate: 2 units. estimate disagrees with records
5+ unit building — per-unit beds/baths from public records are typically unavailable; the breakdown below (if shown) is an estimate from the listing text.
Listing remarks MLS
Two family duplex just outside of downtown. Featuring two bedrooms and one bathroom in each unit with hardwood floors. Off Street parking and separate utilities. Please reach out for interior photos.
Key facts
- Two family duplex
- Separate utilities
- Off street parking
Tags
Neighborhood map
What this means for you Summary
Snapshot
- This is a 2 × 2-bed/1.0-bath units multifamily listed at $235k. Condition is rated fair.
Deal economics
- At list price, monthly cash flow is $594 ($7k/yr) — positive. Per door: $297/mo.
- The deal already cash-flows at list — no discount required.
- Meets the 1% rule at list price ($3k rent vs $235k).
- Recommended offer: $221k (6.0% below list) — sets the bar for market timing.
- Cap rate 9.3% vs local median 3.6% in Pittsfield — top-decile yield for the area; either an underpriced asset or a hidden risk that comps aren't pricing in. Stress-test before assuming the spread holds.
Location & tenants
- Location reads 75/100 on livability (#70 in MA, #3,820 nationally) — a middle-class / working-renter tenant base. Strengths: commute A+, housing A+, health & safety A+; Watch: employment C-, amenities D+, schools D.
- Pittsfield (urban): math 19% / reading 34% proficiency, ranked #272 of 302 in MA (top 90%) — low school quality limits family demand, transient renter base, plan for 1-2y turnover.
- Market conditions: Rents rising fast (+7.7%/yr); 275 active listings in the ZIP; 4 comparable units currently listed for rent nearby; rentals lingering (median 44d on market — plan ~5-8 weeks vacancy on turnover, expect pricing pressure); 100% of comp listings sitting > 30 days — soft ceiling on asking rent; 130 units permitted in Berkshire County in 2024 (10 in 5+ unit buildings).
- At $2,808/mo this rent would consume 47% of the median local household income ($71k/yr) (locally 1580% of renters already pay >50% of income on rent) — very limited rent-growth headroom before tenants either downsize or default.
Forward outlook
- Local home prices are declining (-3.0%/yr); year-one equity from $2k of loan paydown is wiped out by about $7k of value loss. Plan a longer hold.
- Berkshire County population projected at -24% by 2050 — secular population decline; favor cash flow + early exit over multi-decade hold.
- At projected returns (-3.0% appreciation + 7.7% rent growth), your $66k cash investment doubles in ~8 years — after that, you're playing with house money.
Negotiation context
- It's been on market 80 days — a 6% lower offer ($221k) is reasonable based on typical stale-listing flexibility.
- 2 sale attempts since 2y ago with the ask held roughly flat each time — persistent listings suggest the price (not the market) is what's stuck; bring a comps-based counter.
Risks & watch-outs
- Watch-outs: built in 1850 — expect roof / HVAC / electrical / plumbing capex.
Questions for the listing agent
- It's been on market 80 days. Have you received any prior offers? Is the seller open to a 6% concession, seller financing, or rate buy-down credit?
- Can we see the unit-by-unit rent roll, current vacancy, and any below-market leases? What's the average tenancy length?
- What capital expenditures (roof, boiler, parking lot, exteriors) have been made in the last 5 years, and what's planned in the next 2?
- Have any recent inspections been done? Can we get a copy of the seller's disclosures and any deferred-maintenance estimates?
- Built in 1850 — when were the roof, HVAC, electrical panel, plumbing, and water heater last replaced?
- Why hasn't it sold? Are there any deal-killer items the seller is aware of (foundation, flood, title, zoning, code violations)?
- Is there a deadline driving the sale (1031 exchange, divorce, estate, relocation)? That informs how much negotiation room exists.
- Schools are D-rated, which usually means shorter tenancies and higher turnover. Who's the typical renter profile here, and what's been the actual vacancy rate?
- Crime grade is D in this area — have there been break-ins, vandalism, or insurance claims at this property in the last 3 years? What carrier currently insures it and at what premium?
- What's the average days-on-market for RENTAL listings here right now (not sales)? A rising rental-DOM trend means longer vacancies and softer asking-rent achievability than the comps imply.
- What's the recent tenant-quality profile in this submarket — average credit score on applications, eviction rate, late-payment / NSF rate, and stable-employment percentage? A property-management company in the area should have these aggregated.
- How much new apartment / multifamily construction is in the pipeline within 1–3 miles? Heavy new supply (>2% of stock underway) typically softens rents 12–24 months out; light construction supports rent growth.
Investment metrics
- 1% rule
- 1.19% ✓
- Cap rate
- 9.33%
- Cash-on-cash
- 10.84%
- DSCR
- 1.48
- GRM
- 7.0
CMA / ARV
- ARV (median comp)
- $234,909
- List price
- $235,000
- Delta
- 0.04%
- Verdict
- FAIR
- Comps
- 20 within 1.0 mi
Show comp detail 12 sales within ~0.75 mi
| Address | Dist | Beds/Ba | Sqft | Sold | Price | $/sf | Match |
|---|---|---|---|---|---|---|---|
| 92 W Housatonic St | 0.14mi | 3/2.0 (-1) | 1,872 (-4%) | 8mo | $235,000 | $126 | 76 |
| 36 Division St | 0.46mi | 4/2.0 | 1,832 (-6%) | 10mo | $250,000 | $136 | 60 |
| 5-7 Wallace Pl | 0.64mi | 4/2.0 | 1,964 (+1%) | 12mo | $250,000 | $127 | 59 |
| 39 Circular Ave | 0.46mi | 4/2.0 | 1,728 (-11%) | 6mo | $209,900 | $121 | 55 |
| 171 Francis Ave | 0.65mi | 4/2.0 | 2,045 (+5%) | 11mo | $100,000 | $49 | 52 |
| 308-310 West St | 0.46mi | 4/3.0 | 1,802 (-7%) | 13mo | $128,625 | $71 | 51 |
| 70-72 Elm St | 0.69mi | 4/2.0 | 1,780 (-9%) | 4mo | $282,710 | $159 | 50 |
| 19 Harding St | 0.65mi | 5/2.0 (+1) | 2,000 (+3%) | 21mo | $310,000 | $155 | 43 |
| 500 Fenn St | 0.71mi | 4/3.0 | 2,208 (+13%) | 5mo | $285,000 | $129 | 36 |
| 217-219 Bradford St | 0.69mi | 5/2.0 (+1) | 2,160 (+11%) | 12mo | $233,200 | $108 | 34 |
| 52 Merriam St | 0.57mi | 4/2.0 | 2,208 (+13%) | 21mo | $297,000 | $135 | 34 |
| 138 Second St | 0.70mi | 5/2.0 (+1) | 2,096 (+8%) | 22mo | $235,000 | $112 | 31 |
Match score weights: distance 35% · size 25% · config 20% · recency 20%. Top-matched comps best support the ARV.
Projected returns pro-forma
-3.0% appreciation · 7.72% rent growth · sell at horizon
- IRR
- 5.1%
- Equity multiple
- 1.21×
- Total profit
- $13,783
- Equity at exit
- $35,039
- IRR
- 18.5%
- Equity multiple
- 2.89×
- Total profit
- $124,121
- Equity at exit
- $20,319
Cash invested: $65,800 (down + closing). Projections, not guarantees.
Landlord ↔ Tenant lean methodology
- Overall (STATE)
- 20 Strongly Tenant-Friendly
- State Massachusetts
- 20 Strongly Tenant-Friendly · D+15
- County
- — inherits STATE
- City
- — inherits STATE
ZIP-level market 01201
- Rents YoY
- 7.7%
- Active inventory
- 275
- Price-to-rent
- 13.9×
Monthly cashflow live
- Estimated rent
- $2,808 high interval (Pro) →
- Mortgage (P&I)
- −$1,232
- Tax est. 1.5%
- −$294 /mo · $3,525/yr
- Insurance
- −$98
- HOA
- −$0
- Vacancy / Maint / Mgmt
- −$590
- Net cashflow
- $594
Break-even live
2-unit breakdown (identical units grouped — click to expand)
| Units | Beds | Baths | Est. rent |
|---|---|---|---|
| 2× units | 2 | 1 | $2,808 |
| #1 | 2 | 1 | $1,404 |
| #2 | 2 | 1 | $1,404 |
| Total (2 units) | $2,808 | ||
UW: 25.0% down · 7.5% · 30yr · 1.5% tax · 5.0% vac · 8.0% maint · 8.0% mgmt
Financing live
Cash to close
- Down payment
- $58,750
- Closing costs
- $7,050
- Reserves months
- —
- Total cash needed
- —
Loan-product check · same deal, 3 products live
Conventional
25% down · 7.5% · 30yr
- Down + closing
- —
- Monthly P&I
- —
- Monthly cashflow
- —
- DSCR
- —
- Eligible?
- —
Personal DTI + credit; lowest rate.
DSCR
20% down · 8.5% · 30yr
- Down + closing
- —
- Monthly P&I
- —
- Monthly cashflow
- —
- DSCR
- —
- Eligible?
- —
No personal income docs; deal must DSCR.
Hard money
10% down · 12.0% · 12mo
- Down + closing
- —
- Monthly P&I
- —
- Monthly cashflow
- —
- DSCR
- —
- Eligible?
- —
Short-term bridge; refi at stabilization.
Rent comps 4 comps
| Address | Beds | Baths | Sqft | Rent | $/sqft | DOM | Units | Dist |
|---|---|---|---|---|---|---|---|---|
| 19 Atwood Ave Pittsfield, MA | 3.0 | 1.0 | 1350 | $1,600 | $1.19 | 43d | 1 | 0.19mi |
| 117 Lincoln St Unit 117 Pittsfield, MA | 4.0 | 2.0 | 1500 | $2,000 | $1.33 | 43d | 1 | 0.96mi |
| 88 Wahconah St Pittsfield, MA | 4.0 | 1.5 | 1292 | $2,300 | $1.78 | 43d | 1 | 1.18mi |
| 76 Stoddard Ave Unit 78 Pittsfield, MA | 4.0 | 1.5 | 1560 | $2,000 | $1.28 | 43d | 1 | 1.18mi |
Listing history 18 events
-
2026-06-19days on market $235,000 Active 80 DOM
-
2026-06-18pricedays on market $235,000 Active 79 DOM
-
2026-06-17days on market $245,000 Active 78 DOM
-
2026-06-16days on market $245,000 Active 77 DOM
-
2026-06-15days on market $245,000 Active 76 DOM
-
2026-06-14days on market $245,000 Active 74 DOM
-
2026-06-12days on market $245,000 Active 73 DOM
-
2026-06-09days on market $245,000 Active 70 DOM
-
2026-06-08days on market $245,000 Active 69 DOM
-
2026-06-07days on market $245,000 Active 68 DOM
-
2026-06-05days on market $245,000 Active 65 DOM
-
2026-06-02days on market $245,000 Active 63 DOM
-
2026-06-01days on market $245,000 Active 62 DOM
-
2026-05-31days on market $245,000 Active 61 DOM
-
2026-05-30days on market $245,000 Active 60 DOM
-
2026-03-31$245,000 Active 199-char remark
Show marketing remark (199 chars)
Two family duplex just outside of downtown. Featuring two bedrooms and one bathroom in each unit with hardwood floors. Off Street parking and separate utilities. Please reach out for interior photos.
-
2024-04-10historical $1,400
-
2024-03-19$1,400
ⓘ Source: listings_history table (triggers on properties + properties_extension) + one-shot
backfill from property_details.listing_events for pre-trigger history.
Climate risk First Street
- Flood 1/10 Low FEMA zone X · 0% chance over 30 yrs
- Wildfire 1/10 Low
- Heat 3/10 Moderate 7 d/yr ≥92°F today · 17 d/yr by 30 yrs out
- Wind 4/10 Moderate 10% chance of damaging wind over 30 yrs
- Air quality 2/10 Low 1 unhealthy d/yr today · 1 by 30 yrs out
Nearby sold comps map
Loading sold comps map…
Walkable amenities ~0.75 mi
Loading nearby amenities…
Taxation est. · year 1
- Rental income
- $33,696
- − Mortgage interest
- −$13,164
- − Property taxes
- −$3,525
- − Insurance
- −$1,175
- − Repairs & maintenance
- −$2,696
- − Management
- −$2,696
- − Depreciation
- −$6,836
- Taxable income
- $3,605
- Est. tax owed @ 24.0%
- −$865
- After-tax cash flow
- $6,266/yr
For passive investors: Depreciation is non-cash, so a rental often shows a tax loss while cash-flowing — sheltering income. Rental losses are passive: they offset passive income freely, and up to $25,000/yr can offset ordinary (W-2) income if you actively participate and your MAGI is under $100k (phasing out to $0 by $150k); unused losses carry forward. On sale, claimed depreciation is recaptured at up to 25%, and gains may owe capital-gains tax (a 1031 exchange can defer both). Figures are a year-1 estimate at your 24.0% rate — not tax advice; consult a CPA.
Condition & rehab AI · 5 photos
This two-family duplex requires significant repairs and maintenance to bring it up to a fair condition. Investing in exterior painting, roof repair, flooring replacement, interior painting, and system repairs would significantly increase its resale and rental value.
Repairs flagged
- Major exterior siding — Significant wear and tear
- Major roof — No visible damage, but age is unknown
- Major flooring — No visible flooring, but age is unknown
- Major interior walls/paint — No visible interior, but age is unknown
- Major systems — No visible systems, but age is unknown
Value-add opportunities
- Both paint exterior — Enhances curb appeal and value
- Both repair roof — Prevents water damage and increases value
- Both replace flooring — Improves living space and value
- Both paint interior — Enhances interior appearance and value
- Both repair systems — Ensures functionality and increases value
Renovation cost estimate screening
| Repair item | Severity | Est. cost |
|---|---|---|
| exterior siding · Significant wear and tear | Major | $15,000–50,000 |
| roof · No visible damage, but age is unknown | Major | $15,000–50,000 |
| flooring · No visible flooring, but age is unknown | Major | $15,000–50,000 |
| interior walls/paint · No visible interior, but age is unknown | Major | $15,000–50,000 |
| systems · No visible systems, but age is unknown | Major | $15,000–50,000 |
| Total estimated repair cost · 5 items | $75,000–250,000 |
Value-add ROI direction
- Both paint exterior — Enhances curb appeal and value ↑
- Both repair roof — Prevents water damage and increases value ↑
- Both replace flooring — Improves living space and value ↑
- Both paint interior — Enhances interior appearance and value ↑
- Both repair systems — Ensures functionality and increases value ↑
ⓘ Cost ranges are severity-bucket heuristics (US national rule-of-thumb). Get contractor quotes + a written scope before underwriting a rehab budget.
Schools (NCES district)
- District
- Pittsfield
- NCES district ID
- 2509630
- Math proficiency
- 19% ▼ -10.00%
- Reading proficiency
- 34% ▼ -2.00%
- Median HH income
- $44,032
- Composite
- 22.67/100
- National rank
- #8046
- State rank
- #272 of 302 in MA
Livability — Pittsfield
- Score
- 75/100
- State rank
- #70
- US rank
- #3820
Category grades
Schools grade is shown separately in the Schools card above.
Census & demographics
- Census place
- Pittsfield, MA
- County
- Berkshire County · 44,848 people
- City population
- 44,848
- Metro
- Pittsfield, MA
- Population (ZIP)
- 44,848
- Household income
- $71,093
- Rent vs Own
- Severe rent burden
- 1580.0
Population outlook (Berkshire County) Hauer SSP2
- Today (2025)
- 119,723 people
- By 2030
- 114,608 · -4.3%
- By 2040
- 102,806 · -14.1%
- By 2050
- 91,305 · -23.7%
- By 2075
- 71,517 · -40.3%
- By 2100
- 57,988 · -51.6%
Race, ethnicity, and origin ACS 2023
- Neighborhood character
- Predominantly White (78%)
- Race & ethnicity
- White 78% Two or more races 10% Hispanic / Latino 9% Black 5% Asian 1%
- Hispanic origin (detail)
- Puerto Rican 3%
- Common ancestry
- Lithuanian 8% Romanian 6% Slovak 2%
- Foreign-born
- 7% · Canada, Jamaica
- Languages at home
- 90% English-only · Spanish 6% Other Indo-European 1% Russian/Polish/Slavic 1%
Political lean MEDSL · Berkshire
- 2024 margin
- Solid D (+39.9) · D 68.9% · R 29.0% · Other 2.1%
- 2008→2024 swing
- -12.5pp toward R · 2008: 52.4pp · 2024: 39.9pp
- All cycles
- 2024: D+39.9 2020: D+47.1 2016: D+41.5 2012: D+53.7 2008: D+52.4
Not yet ingested
- Civics
- —
Market trends
- HPI YoY
- ▼ -199.88%
- Current HPI
- 283.3421
- Rent YoY
- ▲ 7.72%
- Metro
- Pittsfield, MA
- State GDP YoY
- ▲ 2.28%
- F500 in state
- 38
Industry mix (Fortune 500 HQ in MA)
| Industry | F500 HQs | Revenue |
|---|---|---|
| Technology | 3 | $17B |
|
||
| Insurance | 2 | $84B |
|
||
| Retail | 2 | $76B |
|
||
| Life Sciences | 1 | $43B |
|
||
| Energy Technology | 1 | $31B |
|
||
| Aerospace / Defense | 1 | $18B |
|
||
Price history
+17400.0% since first listed3 events — show timeline
- 2026-03-31 Listed $245,000 BCMLS
- 2024-04-10 Rental Removed $1,400 APPFOLIO
- 2024-03-19 Listed for Rent $1,400 APPFOLIO
Cash-flow waterfall
monthlySold comps — $/sqft
last 12 mo · ≤1 miLoading sold comps…