 Duplex
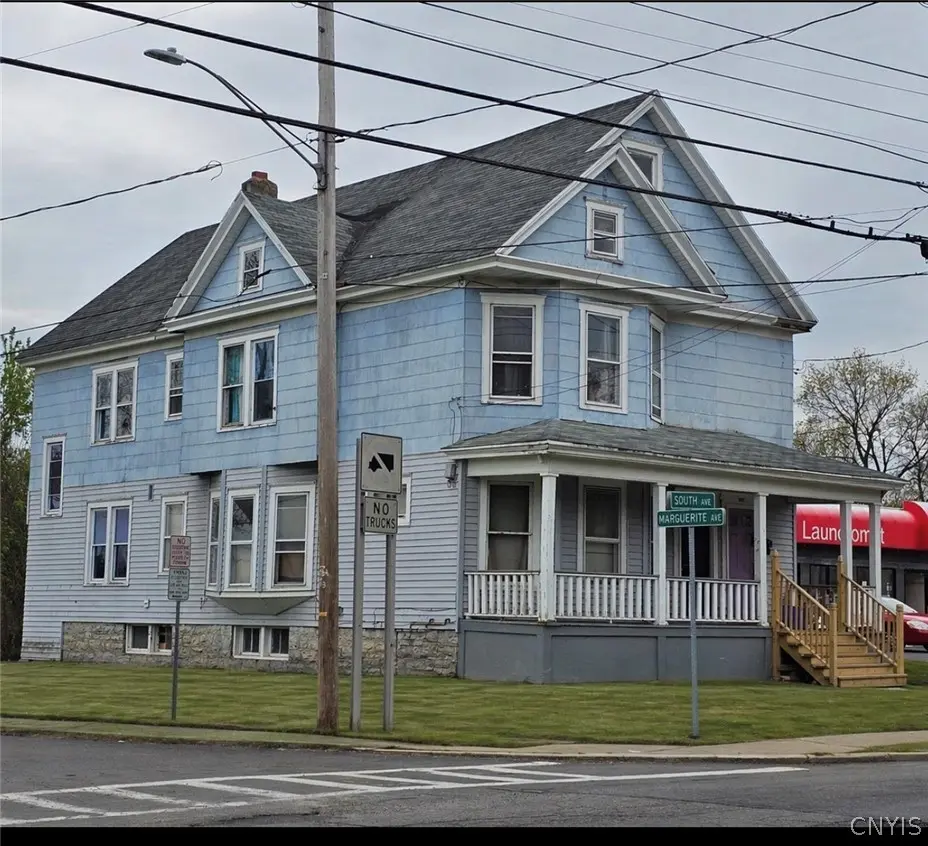
1801 South Ave #3 · Syracuse, NY
Flood risk 1/10 · Minimal
- FEMA flood zone
- X (unshaded)
- Chance of flooding over 30 yrs
- 0.0%
- Est. flood insurance / yr
- $473 – $860
Fire risk 1/10 · Minimal
- Est. fire insurance / yr
- $691 – $1,283
Heat risk 3/10 · Minor
- Hot days now (above 95°F)
- 7 days/yr
- Hot days in 30 yrs
- 16 days/yr
Wind risk 1/10 · Minimal
- Chance of severe wind over 30 yrs
- 0.0%
Air-quality risk 2/10 · Minimal
- Unhealthy air days now
- 0 days/yr
- Unhealthy air days in 30 yrs
- 1 days/yr
Risk factors via First Street. Map © Google.
Why this score? — see what drove the B grade
The composite is a weighted blend of 9 inputs, each scored 0–100. Each bar is that input's sub-score; the figure is the points it added to the 100-point composite (weight × sub-score).
- Cash flow +30.0/30.0
- ARV discount +10.9/15.0
- 1% rule +10.0/10.0
- DSCR +10.0/10.0
- Livability +3.9/5.0
- Rent growth +2.5/5.0
- Condition / age +2.5/5.0
- Schools +1.8/10.0
- Appreciation +0.0/10.0
$185,000
🖨 Deal sheet 📄 Offer letter ✓ Due diligence
Multi-family units
County records classify this as Multi-Family (2-4 Unit). Listing-text estimate: 2 units. confirmed
Listing remarks MLS
Solid 2-unit investment property!!! This building features two 3-bedroom units . Separate utilities with individual meters allow tenants to pay their own gas and electric, reducing owner expenses. Upstairs apartment has new flooring. This property offers great potential with some updates and personal touches needed. This property has great potential for owner occupied or ideal for investors looking to grow their portfolio.
Key facts
- 4,822 sq ft lot
- Built 1875
- Listed 40 days
Neighborhood map
What this means for you Summary
Snapshot
- This is a 2 × 3-bed/1.0-bath units multifamily listed at $185k.
Deal economics
- At list price, monthly cash flow is $2k ($20k/yr) — positive. Per door: $848/mo.
- The deal already cash-flows at list — no discount required.
- Meets the 1% rule at list price ($4k rent vs $185k).
- Recommended offer: $179k (3.0% below list) — sets the bar for market timing.
- Cap rate 17.3% vs local median 8.2% in Syracuse — top-decile yield for the area; either an underpriced asset or a hidden risk that comps aren't pricing in. Stress-test before assuming the spread holds.
Location & tenants
- Location reads 77/100 on livability (#187 in NY, #2,869 nationally) — a middle-class / working-renter tenant base. Strengths: amenities A+, commute A+, cost of living A+; Watch: schools D+, crime F, employment D-.
- Syracuse City School District (urban): math 18% / reading 26% proficiency, ranked #590 of 590 in NY (top 100%) — low school quality limits family demand, transient renter base, plan for 1-2y turnover; 74% free/reduced lunch — lower-income household profile, screen leases tightly.
- Market conditions: 63 active listings in the ZIP; 1 comparable units currently listed for rent nearby; 616 units permitted in Onondaga County in 2024 (256 in 5+ unit buildings).
Forward outlook
- Local home prices are declining (-3.0%/yr); year-one equity from $1k of loan paydown is wiped out by about $6k of value loss. Plan a longer hold.
- Onondaga County population projected to shrink 9% by 2050 — rents likely to lag national; underwrite the cash flow, not the appreciation.
- At projected returns (-3.0% appreciation + 3.0% rent growth), your $52k cash investment doubles in ~3 years — after that, you're playing with house money.
Negotiation context
- It's been on market 40 days — a 3% lower offer ($179k) is reasonable based on typical stale-listing flexibility.
Risks & watch-outs
- Watch-outs: built in 1875 — expect roof / HVAC / electrical / plumbing capex.
Questions for the listing agent
- It's been on market 40 days. Have you received any prior offers? Is the seller open to a 3% concession, seller financing, or rate buy-down credit?
- Can we see the unit-by-unit rent roll, current vacancy, and any below-market leases? What's the average tenancy length?
- What capital expenditures (roof, boiler, parking lot, exteriors) have been made in the last 5 years, and what's planned in the next 2?
- Built in 1875 — when were the roof, HVAC, electrical panel, plumbing, and water heater last replaced?
- Is there a deadline driving the sale (1031 exchange, divorce, estate, relocation)? That informs how much negotiation room exists.
- Schools are D-rated, which usually means shorter tenancies and higher turnover. Who's the typical renter profile here, and what's been the actual vacancy rate?
- Crime grade is F in this area — have there been break-ins, vandalism, or insurance claims at this property in the last 3 years? What carrier currently insures it and at what premium?
- What's the average days-on-market for RENTAL listings here right now (not sales)? A rising rental-DOM trend means longer vacancies and softer asking-rent achievability than the comps imply.
- What's the recent tenant-quality profile in this submarket — average credit score on applications, eviction rate, late-payment / NSF rate, and stable-employment percentage? A property-management company in the area should have these aggregated.
- How much new apartment / multifamily construction is in the pipeline within 1–3 miles? Heavy new supply (>2% of stock underway) typically softens rents 12–24 months out; light construction supports rent growth.
Investment metrics
- 1% rule
- 1.94% ✓
- Cap rate
- 17.29%
- Cash-on-cash
- 39.28%
- DSCR
- 2.75
- GRM
- 4.3
CMA / ARV
- ARV (median comp)
- $200,310
- List price
- $185,000
- Delta
- -7.64%
- Verdict
- FAIR
- Comps
- 20 within 1.0 mi
Show comp detail 10 sales within ~0.75 mi
| Address | Dist | Beds/Ba | Sqft | Sold | Price | $/sf | Match |
|---|---|---|---|---|---|---|---|
| 317 Marguerite Ave #19 | 0.03mi | 6/2.0 | 2,406 (-14%) | 4mo | $179,000 | $74 | 73 |
| 710 W Colvin St | 0.41mi | 6/2.0 | 2,752 (-1%) | 14mo | $117,000 | $43 | 68 |
| 101 Columbia Ave | 0.44mi | 6/2.0 | 2,652 (-5%) | 21mo | $235,000 | $89 | 54 |
| 152 Fage Ave #54 | 0.60mi | 6/2.0 | 2,506 (-10%) | 8mo | $110,000 | $44 | 49 |
| 119 Parkview Ave | 0.48mi | 6/2.0 | 2,982 (+7%) | 21mo | $195,000 | $65 | 48 |
| 359 Valley Dr #61 | 0.37mi | 6/2.0 | 2,370 (-15%) | 18mo | $189,900 | $80 | 43 |
| 357 Valley Dr | 0.37mi | 6/2.0 | 2,400 (-14%) | 21mo | $167,500 | $70 | 42 |
| 112-114 Mark Ave | 0.62mi | 6/2.0 | 2,582 (-7%) | 21mo | $60,000 | $23 | 42 |
| 345-347 W Kennedy St #347 | 0.64mi | 6/2.0 | 3,024 (+9%) | 19mo | $130,000 | $43 | 40 |
| 2718 Midland Ave | 0.75mi | 7/4.0 (+1) | 2,491 (-10%) | 10mo | $133,000 | $53 | 26 |
Match score weights: distance 35% · size 25% · config 20% · recency 20%. Top-matched comps best support the ARV.
Projected returns pro-forma
-3.0% appreciation · 3.0% rent growth · sell at horizon
- IRR
- 35.5%
- Equity multiple
- 2.51×
- Total profit
- $77,971
- Equity at exit
- $27,584
- IRR
- 42.3%
- Equity multiple
- 4.99×
- Total profit
- $206,811
- Equity at exit
- $15,995
Cash invested: $51,800 (down + closing). Projections, not guarantees.
Landlord ↔ Tenant lean methodology
- Overall (STATE)
- 15 Strongly Tenant-Friendly
- State New York
- 15 Strongly Tenant-Friendly · D+10
- County
- — inherits STATE
- City
- — inherits STATE
ZIP-level market 13207
- Home prices YoY
- -23.0%
- Active inventory
- 63
- Price-to-rent
- 8.6×
Monthly cashflow live
- Estimated rent
- $3,589 high interval (Pro) →
- Mortgage (P&I)
- −$970
- Tax from tax record
- −$93 /mo · $1,112/yr
- Insurance
- −$77
- HOA
- −$0
- Vacancy / Maint / Mgmt
- −$754
- Net cashflow
- $1,695
Break-even live
2-unit breakdown (identical units grouped — click to expand)
| Units | Beds | Baths | Est. rent |
|---|---|---|---|
| 2× units | 3 | 1 | $3,590 |
| #1 | 3 | 1 | $1,795 |
| #2 | 3 | 1 | $1,795 |
| Total (2 units) | $3,589 | ||
UW: 25.0% down · 7.5% · 30yr · 1.5% tax · 5.0% vac · 8.0% maint · 8.0% mgmt
Financing live
Cash to close
- Down payment
- $46,250
- Closing costs
- $5,550
- Reserves months
- —
- Total cash needed
- —
Loan-product check · same deal, 3 products live
Conventional
25% down · 7.5% · 30yr
- Down + closing
- —
- Monthly P&I
- —
- Monthly cashflow
- —
- DSCR
- —
- Eligible?
- —
Personal DTI + credit; lowest rate.
DSCR
20% down · 8.5% · 30yr
- Down + closing
- —
- Monthly P&I
- —
- Monthly cashflow
- —
- DSCR
- —
- Eligible?
- —
No personal income docs; deal must DSCR.
Hard money
10% down · 12.0% · 12mo
- Down + closing
- —
- Monthly P&I
- —
- Monthly cashflow
- —
- DSCR
- —
- Eligible?
- —
Short-term bridge; refi at stabilization.
Rent comps 1 comps
| Address | Beds | Baths | Sqft | Rent | $/sqft | DOM | Units | Dist |
|---|---|---|---|---|---|---|---|---|
| 367 Furman St Unit 1 Syracuse, NY | 5.0 | 1.0 | 3138 | $1,800 | $0.57 | 21d | 1 | 0.70mi |
Listing history 17 events
-
2026-06-18days on market $185,000 Active 40 DOM
-
2026-06-17days on market $185,000 Active 39 DOM
-
2026-06-16days on market $185,000 Active 38 DOM
-
2026-06-15days on market $185,000 Active 37 DOM
-
2026-06-14days on market $185,000 Active 35 DOM
-
2026-06-13days on market $185,000 Active 34 DOM
-
2026-06-10days on market $185,000 Active 32 DOM
-
2026-06-09days on market $185,000 Active 31 DOM
-
2026-06-08days on market $185,000 Active 30 DOM
-
2026-06-07days on market $185,000 Active 29 DOM
-
2026-06-05days on market $185,000 Active 26 DOM
-
2026-06-02days on market $185,000 Active 24 DOM
-
2026-06-01days on market $185,000 Active 23 DOM
-
2026-05-31days on market $185,000 Active 22 DOM
-
2026-05-30days on market $185,000 Active 21 DOM
-
2026-05-04status Pending 426-char remark
Show marketing remark (426 chars)
Solid 2-unit investment property!!! This building features two 3-bedroom units . Separate utilities with individual meters allow tenants to pay their own gas and electric, reducing owner expenses. Upstairs apartment has new flooring. This property offers great potential with some updates and personal touches needed. This property has great potential for owner occupied or ideal for investors looking to grow their portfolio.
-
2026-04-22$185,000 Active 426-char remark
Show marketing remark (426 chars)
Solid 2-unit investment property!!! This building features two 3-bedroom units . Separate utilities with individual meters allow tenants to pay their own gas and electric, reducing owner expenses. Upstairs apartment has new flooring. This property offers great potential with some updates and personal touches needed. This property has great potential for owner occupied or ideal for investors looking to grow their portfolio.
ⓘ Source: listings_history table (triggers on properties + properties_extension) + one-shot
backfill from property_details.listing_events for pre-trigger history.
Tax reassessment forecast NY · Partial reset (capped growth)
- Current annual tax
- $1,112 · $93/mo
- Projected year-2 tax
- $2,119 · $177/mo
- Expected delta
- +$1,007/yr (+$84/mo · 90.6%)
ⓘ Screening estimate from a state-policy table — verify with the county assessor before closing.
Climate risk First Street
- Flood 1/10 Low FEMA zone X (unshaded) · 0% chance over 30 yrs
- Wildfire 1/10 Low
- Heat 3/10 Moderate 7 d/yr ≥95°F today · 16 d/yr by 30 yrs out
- Wind 1/10 Low 0% chance of damaging wind over 30 yrs
- Air quality 2/10 Low 0 unhealthy d/yr today · 1 by 30 yrs out
Nearby sold comps map
Loading sold comps map…
Walkable amenities ~0.75 mi
Loading nearby amenities…
Taxation est. · year 1
- Rental income
- $43,068
- − Mortgage interest
- −$10,363
- − Property taxes
- −$1,112
- − Insurance
- −$925
- − Repairs & maintenance
- −$3,445
- − Management
- −$3,445
- − Depreciation
- −$5,382
- Taxable income
- $18,395
- Est. tax owed @ 24.0%
- −$4,415
- After-tax cash flow
- $15,930/yr
For passive investors: Depreciation is non-cash, so a rental often shows a tax loss while cash-flowing — sheltering income. Rental losses are passive: they offset passive income freely, and up to $25,000/yr can offset ordinary (W-2) income if you actively participate and your MAGI is under $100k (phasing out to $0 by $150k); unused losses carry forward. On sale, claimed depreciation is recaptured at up to 25%, and gains may owe capital-gains tax (a 1031 exchange can defer both). Figures are a year-1 estimate at your 24.0% rate — not tax advice; consult a CPA.
Schools (NCES district)
- District
- Syracuse City School District
- NCES district ID
- 3628590
- Math proficiency
- 18% ▼ -5.00%
- Reading proficiency
- 26% ▬ 0.00%
- Median HH income
- $32,097
- Composite
- 17.83/100
- National rank
- #9007
- State rank
- #590 of 590 in NY
Livability — Syracuse
- Score
- 77/100
- State rank
- #187
- US rank
- #2869
Category grades
Schools grade is shown separately in the Schools card above.
Census & demographics
- Census place
- Syracuse, NY
- City population
- 152,627
- Population (ZIP)
- 12,383
Population outlook (Onondaga County) Hauer SSP2
- Today (2025)
- 467,894 people
- By 2030
- 463,381 · -1.0%
- By 2040
- 447,697 · -4.3%
- By 2050
- 426,399 · -8.9%
- By 2075
- 373,661 · -20.1%
- By 2100
- 307,967 · -34.2%
Race, ethnicity, and origin ACS 2023
- Neighborhood character
- Diverse neighborhood (Simpson 0.68)
- Race & ethnicity
- White 43% Black 33% Hispanic / Latino 17% Two or more races 11% Native American 1% Asian 1%
- Hispanic origin (detail)
- Puerto Rican 13% Cuban 1%
- Common ancestry
- Romanian 3% Lithuanian 1% Slovak 1%
- Foreign-born
- 4% · Canada, South Korea
- Languages at home
- 89% English-only · Spanish 9% French/Haitian/Cajun 1%
Political lean MEDSL · Onondaga
- 2024 margin
- D (+17.3) · D 58.6% · R 41.4%
- 2008→2024 swing
- -3.0pp toward R · 2008: 20.3pp · 2024: 17.3pp
- All cycles
- 2024: D+17.3 2020: D+20.6 2016: D+12.8 2012: D+21.1 2008: D+20.3
Not yet ingested
- Civics
- —
Market trends
- HPI YoY
- ▼ -95.17%
- Current HPI
- 318.9257
- Rent YoY
- —
- Metro
- —
- State GDP YoY
- ▲ 2.60%
- F500 in state
- 92
Industry mix (Fortune 500 HQ in NY)
| Industry | F500 HQs | Revenue |
|---|---|---|
| Financial Services | 10 | $950B |
|
||
| Consumer Goods | 9 | $162B |
|
||
| Insurance | 4 | $225B |
|
||
| Telecommunications | 2 | $144B |
|
||
| Pharmaceuticals | 2 | $112B |
|
||
| Media / Entertainment | 2 | $69B |
|
||
Price history
2 events — show timeline
- 2026-05-04 Pending — CNYIS
- 2026-04-22 Listed $185,000 CNYIS
Property tax history
-0.0%/yrLatest (2025): $1,112 · +0.0% YoY. Source: county tax records.
Cash-flow waterfall
monthlySold comps — $/sqft
last 12 mo · ≤1 miLoading sold comps…