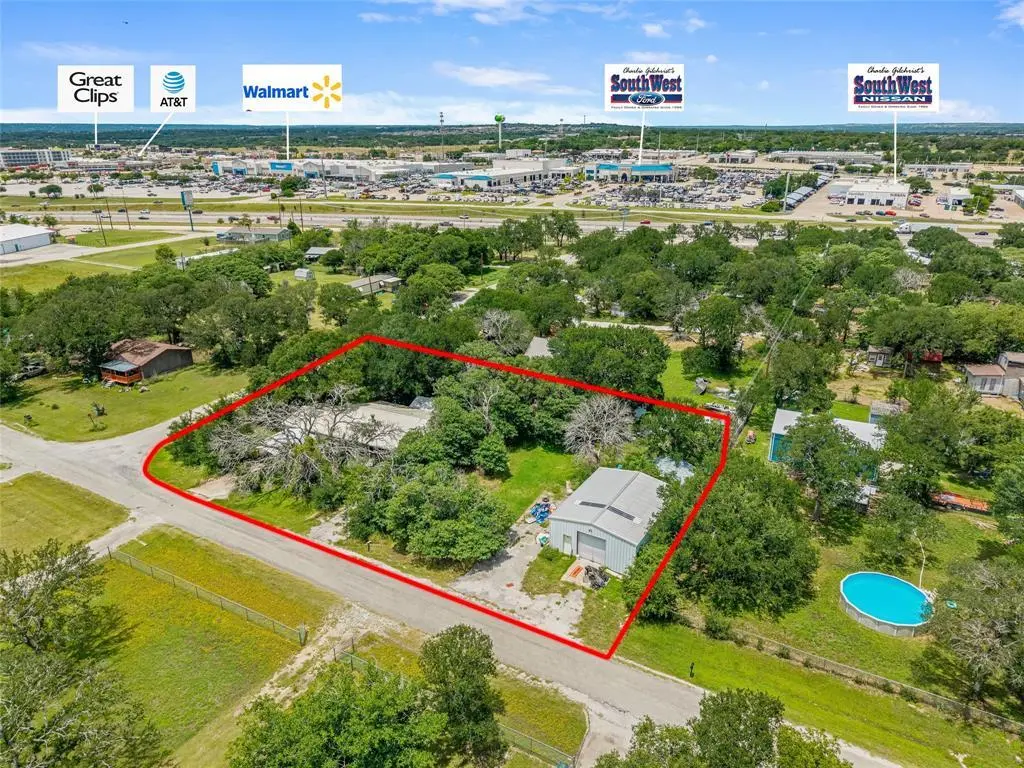
209 Renee Dr · Hudson Oaks, TX
Flood risk 1/10 · Minimal
- FEMA flood zone
- X (unshaded)
- Chance of flooding over 30 yrs
- 0.0%
- Est. flood insurance / yr
- $507 – $1,088
Fire risk 6/10 · Moderate
- Est. fire insurance / yr
- $1,222 – $2,270
Heat risk 7/10 · Major
- Hot days now (above 108°F)
- 7 days/yr
- Hot days in 30 yrs
- 20 days/yr
Wind risk 4/10 · Minor
- Chance of severe wind over 30 yrs
- 21.0%
Air-quality risk 3/10 · Minor
- Unhealthy air days now
- 2 days/yr
- Unhealthy air days in 30 yrs
- 3 days/yr
Risk factors via First Street. Map © Google.
Why this score? — see what drove the B+ grade
The composite is a weighted blend of 9 inputs, each scored 0–100. Each bar is that input's sub-score; the figure is the points it added to the 100-point composite (weight × sub-score).
- Cash flow +30.0/30.0
- ARV discount +14.1/15.0
- 1% rule +10.0/10.0
- DSCR +10.0/10.0
- Livability +3.7/5.0
- Schools +3.6/10.0
- Rent growth +2.7/5.0
- Condition / age +2.5/5.0
- Appreciation +0.0/10.0
$140,000
🖨 Deal sheet 📄 Offer letter ✓ Due diligence
Listing remarks
Welcome to 209 Renee Drive where comfort, convenience, and opportunity come together! Nestled in heart of Hudson Oaks, this property offers easy access to I-20, shopping, dining, entertainment and everything Weatherford and Hudson Oaks has to offer while maintaining the charm of a well-established neighborhood. Being sold AS-IS, this home is ideal for investors, DIY enthusiasts, or anyone seeking property with room to add their personal touch. A standout feature of the property is the impressive 30x40 metal shop, providing ample space for storage, projects, equipment, hobbies or a workshop. Situated in an established area with area with easy access to Weatherford and Fort Worth, the locatio
Key facts
- Easy access to i-20
- 0.41 acre lot
- 2 garage spots
Tags
Property features AI
Finance
- Financial info: Treat as clear loan type; No second mortgage
- HOA & community: No association
Exterior
- Parking: Detached carport (covered, gravel); 2 covered/carport spaces; 2-car attached garage
- Utilities: City water with individual water meter; Septic system; Electricity connected
- Home design: Manufactured home; Property attached; One story
- Construction: Metal roof; Built in 1983
- Exterior features: Storage; Lot less than 0.5 acre (approximately 0.41 acre)
Interior
- Kitchen: Eat-in kitchen; Water purifier
- Bedrooms: 3 bedrooms (all on the main level)
- Flooring: Carpet
- Bathrooms: 2 full bathrooms
- Heating & cooling: Central heating; Central electric air conditioning; Ceiling fans
- Interior features: Eat-in kitchen; Water purifier; One living area; One dining area; Living room with fireplace; Room count: 4; Single-level home
- Laundry & utility: Washer hookup; Electric dryer hookup; Utility room
Neighborhood map
What this means for you Summary
Snapshot
- This is a 3-bed/2.0-bath manufactured listed at $140k.
Deal economics
- At list price, monthly cash flow is $835 ($10k/yr) — positive.
- The deal already cash-flows at list — no discount required.
- Meets the 1% rule at list price ($2k rent vs $140k).
Location & tenants
- Location reads 73/100 on livability (#197 in TX, #4,998 nationally) — a middle-class / working-renter tenant base. Strengths: employment A+, housing A+, health & safety A+; Watch: amenities F, commute F.
- Weatherford ISD (town): math 39% / reading 44% proficiency, ranked #321 of 826 in TX (top 39%) — families likely to look elsewhere, expect single-tenant / working-renter base with shorter leases.
- Zoned schools: Ikard El (math 24% / reading 34%, grade F, #2,668 of 4,322 statewide, top 63%, 620 students, 73% FRL) — zoned schools average 73% FRL vs 42% district-wide (31 pts higher); higher-poverty schools than district average — tighter screening recommended.
- Zoned-school proficiency averages 29% at this address vs 42% district-wide (-12 pts) — the specific schools serving this property underperform the Weatherford ISD average; the district grade overstates school quality for this exact location.
- Market conditions: Rents flat; 649 active listings in the ZIP; 2 comparable units currently listed for rent nearby; high-income renter base; 437 units permitted in Parker County in 2024 (0 in 5+ unit buildings).
Forward outlook
- Local home prices are declining (-3.0%/yr); year-one equity from $968 of loan paydown is wiped out by about $4k of value loss. Plan a longer hold.
- Parker County population projected at +32% by 2050 — long-run rental-demand tailwind backs the buy-and-hold thesis.
- At projected returns (-3.0% appreciation + 0.7% rent growth), your $39k cash investment doubles in ~6 years — after that, you're playing with house money.
Negotiation context
- Only 14 days on market — expect competitive offers; lowballing is unlikely to land.
Risks & watch-outs
- Climate carrying-cost: major wildfire risk; extreme-heat days projected 7→20/yr by 2055 (HVAC capex compounding) — expect insurance premiums to compound above CPI over the hold.
Questions for the listing agent
- Is there a deadline driving the sale (1031 exchange, divorce, estate, relocation)? That informs how much negotiation room exists.
- Schools are F-rated, which usually means shorter tenancies and higher turnover. Who's the typical renter profile here, and what's been the actual vacancy rate?
- What's the average days-on-market for RENTAL listings here right now (not sales)? A rising rental-DOM trend means longer vacancies and softer asking-rent achievability than the comps imply.
- What's the recent tenant-quality profile in this submarket — average credit score on applications, eviction rate, late-payment / NSF rate, and stable-employment percentage? A property-management company in the area should have these aggregated.
- How much new for-sale + rental construction is in the pipeline within 1–3 miles? Heavy new supply typically softens prices + rents 12–24 months out; constrained supply supports both.
Investment metrics
- 1% rule
- 1.56% ✓
- Cap rate
- 13.45%
- Cash-on-cash
- 25.57%
- DSCR
- 2.14
- GRM
- 5.3
CMA / ARV
- ARV (on-the-fly)
- $163,968
- Comps found
- 1
Show comp detail 1 sale within ~0.75 mi
| Address | Dist | Beds/Ba | Sqft | Sold | Price | $/sf | Match |
|---|---|---|---|---|---|---|---|
| 128 Donna Ct | 0.36mi | 3/2.0 | 1,216 (-10%) | 10mo | $147,900 | $122 | 60 |
Match score weights: distance 35% · size 25% · config 20% · recency 20%. Top-matched comps best support the ARV.
Projected returns pro-forma
-3.0% appreciation · 0.73% rent growth · sell at horizon
- IRR
- 16.7%
- Equity multiple
- 1.65×
- Total profit
- $25,601
- Equity at exit
- $20,874
- IRR
- 23.6%
- Equity multiple
- 2.83×
- Total profit
- $71,555
- Equity at exit
- $12,105
Cash invested: $39,200 (down + closing). Projections, not guarantees.
Landlord ↔ Tenant lean methodology
- Overall (STATE)
- 87 Strongly Landlord-Friendly
- State Texas
- 87 Strongly Landlord-Friendly · R+5
- County
- — inherits STATE
- City
- — inherits STATE
ZIP-level market 76087
- Rents YoY
- 0.7%
- Active inventory
- 649
- Price-to-rent
- 5.3×
Monthly cashflow live
- Estimated rent
- $2,191 medium interval (Pro) →
- Mortgage (P&I)
- −$734
- Tax from tax record
- −$103 /mo · $1,238/yr
- Insurance
- −$58
- HOA
- −$0
- Vacancy / Maint / Mgmt
- −$460
- Net cashflow
- $835
Break-even live
UW: 25.0% down · 7.5% · 30yr · 1.5% tax · 5.0% vac · 8.0% maint · 8.0% mgmt
Financing live
Cash to close
- Down payment
- $35,000
- Closing costs
- $4,200
- Reserves months
- —
- Total cash needed
- —
Loan-product check · same deal, 3 products live
Conventional
25% down · 7.5% · 30yr
- Down + closing
- —
- Monthly P&I
- —
- Monthly cashflow
- —
- DSCR
- —
- Eligible?
- —
Personal DTI + credit; lowest rate.
DSCR
20% down · 8.5% · 30yr
- Down + closing
- —
- Monthly P&I
- —
- Monthly cashflow
- —
- DSCR
- —
- Eligible?
- —
No personal income docs; deal must DSCR.
Hard money
10% down · 12.0% · 12mo
- Down + closing
- —
- Monthly P&I
- —
- Monthly cashflow
- —
- DSCR
- —
- Eligible?
- —
Short-term bridge; refi at stabilization.
Rent comps 2 comps
| Address | Beds | Baths | Sqft | Rent | $/sqft | DOM | Units | Dist |
|---|---|---|---|---|---|---|---|---|
| 900 Cinema Dr Hudson Oaks, TX | 1.0–3.0 | 1.0–2.0 | 1064 | $2,187 | $2.05 | 1d | 31 | 0.76mi |
| 150 Inspiration Dr Hudson Oaks, TX | 1.0–2.0 | 1.0–2.0 | 921 | $2,099 | $2.28 | 1d | 36 | 0.77mi |
Listing history 11 events
-
2026-06-15status $140,000 Pending 14 DOM
-
2026-06-13days on market $140,000 Active Option Contract 14 DOM
-
2026-06-09days on market $140,000 Active Option Contract 10 DOM
-
2026-06-08statusdays on market $140,000 Active Option Contract 9 DOM
-
2026-06-07days on market $140,000 Active 8 DOM
-
2026-06-04days on market $140,000 Active 5 DOM
-
2026-06-03days on market $140,000 Active 4 DOM
-
2026-06-02days on market $140,000 Active 3 DOM
-
2026-06-01days on market $140,000 Active 2 DOM
-
2026-05-31remarks 699-char remark
-
2026-05-31$140,000 Active 1 DOM
ⓘ Source: listings_history table (triggers on properties + properties_extension) + one-shot
backfill from property_details.listing_events for pre-trigger history.
Tax reassessment forecast TX · Resets to sale price
- Current annual tax
- $1,238 · $103/mo
- Projected year-2 tax
- $2,562 · $214/mo
- Expected delta
- +$1,324/yr (+$110/mo · 107.0%)
ⓘ Screening estimate from a state-policy table — verify with the county assessor before closing.
Climate risk First Street
- Flood 1/10 Low FEMA zone X (unshaded) · 0% chance over 30 yrs
- Wildfire 6/10 Major
- Heat 7/10 Severe 7 d/yr ≥108°F today · 20 d/yr by 30 yrs out
- Wind 4/10 Moderate 21% chance of damaging wind over 30 yrs
- Air quality 3/10 Moderate 2 unhealthy d/yr today · 3 by 30 yrs out
Nearby sold comps map
Loading sold comps map…
Walkable amenities ~0.75 mi
Loading nearby amenities…
Taxation est. · year 1
- Rental income
- $26,291
- − Mortgage interest
- −$7,842
- − Property taxes
- −$1,238
- − Insurance
- −$700
- − Repairs & maintenance
- −$2,103
- − Management
- −$2,103
- − Depreciation
- −$4,073
- Taxable income
- $8,232
- Est. tax owed @ 24.0%
- −$1,976
- After-tax cash flow
- $8,046/yr
For passive investors: Depreciation is non-cash, so a rental often shows a tax loss while cash-flowing — sheltering income. Rental losses are passive: they offset passive income freely, and up to $25,000/yr can offset ordinary (W-2) income if you actively participate and your MAGI is under $100k (phasing out to $0 by $150k); unused losses carry forward. On sale, claimed depreciation is recaptured at up to 25%, and gains may owe capital-gains tax (a 1031 exchange can defer both). Figures are a year-1 estimate at your 24.0% rate — not tax advice; consult a CPA.
Schools (NCES district)
- District
- Weatherford ISD
- NCES district ID
- 4844800
- Math proficiency
- 39% ▼ -3.00%
- Reading proficiency
- 44% ▼ -2.00%
- Median HH income
- $57,087
- Composite
- 36.4/100
- National rank
- #4679
- State rank
- #321 of 826 in TX
Livability — Hudson Oaks
- Score
- 73/100
- State rank
- #197
- US rank
- #4998
Category grades
Schools grade is shown separately in the Schools card above.
Census & demographics
- Census place
- Hudson Oaks, TX
- County
- Parker County · 144,797 people
- Metro
- Dallas-Fort Worth-Arlington, TX
- Population (ZIP)
- 36,822
- Household income
- $114,306
- Rent vs Own
- Severe rent burden
- 497.0
Population outlook (Parker County) Hauer SSP2
- Today (2025)
- 147,426 people
- By 2030
- 157,863 · +7.1%
- By 2040
- 177,519 · +20.4%
- By 2050
- 194,786 · +32.1%
- By 2075
- 238,799 · +62.0%
- By 2100
- 264,126 · +79.2%
Race, ethnicity, and origin ACS 2023
- Neighborhood character
- Predominantly White (82%)
- Race & ethnicity
- White 82% Hispanic / Latino 13% Two or more races 11% Black 2%
- Hispanic origin (detail)
- Mexican 11%
- Common ancestry
- Slovak 2% Italian 2% Lithuanian 2%
- Foreign-born
- 7% · Canada, South Korea
- Languages at home
- 90% English-only · Spanish 9%
Political lean MEDSL · Parker
- 2024 margin
- Solid R (+66.4) · D 16.4% · R 82.8%
- 2008→2024 swing
- -11.2pp toward R · 2008: -55.2pp · 2024: -66.4pp
- All cycles
- 2024: R+66.4 2020: R+64.4 2016: R+67.5 2012: R+65.8 2008: R+55.2
Not yet ingested
- Civics
- —
Market trends
- HPI YoY
- ▼ -172.16%
- Current HPI
- 214.6694
- Rent YoY
- ▲ 0.73%
- Metro
- Dallas-Fort Worth-Arlington, TX
- State GDP YoY
- ▲ 3.95%
- F500 in state
- 110
Industry mix (Fortune 500 HQ in TX)
| Industry | F500 HQs | Revenue |
|---|---|---|
| Energy | 16 | $1,198B |
|
||
| Technology | 5 | $198B |
|
||
| Engineering / Construction | 4 | $72B |
|
||
| Energy Services | 3 | $60B |
|
||
| Utilities | 3 | $41B |
|
||
| Healthcare | 2 | $330B |
|
||
Price history
2 events — show timeline
- 2026-05-30 Listed $140,000 NTREIS
- 1995-09-07 Sold (Public Records) — Public Records
Property tax history
+3.0%/yrLatest (2025): $1,238 · +8.7% YoY. Source: county tax records.
Cash-flow waterfall
monthlySold comps — $/sqft
last 12 mo · ≤1 miLoading sold comps…