 5-Plex
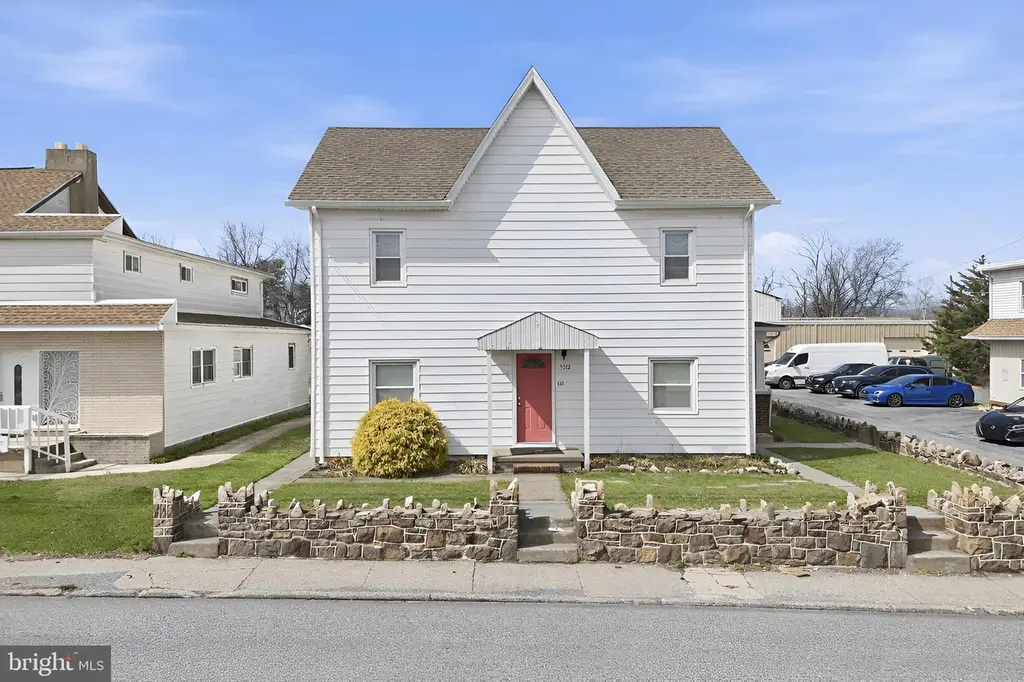
3512 Walnut St · Progress, PA
Flood risk 1/10 · Minimal
- FEMA flood zone
- X
- Chance of flooding over 30 yrs
- 0.0%
- Est. flood insurance / yr
- $508 – $851
Fire risk 1/10 · Minimal
- Est. fire insurance / yr
- $511 – $949
Heat risk 5/10 · Moderate
- Hot days now (above threshold)
- 7 days/yr
- Hot days in 30 yrs
- 15 days/yr
Wind risk No data
- Chance of severe wind over 30 yrs
- —
Air-quality risk 3/10 · Minor
- Unhealthy air days now
- 2 days/yr
- Unhealthy air days in 30 yrs
- 4 days/yr
Risk factors via First Street. Map © Google.
Why this score? — see what drove the B- grade
The composite is a weighted blend of 9 inputs, each scored 0–100. Each bar is that input's sub-score; the figure is the points it added to the 100-point composite (weight × sub-score).
- Cash flow +30.0/30.0
- DSCR +10.0/10.0
- 1% rule +9.4/10.0
- ARV discount +7.5/15.0
- Rent growth +3.8/5.0
- Livability +3.8/5.0
- Schools +2.6/10.0
- Condition / age +2.2/5.0
- Appreciation +0.0/10.0
$550,000
🖨 Deal sheet (PDF) 📄 Offer letter ✓ Due diligence
Multi-family units
County records classify this as Multi-Family (2-4 Unit). Listing-text estimate: 5 units. estimate disagrees with records
Listing remarks
This is a 5 Unit. Property under contract as part of a package deal.
Key facts
- 6,970 sq ft lot
- Built 1900
Neighborhood map
What this means for you Summary
Snapshot
- This is a 5 × 3-bed/1-bath units multifamily listed at $550k. Condition is rated fair.
Deal economics
- At list price, monthly cash flow is $2k ($29k/yr) — positive. Per door: $491/mo.
- The deal already cash-flows at list — no discount required.
- Meets the 1% rule at list price ($8k rent vs $550k).
- Cap rate 11.7% vs local median 4.0% in Progress — top-decile yield for the area; either an underpriced asset or a hidden risk that comps aren't pricing in. Stress-test before assuming the spread holds.
Location & tenants
- Location reads 76/100 on livability (#385 in PA, #3,436 nationally) — a middle-class / working-renter tenant base. Strengths: cost of living A+, housing A+, health & safety A+; Watch: amenities F, commute F.
- Susquehanna Township SD (suburban): math 17% / reading 39% proficiency, ranked #444 of 539 in PA (top 82%) — low school quality limits family demand, transient renter base, plan for 1-2y turnover.
- Zoned schools: Thomas W Holtzman Jr El Sch (math 22% / reading 45%, grade F, #1,081 of 1,518 statewide, top 71%, 820 students, 67% FRL); Susquehanna Twp Ms (math 7% / reading 34%, grade F, #435 of 512 statewide, top 85%, 723 students, 63% FRL); Susquehanna Twp Hs (math 37% / reading 10%, grade F, #379 of 437 statewide, top 87%, 743 students, 55% FRL) — zoned schools average 62% FRL vs 35% district-wide (27 pts higher); higher-poverty schools than district average — tighter screening recommended.
- Market conditions: Rents rising fast (+5.4%/yr); 81 active listings in the ZIP; 540 units permitted in Dauphin County in 2024 (194 in 5+ unit buildings).
- At $7,921/mo this rent would consume 132% of the median local household income ($72k/yr) (locally 1266% of renters already pay >50% of income on rent) — very limited rent-growth headroom before tenants either downsize or default.
Forward outlook
- Local home prices are declining (-3.0%/yr); year-one equity from $4k of loan paydown is wiped out by about $16k of value loss. Plan a longer hold.
- At projected returns (-3.0% appreciation + 5.4% rent growth), your $154k cash investment doubles in ~6 years — after that, you're playing with house money.
Negotiation context
- Only 0 days on market — expect competitive offers; lowballing is unlikely to land.
Risks & watch-outs
- Watch-outs: built in 1900 — expect roof / HVAC / electrical / plumbing capex.
- Climate carrying-cost: extreme-heat days projected 7→15/yr by 2055 (HVAC capex compounding) — expect insurance premiums to compound above CPI over the hold.
Questions for the listing agent
- Can we see the unit-by-unit rent roll, current vacancy, and any below-market leases? What's the average tenancy length?
- What capital expenditures (roof, boiler, parking lot, exteriors) have been made in the last 5 years, and what's planned in the next 2?
- Have any recent inspections been done? Can we get a copy of the seller's disclosures and any deferred-maintenance estimates?
- Built in 1900 — when were the roof, HVAC, electrical panel, plumbing, and water heater last replaced?
- Is there a deadline driving the sale (1031 exchange, divorce, estate, relocation)? That informs how much negotiation room exists.
- What's the average days-on-market for RENTAL listings here right now (not sales)? A rising rental-DOM trend means longer vacancies and softer asking-rent achievability than the comps imply.
- What's the recent tenant-quality profile in this submarket — average credit score on applications, eviction rate, late-payment / NSF rate, and stable-employment percentage? A property-management company in the area should have these aggregated.
- How much new apartment / multifamily construction is in the pipeline within 1–3 miles? Heavy new supply (>2% of stock underway) typically softens rents 12–24 months out; light construction supports rent growth.
Investment metrics
- 1% rule
- 1.44% ✓
- Cap rate
- 11.65%
- Cash-on-cash
- 19.14%
- DSCR
- 1.85
- GRM
- 5.8
CMA / ARV
No comps found within radius.
Projected returns pro-forma
-3.0% appreciation · 5.37% rent growth · sell at horizon
- IRR
- 13.7%
- Equity multiple
- 1.56×
- Total profit
- $86,797
- Equity at exit
- $82,007
- IRR
- 24.3%
- Equity multiple
- 3.34×
- Total profit
- $360,830
- Equity at exit
- $47,554
Cash invested: $154,000 (down + closing). Projections, not guarantees.
Landlord ↔ Tenant lean methodology
- Overall (STATE)
- 62 Landlord-Friendly
- State Pennsylvania
- 62 Landlord-Friendly · EVEN
- County
- — inherits STATE
- City
- — inherits STATE
ZIP-level market 17109
- Rents YoY
- 5.4%
- Active inventory
- 81
- Price-to-rent
- 28.9×
Monthly cashflow live
- Estimated rent
- $7,921 high interval (Pro) →
- Mortgage (P&I)
- −$2,884
- Tax est. 1.5%
- −$688 /mo · $8,250/yr
- Insurance
- −$229
- HOA
- −$0
- Lot rent
- −$0
- Vacancy / Maint / Mgmt
- −$1,663
- Net cashflow
- $2,457
Break-even live
Sensitivity live
| Price | -10% $2,837 | -5% $2,647 | +0% $2,457 | +5% $2,267 | +10% $2,077 |
|---|---|---|---|---|---|
| Rent | -10% $1,831 | -5% $2,144 | +0% $2,457 | +5% $2,770 | +10% $3,082 |
| Rate | -1.0pp $2,734 | -0.5pp $2,597 | base $2,457 | +0.5pp $2,314 | +1.0pp $2,169 |
5-unit breakdown (identical units grouped — click to expand)
| Units | Beds | Baths | Est. rent |
|---|---|---|---|
| 5× units | 3 | 1 | $7,920 |
| #1 | 3 | 1 | $1,584 |
| #2 | 3 | 1 | $1,584 |
| #3 | 3 | 1 | $1,584 |
| #4 | 3 | 1 | $1,584 |
| #5 | 3 | 1 | $1,584 |
| Total (5 units) | $7,921 | ||
UW: 25.0% down · 7.5% · 30yr · 1.5% tax · 5.0% vac · 8.0% maint · 8.0% mgmt
Financing live
Cash to close
- Down payment
- $137,500
- Closing costs
- $16,500
- Reserves months
- —
- Total cash needed
- —
Loan-product check · same deal, 3 products live
Conventional
25% down · 7.5% · 30yr
- Down + closing
- —
- Monthly P&I
- —
- Monthly cashflow
- —
- DSCR
- —
- Eligible?
- —
Personal DTI + credit; lowest rate.
DSCR
20% down · 8.5% · 30yr
- Down + closing
- —
- Monthly P&I
- —
- Monthly cashflow
- —
- DSCR
- —
- Eligible?
- —
No personal income docs; deal must DSCR.
Hard money
10% down · 12.0% · 12mo
- Down + closing
- —
- Monthly P&I
- —
- Monthly cashflow
- —
- DSCR
- —
- Eligible?
- —
Short-term bridge; refi at stabilization.
Listing history 2 events
-
2026-04-07$550,000
-
2026-04-07historical
ⓘ Source: listings_history table (triggers on properties + properties_extension) + one-shot
backfill from property_details.listing_events for pre-trigger history.
Climate risk First Street
- Flood 1/10 Low FEMA zone X · 0% chance over 30 yrs
- Wildfire 1/10 Low
- Heat 5/10 Major
- Air quality 3/10 Moderate 2 unhealthy d/yr today · 4 by 30 yrs out
Nearby sold comps map
Loading sold comps map…
Walkable amenities ~0.75 mi
Loading nearby amenities…
Taxation est. · year 1
- Rental income
- $95,052
- − Mortgage interest
- −$30,809
- − Property taxes
- −$8,250
- − Insurance
- −$2,750
- − Repairs & maintenance
- −$7,604
- − Management
- −$7,604
- − Depreciation
- −$16,000
- Taxable income
- $22,035
- Est. tax owed @ 24.0%
- −$5,288
- After-tax cash flow
- $24,192/yr
For passive investors: Depreciation is non-cash, so a rental often shows a tax loss while cash-flowing — sheltering income. Rental losses are passive: they offset passive income freely, and up to $25,000/yr can offset ordinary (W-2) income if you actively participate and your MAGI is under $100k (phasing out to $0 by $150k); unused losses carry forward. On sale, claimed depreciation is recaptured at up to 25%, and gains may owe capital-gains tax (a 1031 exchange can defer both). Figures are a year-1 estimate at your 24.0% rate — not tax advice; consult a CPA.
Condition & rehab AI · 3 photos
This multi-family property requires moderate repairs and maintenance, including painting and landscaping, to improve its condition and value.
Repairs flagged
- Minor Paint — White siding has some discoloration
- Minor Landscaping — Some bushes appear dry
Value-add opportunities
- Both Paint the exterior — Fresh paint can improve curb appeal and property value
- Both Landscaping — Healthy landscaping can enhance curb appeal and attract potential buyers
Renovation cost estimate screening
| Repair item | Severity | Est. cost |
|---|---|---|
| Paint · White siding has some discoloration | Minor | $500–3,000 |
| Landscaping · Some bushes appear dry | Minor | $500–3,000 |
| Total estimated repair cost · 2 items | $1,000–6,000 |
Value-add ROI direction
- Both Paint the exterior — Fresh paint can improve curb appeal and property value ↑
- Both Landscaping — Healthy landscaping can enhance curb appeal and attract potential buyers ↑
ⓘ Cost ranges are severity-bucket heuristics (US national rule-of-thumb). Get contractor quotes + a written scope before underwriting a rehab budget.
Schools (NCES district)
- District
- Susquehanna Township SD
- NCES district ID
- 4223010
- Math proficiency
- 17% ▼ -15.00%
- Reading proficiency
- 39% ▼ -10.00%
- Median HH income
- $61,794
- Composite
- 25.59/100
- National rank
- #7424
- State rank
- #444 of 539 in PA
Livability — Progress
- Score
- 76/100
- State rank
- #385
- US rank
- #3436
Category grades
Schools grade is shown separately in the Schools card above.
Census & demographics
- Census place
- Progress, PA
- County
- Dauphin County · 247,857 people
- City population
- 27,422
- Metro
- Harrisburg-Carlisle, PA
- Population (ZIP)
- 27,466
- Household income
- $71,833
- Rent vs Own
- Severe rent burden
- 1266.0
Population outlook (Dauphin County) Hauer SSP2
- Today (2025)
- 281,628 people
- By 2030
- 283,549 · +0.7%
- By 2040
- 285,385 · +1.3%
- By 2050
- 286,188 · +1.6%
- By 2075
- 291,053 · +3.3%
- By 2100
- 282,374 · +0.3%
Race, ethnicity, and origin ACS 2023
- Neighborhood character
- Diverse neighborhood (Simpson 0.70)
- Race & ethnicity
- White 47% Black 23% Hispanic / Latino 13% Asian 11% Two or more races 11%
- Hispanic origin (detail)
- Mexican 2% Puerto Rican 5% Dominican 2%
- Common ancestry
- Romanian 2% Lithuanian 1% Polish 1%
- Foreign-born
- 17% · India, Vietnam, Canada
- Languages at home
- 81% English-only · Other Indo-European 5% Spanish 5% Vietnamese 2%
Political lean MEDSL · Dauphin
- 2024 margin
- Lean D (+5.9) · D 52.4% · R 46.5% · Other 1.1%
- 2008→2024 swing
- -3.1pp toward R · 2008: 9.1pp · 2024: 5.9pp
- All cycles
- 2024: D+5.9 2020: D+8.5 2016: D+2.8 2012: D+6.0 2008: D+9.1
Not yet ingested
- Civics
- —
Market trends
- HPI YoY
- ▼ -144.02%
- Current HPI
- 253.77
- Rent YoY
- ▲ 5.37%
- Metro
- Harrisburg-Carlisle, PA
- State GDP YoY
- ▲ 1.68%
- F500 in state
- 34
Industry mix (Fortune 500 HQ in PA)
| Industry | F500 HQs | Revenue |
|---|---|---|
| Healthcare | 2 | $309B |
|
||
| Insurance | 2 | $27B |
|
||
| Telecommunications / Media | 1 | $124B |
|
||
| Industrial Distribution | 1 | $22B |
|
||
| Financial Services | 1 | $20B |
|
||
| Chemicals / Materials | 1 | $18B |
|
||
Price history
2 events — show timeline
- 2026-04-07 Listing Removed — BRIGHT MLS
- 2026-04-07 Listed $550,000 BRIGHT MLS
Cash-flow waterfall
monthlySold comps — $/sqft
last 12 mo · ≤1 miLoading sold comps…