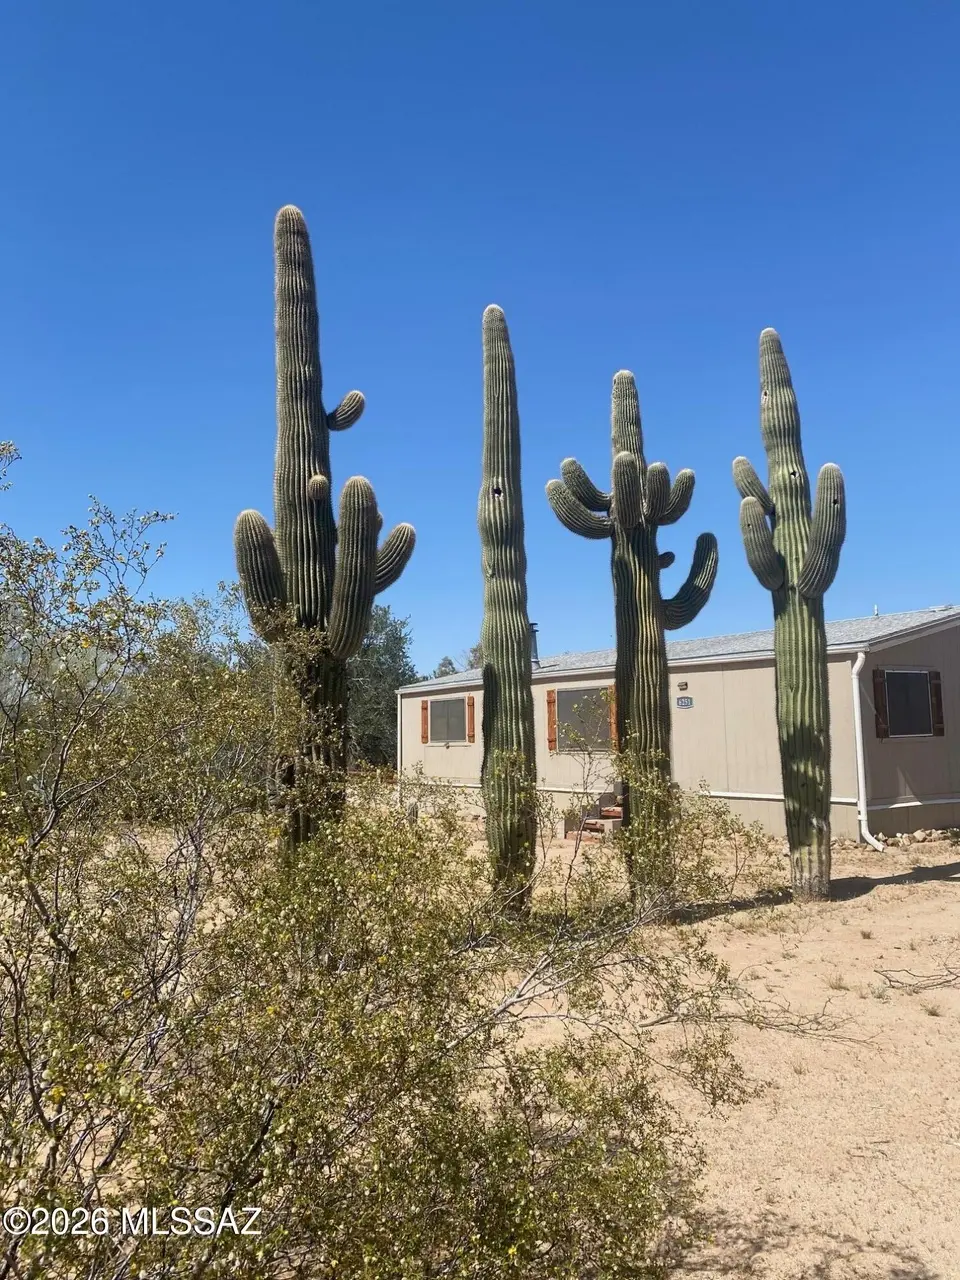
6251 N Blue Blvd · Picture Rocks, AZ
Flood risk 1/10 · Minimal
- FEMA flood zone
- X (unshaded)
- Chance of flooding over 30 yrs
- 0.0%
- Est. flood insurance / yr
- $507 – $1,088
Fire risk 5/10 · Moderate
- Est. fire insurance / yr
- $610 – $1,132
Heat risk 8/10 · Major
- Hot days now (above 108°F)
- 7 days/yr
- Hot days in 30 yrs
- 19 days/yr
Wind risk 1/10 · Minimal
- Chance of severe wind over 30 yrs
- —
Air-quality risk 1/10 · Minimal
- Unhealthy air days now
- 0 days/yr
- Unhealthy air days in 30 yrs
- 0 days/yr
Risk factors via First Street. Map © Google.
Why this score? — see what drove the C grade
The composite is a weighted blend of 9 inputs, each scored 0–100. Each bar is that input's sub-score; the figure is the points it added to the 100-point composite (weight × sub-score).
- Cash flow +24.8/30.0
- DSCR +8.0/10.0
- ARV discount +7.5/15.0
- 1% rule +5.2/10.0
- Schools +3.1/10.0
- Livability +2.8/5.0
- Rent growth +2.6/5.0
- Condition / age +2.5/5.0
- Appreciation +0.0/10.0
$180,000
🖨 Deal sheet 📄 Offer letter ✓ Due diligence
Listing remarks MLS
Private setting at the end of Blue Blvd. Needs a little TLC. Nice fireplace in living room. Eating area and breakfast bar off the kitchen. Easy Country Living! Seller will not turn utilities on for inspections. Home sold as-is.
Key facts
- Fenced area
- Private setting
- 1.11 acre lot
Tags
Property features AI
Finance
- Other: Zoned Pima County - GR1
- HOA & community: No association amenities
Exterior
- Security: Wrought iron security door
- Utilities: Water provided by a water company; Septic tank
- Home design: Manufactured home; Single-story; Faces south
- Construction: Wood frame construction; Shingle roof
- Exterior features: Covered slab patio/porch; Chain link, barbed wire and wood fencing; North/South exposure; Dirt road access (county maintained)
Interior
- Kitchen: Dishwasher; Refrigerator; Gas range
- Flooring: Vinyl flooring
- Bathrooms: 2 full bathrooms
- Heating & cooling: Forced air heating (natural gas); Central air conditioning (gas)
- Interior features: Wood-burning fireplace in the living room; Has heating and cooling
- Laundry & utility: Laundry room with washer and dryer
Neighborhood map
What this means for you Summary
Snapshot
- This is a 3-bed/2.0-bath manufactured listed at $180k.
Deal economics
- At list price, monthly cash flow is $381 ($5k/yr) — positive.
- The deal already cash-flows at list — no discount required.
- Meets the 1% rule at list price ($2k rent vs $180k).
- Recommended offer: $175k (3.0% below list) — sets the bar for market timing.
- Cap rate 8.8% vs local median 5.7% in Picture Rocks — top-decile yield for the area; either an underpriced asset or a hidden risk that comps aren't pricing in. Stress-test before assuming the spread holds.
Location & tenants
- Location reads 55/100 on livability (#261 in AZ) — a working-class tenant base; expect higher turnover. Strengths: cost of living A+, housing A+; Watch: employment C-, crime D, amenities F.
- Marana Unified District (4404) (suburban): math 31% / reading 37% proficiency, ranked #83 of 249 in AZ (top 33%) — families likely to look elsewhere, expect single-tenant / working-renter base with shorter leases.
- Zoned schools: Marana Middle School (math 24% / reading 30%, grade F, #97 of 218 statewide, top 45%, 907 students, 44% FRL); Marana High School (math 21% / reading 24%, grade F, #210 of 381 statewide, top 55%, 2,379 students, 36% FRL).
- Market conditions: Rents flat; 236 active listings in the ZIP; 1 comparable units currently listed for rent nearby; solid renter incomes; 5,268 units permitted in Pima County in 2024 (996 in 5+ unit buildings).
Forward outlook
- Local home prices are declining (-3.0%/yr); year-one equity from $1k of loan paydown is wiped out by about $5k of value loss. Plan a longer hold.
- Pima County population projected at +8% by 2050 — modest demand growth; plan on rents tracking national, not racing it.
Negotiation context
- It's been on market 56 days — a 3% lower offer ($175k) is reasonable based on typical stale-listing flexibility.
- 3 sale attempts since 25y ago; this cycle's ask has dropped $20k (10%) from the opening price — seller is motivated, your offer sets the floor, not the list.
- Current owner paid $25k; list at $180k implies a 620% gain — meaningful room to come down on a strong offer.
Risks & watch-outs
- Climate carrying-cost: moderate wildfire risk; extreme-heat days projected 7→19/yr by 2055 (HVAC capex compounding) — expect insurance premiums to compound above CPI over the hold.
Questions for the listing agent
- It's been on market 56 days. Have you received any prior offers? Is the seller open to a 3% concession, seller financing, or rate buy-down credit?
- Is there a deadline driving the sale (1031 exchange, divorce, estate, relocation)? That informs how much negotiation room exists.
- Schools are F-rated, which usually means shorter tenancies and higher turnover. Who's the typical renter profile here, and what's been the actual vacancy rate?
- Crime grade is D in this area — have there been break-ins, vandalism, or insurance claims at this property in the last 3 years? What carrier currently insures it and at what premium?
- What's the average days-on-market for RENTAL listings here right now (not sales)? A rising rental-DOM trend means longer vacancies and softer asking-rent achievability than the comps imply.
- What's the recent tenant-quality profile in this submarket — average credit score on applications, eviction rate, late-payment / NSF rate, and stable-employment percentage? A property-management company in the area should have these aggregated.
- How much new for-sale + rental construction is in the pipeline within 1–3 miles? Heavy new supply typically softens prices + rents 12–24 months out; constrained supply supports both.
Investment metrics
- 1% rule
- 1.02% ✓
- Cap rate
- 8.83%
- Cash-on-cash
- 9.07%
- DSCR
- 1.40
- GRM
- 8.1
CMA / ARV
- ARV (median comp)
- $117,487
- List price
- $180,000
- Delta
- 53.21%
- Verdict
- OVERPRICED
- Comps
- 5 within 1.0 mi
Show comp detail 4 sales within ~0.75 mi
| Address | Dist | Beds/Ba | Sqft | Sold | Price | $/sf | Match |
|---|---|---|---|---|---|---|---|
| 6319 N Taylor Ln | 0.21mi | 3/2.0 | 1,280 (+11%) | 8mo | $101,500 | $79 | 65 |
| 12437 W Nolen Rd | 0.43mi | 2/1.5 (-1) | 1,056 (-8%) | 18mo | $120,000 | $114 | 44 |
| 11560 W Orange Grove Rd | 0.75mi | 3/2.0 | 1,232 (+7%) | 19mo | $235,000 | $191 | 38 |
| 11930 W Lord Ln | 0.54mi | 2/2.0 (-1) | 1,010 (-12%) | 23mo | $204,000 | $202 | 30 |
Match score weights: distance 35% · size 25% · config 20% · recency 20%. Top-matched comps best support the ARV.
Projected returns pro-forma
-3.0% appreciation · 0.47% rent growth · sell at horizon
- IRR
- -5.2%
- Equity multiple
- 0.81×
- Total profit
- $-9,561
- Equity at exit
- $26,839
- IRR
- 1.5%
- Equity multiple
- 1.09×
- Total profit
- $4,754
- Equity at exit
- $15,563
Cash invested: $50,400 (down + closing). Projections, not guarantees.
Landlord ↔ Tenant lean methodology
- Overall (STATE)
- 87 Strongly Landlord-Friendly
- State Arizona
- 87 Strongly Landlord-Friendly · R+3
- County
- — inherits STATE
- City
- — inherits STATE
ZIP-level market 85743
- Home prices YoY
- -26.1%
- Rents YoY
- 0.5%
- Active inventory
- 236
- Price-to-rent
- 8.1×
Monthly cashflow live
- Estimated rent
- $1,843 medium interval (Pro) →
- Mortgage (P&I)
- −$944
- Tax from tax record
- −$56 /mo · $672/yr
- Insurance
- −$75
- HOA
- −$0
- Vacancy / Maint / Mgmt
- −$387
- Net cashflow
- $381
Break-even live
UW: 25.0% down · 7.5% · 30yr · 1.5% tax · 5.0% vac · 8.0% maint · 8.0% mgmt
Financing live
Cash to close
- Down payment
- $45,000
- Closing costs
- $5,400
- Reserves months
- —
- Total cash needed
- —
Loan-product check · same deal, 3 products live
Conventional
25% down · 7.5% · 30yr
- Down + closing
- —
- Monthly P&I
- —
- Monthly cashflow
- —
- DSCR
- —
- Eligible?
- —
Personal DTI + credit; lowest rate.
DSCR
20% down · 8.5% · 30yr
- Down + closing
- —
- Monthly P&I
- —
- Monthly cashflow
- —
- DSCR
- —
- Eligible?
- —
No personal income docs; deal must DSCR.
Hard money
10% down · 12.0% · 12mo
- Down + closing
- —
- Monthly P&I
- —
- Monthly cashflow
- —
- DSCR
- —
- Eligible?
- —
Short-term bridge; refi at stabilization.
Rent comps 1 comps
| Address | Beds | Baths | Sqft | Rent | $/sqft | DOM | Units | Dist |
|---|---|---|---|---|---|---|---|---|
| 6820 N Blue Blvd Unit 1 Tucson, AZ | 2.0 | 2.0 | 1056 | $1,500 | $1.42 | 10d | 1 | 0.80mi |
Listing history 26 events
-
2026-06-18days on market $180,000 Active 56 DOM
-
2026-06-17days on market $180,000 Active 55 DOM
-
2026-06-16days on market $180,000 Active 54 DOM
-
2026-06-15days on market $180,000 Active 53 DOM
-
2026-06-13days on market $180,000 Active 51 DOM
-
2026-06-13pricedays on market $180,000 Active 50 DOM
-
2026-06-10days on market $199,999 Active 48 DOM
-
2026-06-09days on market $199,999 Active 47 DOM
-
2026-06-08days on market $199,999 Active 46 DOM
-
2026-06-07days on market $199,999 Active 45 DOM
-
2026-06-05days on market $199,999 Active 42 DOM
-
2026-06-03days on market $199,999 Active 41 DOM
-
2026-06-02days on market $199,999 Active 40 DOM
-
2026-06-01days on market $199,999 Active 39 DOM
-
2026-05-31days on market $199,999 Active 38 DOM
-
2026-04-23$199,999 Active 276-char remark
-
2014-04-14soldstatus $25,000 Closed 229-char remark
Show marketing remark (229 chars)
Private setting at the end of Blue Blvd. Needs a little TLC. Nice fireplace in living room. Eating area and breakfast bar off the kitchen. Easy Country Living! Seller will not turn utilities on for inspections. Home sold as-is.
-
2014-01-15historical Active CAPA 229-char remark
Show marketing remark (229 chars)
Private setting at the end of Blue Blvd. Needs a little TLC. Nice fireplace in living room. Eating area and breakfast bar off the kitchen. Easy Country Living! Seller will not turn utilities on for inspections. Home sold as-is.
-
2013-12-28price $25,000 229-char remark
Show marketing remark (229 chars)
Private setting at the end of Blue Blvd. Needs a little TLC. Nice fireplace in living room. Eating area and breakfast bar off the kitchen. Easy Country Living! Seller will not turn utilities on for inspections. Home sold as-is.
-
2013-11-08$30,000 Active 229-char remark
Show marketing remark (229 chars)
Private setting at the end of Blue Blvd. Needs a little TLC. Nice fireplace in living room. Eating area and breakfast bar off the kitchen. Easy Country Living! Seller will not turn utilities on for inspections. Home sold as-is.
-
2006-01-05soldstatus $75,000
-
2002-02-04historical
-
2001-10-18$78,000
-
1999-09-08soldstatus $23,000
-
1991-03-19soldstatus $19,000
-
1991-03-01soldstatus $19,000
ⓘ Source: listings_history table (triggers on properties + properties_extension) + one-shot
backfill from property_details.listing_events for pre-trigger history.
Tax reassessment forecast AZ · Resets to sale price
- Current annual tax
- $672 · $56/mo
- Projected year-2 tax
- $1,188 · $99/mo
- Expected delta
- +$516/yr (+$43/mo · 76.7%)
ⓘ Screening estimate from a state-policy table — verify with the county assessor before closing.
Climate risk First Street
- Flood 1/10 Low FEMA zone X (unshaded) · 0% chance over 30 yrs
- Wildfire 5/10 Major
- Heat 8/10 Severe 7 d/yr ≥108°F today · 19 d/yr by 30 yrs out
- Wind 1/10 Low
- Air quality 1/10 Low 0 unhealthy d/yr today · 0 by 30 yrs out
Nearby sold comps map
Loading sold comps map…
Walkable amenities ~0.75 mi
Loading nearby amenities…
Taxation est. · year 1
- Rental income
- $22,114
- − Mortgage interest
- −$10,083
- − Property taxes
- −$672
- − Insurance
- −$900
- − Repairs & maintenance
- −$1,769
- − Management
- −$1,769
- − Depreciation
- −$5,236
- Taxable income
- $1,684
- Est. tax owed @ 24.0%
- −$404
- After-tax cash flow
- $4,166/yr
For passive investors: Depreciation is non-cash, so a rental often shows a tax loss while cash-flowing — sheltering income. Rental losses are passive: they offset passive income freely, and up to $25,000/yr can offset ordinary (W-2) income if you actively participate and your MAGI is under $100k (phasing out to $0 by $150k); unused losses carry forward. On sale, claimed depreciation is recaptured at up to 25%, and gains may owe capital-gains tax (a 1031 exchange can defer both). Figures are a year-1 estimate at your 24.0% rate — not tax advice; consult a CPA.
Schools (NCES district)
- District
- Marana Unified District (4404)
- NCES district ID
- 0404630
- Math proficiency
- 31% ▼ -11.00%
- Reading proficiency
- 37% ▼ -5.00%
- Median HH income
- $65,282
- Composite
- 30.96/100
- National rank
- #6103
- State rank
- #83 of 249 in AZ
Livability — Picture Rocks
- Score
- 55/100
- State rank
- #261
- US rank
- #23370
Category grades
Schools grade is shown separately in the Schools card above.
Census & demographics
- Census place
- Picture Rocks, AZ
- County
- Pima County · 1,012,107 people
- Metro
- Tucson, AZ
- Population (ZIP)
- 31,300
- Household income
- $90,093
- Rent vs Own
- Severe rent burden
- 378.0
Population outlook (Pima County) Hauer SSP2
- Today (2025)
- 1,066,056 people
- By 2030
- 1,086,684 · +1.9%
- By 2040
- 1,117,160 · +4.8%
- By 2050
- 1,149,778 · +7.9%
- By 2075
- 1,271,480 · +19.3%
- By 2100
- 1,321,160 · +23.9%
Race, ethnicity, and origin ACS 2023
- Neighborhood character
- Majority White (63%)
- Race & ethnicity
- White 63% Hispanic / Latino 25% Two or more races 15% Asian 5% Black 2%
- Hispanic origin (detail)
- Mexican 21%
- Common ancestry
- Romanian 3% Lithuanian 2% Slovak 2%
- Foreign-born
- 9% · Canada, China, Vietnam
- Languages at home
- 85% English-only · Spanish 9% Chinese 1% Tagalog/Filipino 1%
Political lean MEDSL · Pima
- 2024 margin
- D (+15.2) · D 57.0% · R 41.8% · Other 1.2%
- 2008→2024 swing
- +9.1pp toward D · 2008: 6.1pp · 2024: 15.2pp
- All cycles
- 2024: D+15.2 2020: D+18.7 2016: D+13.5 2012: D+5.8 2008: D+6.1
Not yet ingested
- Civics
- —
Market trends
- HPI YoY
- ▼ -95.76%
- Current HPI
- 271.2845
- Rent YoY
- ▲ 0.47%
- Metro
- Tucson, AZ
- State GDP YoY
- ▲ 4.54%
- F500 in state
- 20
Industry mix (Fortune 500 HQ in AZ)
| Industry | F500 HQs | Revenue |
|---|---|---|
| Technology | 2 | $13B |
|
||
| Mining / Metals | 1 | $23B |
|
||
| Environmental Services | 1 | $16B |
|
||
| Metals / Steel | 1 | $14B |
|
||
| Technology Distribution | 1 | $9B |
|
||
| Homebuilding | 1 | $8B |
|
||
Price history
+847.4% since first listed12 events — show timeline
- 2026-06-12 Price Changed $180,000 MLSSAZ
- 2026-04-23 Listed $199,999 MLSSAZ
- 2014-04-14 Sold (MLS) $25,000 MLSSAZ
- 2014-01-15 Contingent — MLSSAZ
- 2013-12-28 Price Changed $25,000 MLSSAZ
- 2013-11-08 Listed $30,000 MLSSAZ
- 2006-01-05 Sold (Public Records) $75,000 Public Records
- 2002-02-04 Listing Removed — MLSSAZ
- 2001-10-18 Listed $78,000 MLSSAZ
- 1999-09-08 Sold (Public Records) $23,000 Public Records
- 1991-03-19 Sold (Public Records) $19,000 Public Records
- 1991-03-01 Sold (Public Records) $19,000 Public Records
Property tax history
-1.0%/yrLatest (2025): $672 · +2.6% YoY. Source: county tax records.
Cash-flow waterfall
monthlySold comps — $/sqft
last 12 mo · ≤1 miLoading sold comps…