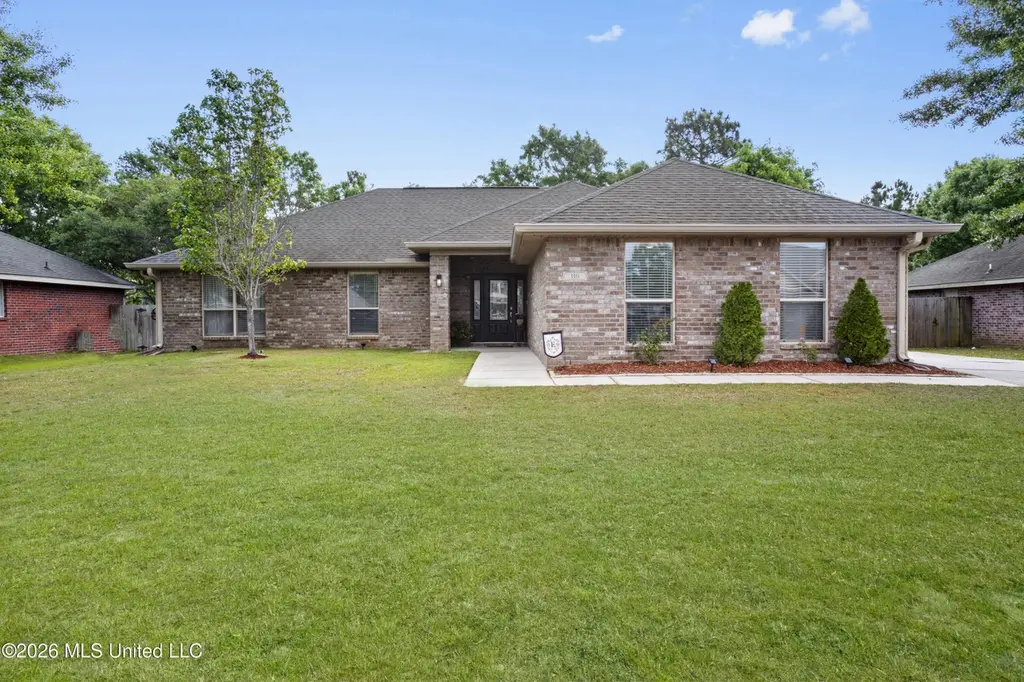
116 Lavender Dr · Gulf Park Estates, MS
Flood risk 4/10 · Minor
- FEMA flood zone
- X (shaded)
- Chance of flooding over 30 yrs
- 0.21%
- Est. flood insurance / yr
- $507 – $1,088
Fire risk 5/10 · Moderate
- Est. fire insurance / yr
- $1,241 – $2,305
Heat risk 10/10 · Severe
- Hot days now (above 105°F)
- 7 days/yr
- Hot days in 30 yrs
- 25 days/yr
Wind risk 9/10 · Severe
- Chance of severe wind over 30 yrs
- 99.0%
Air-quality risk 2/10 · Minimal
- Unhealthy air days now
- 1 days/yr
- Unhealthy air days in 30 yrs
- 2 days/yr
Risk factors via First Street. Map © Google.
Why this score? — see what drove the D+ grade
The composite is a weighted blend of 9 inputs, each scored 0–100. Each bar is that input's sub-score; the figure is the points it added to the 100-point composite (weight × sub-score).
- Cash flow +15.4/30.0
- ARV discount +10.6/15.0
- Schools +5.3/10.0
- DSCR +4.7/10.0
- Livability +3.5/5.0
- 1% rule +3.4/10.0
- Rent growth +2.8/5.0
- Condition / age +2.5/5.0
- Appreciation +0.0/10.0
$284,900
🖨 Deal sheet 📄 Offer letter ✓ Due diligence
Listing remarks MLS
Simple splendor in the place you want to be! This home welcomes you with a open covered front porch and wide entry into either kitchen or family room. The ample family room beckons you to cozy up and enjoy family and company! And you'll have no worries entertaining or spending time in the large fenced in backyard with plenty of space for kids and furbabies to run around in! Call today for your appointment to see this beautiful home! It wont last long!
Key facts
- Open floor plan
- Built in shelves
- 0.23 acre lot
Tags
Property features AI
Finance
- Other: Approximately 1,872 total building area (per public records); Lot about 0.23 acres (per public records)
- HOA & community: Homeowners association with an annual fee of $250 covering grounds maintenance and management; Community amenities include biking trails, boating, fishing, playground, restaurant, RV parking, curbs and sidewalks
Exterior
- Parking: 2-car garage; Concrete driveway; Garage door opener; Side-facing garage with direct access
- Security: Owned security system; Smoke detectors
- Utilities: Public water; Public sewer; Electricity connected; Fiber to the house; Smart home wiring; Underground utilities; Sewer connected; Water connected
- Home design: Single-family house; One story; Move-in ready
- Construction: Brick veneer construction; Architectural shingle roof; Slab foundation; Built per public records
- Exterior features: Porch; Private backyard; Rain gutters; Fenced yard with wood fencing; Few trees; Sprinklers in front; Front yard; Subdivided lot; Rectangular lot
Interior
- Kitchen: Dishwasher; Disposal; ENERGY STAR qualified appliances; Microwave; Oven; Refrigerator; Granite counters
- Bedrooms: Bedrooms with walk-in closets
- Flooring: Luxury vinyl flooring
- Bathrooms: Two full bathrooms; Double vanity in at least one bath
- Heating & cooling: Central heating and cooling; Electric heat and cooling; Heat pump
- Interior features: Ceiling fans; Double vanity; Granite counters; High ceilings; High-speed internet; Open floorplan; Recessed lighting; Walk-in closets; Living room wood-burning fireplace; Double-pane, insulated vinyl windows; Deadbolt locks and storm/secure fiberglass doors
- Laundry & utility: Dedicated laundry room
Neighborhood map
What this means for you Summary
Snapshot
- This is a 4-bed/2.0-bath single-family listed at $285k.
Deal economics
- At list price, monthly cash flow is $110 ($1k/yr) — positive.
- The deal already cash-flows at list — no discount required.
- To meet the 1% rule (rent ≥ 1% of price), the offer needs to be $240k (15.7% below list).
- Recommended offer: $240k (15.7% below list) — sets the bar for 1% rule.
- Cap rate 6.8% vs local median 5.2% in Gulf Park Estates — top-decile yield for the area; either an underpriced asset or a hidden risk that comps aren't pricing in. Stress-test before assuming the spread holds.
Location & tenants
- Location reads 70/100 on livability (#43 in MS) — a middle-class / working-renter tenant base. Strengths: crime A+, cost of living A+, housing A+; Watch: schools D+, health & safety D+, amenities F.
- Ocean Springs School District (suburban): math 64% / reading 59% proficiency, ranked #1 of 130 in MS (top 1%) — acceptable for families but not a draw, mixed tenant base, ~2y average lease.
- Market conditions: Rents rising (+1.3%/yr); 714 active listings in the ZIP; 9 comparable units currently listed for rent nearby; rentals at typical pace (median 14d on market — plan ~3-4 weeks tenant-placement turnaround); solid renter incomes; 516 units permitted in Jackson County in 2024 (6 in 5+ unit buildings).
- This rent runs 37% of the median local income ($79k/yr) — at the standard rent-burdened threshold; future hikes will face affordability resistance.
Forward outlook
- Local home prices are declining (-3.0%/yr); year-one equity from $2k of loan paydown is wiped out by about $9k of value loss. Plan a longer hold.
Negotiation context
- It's been on market 27 days — a 2% lower offer ($281k) is reasonable based on typical stale-listing flexibility.
- 4 sale attempts since 10y ago with the ask held roughly flat each time — persistent listings suggest the price (not the market) is what's stuck; bring a comps-based counter.
Risks & watch-outs
- Climate carrying-cost: severe wind risk, 99% chance of damaging wind over 30y; moderate wildfire risk; extreme-heat days projected 7→25/yr by 2055 (HVAC capex compounding) — expect insurance premiums to compound above CPI over the hold.
Questions for the listing agent
- What does the HOA fee cover, when was the last increase, and are there any pending special assessments or reserve-fund shortfalls?
- Is there a deadline driving the sale (1031 exchange, divorce, estate, relocation)? That informs how much negotiation room exists.
- Schools are D-rated, which usually means shorter tenancies and higher turnover. Who's the typical renter profile here, and what's been the actual vacancy rate?
- The area grade is low — what's the realistic commute time and amenity access for the typical tenant pool here? Any planned neighborhood developments (good or bad) we should know about?
- What's the average days-on-market for RENTAL listings here right now (not sales)? A rising rental-DOM trend means longer vacancies and softer asking-rent achievability than the comps imply.
- What's the recent tenant-quality profile in this submarket — average credit score on applications, eviction rate, late-payment / NSF rate, and stable-employment percentage? A property-management company in the area should have these aggregated.
- How much new for-sale + rental construction is in the pipeline within 1–3 miles? Heavy new supply typically softens prices + rents 12–24 months out; constrained supply supports both.
Investment metrics
- 1% rule
- 0.84% ✗
- Cap rate
- 6.76%
- Cash-on-cash
- 1.66%
- DSCR
- 1.07
- GRM
- 9.9
CMA / ARV
- ARV (median comp)
- $305,862
- List price
- $284,900
- Delta
- -6.85%
- Verdict
- FAIR
- Comps
- 20 within 1.0 mi
Show comp detail 12 sales within ~0.75 mi
| Address | Dist | Beds/Ba | Sqft | Sold | Price | $/sf | Match |
|---|---|---|---|---|---|---|---|
| 116 Saltmeadow Cir | 0.23mi | 4/2.0 | 1,828 (-2%) | 4mo | $250,000 | $137 | 82 |
| 6821 Sweetclover Dr | 0.37mi | 4/2.0 | 1,886 (+1%) | 1mo | $269,900 | $143 | 81 |
| 7348 Shearwater Way | 0.42mi | 4/2.0 | 1,835 (-2%) | 8mo | $259,000 | $141 | 71 |
| 112 Brackish Pl | 0.20mi | 3/2.0 (-1) | 1,731 (-8%) | 6mo | $281,000 | $162 | 68 |
| 63 Saltmeadow Cir | 0.22mi | 3/2.0 (-1) | 1,685 (-10%) | 1mo | $285,000 | $169 | 67 |
| 6825 Sweetclover Dr | 0.38mi | 4/2.0 | 2,098 (+12%) | 3mo | $304,999 | $145 | 60 |
| 6896 Sweetclover Dr | 0.59mi | 4/2.0 | 2,094 (+12%) | 3mo | $294,000 | $140 | 50 |
| 6911 Pinehurst Dr | 0.61mi | 3/2.0 (-1) | 1,690 (-10%) | 1mo | $245,000 | $145 | 50 |
| 1236 Spruce St | 0.67mi | 4/3.0 | 1,724 (-8%) | 7mo | $215,000 | $125 | 46 |
| 6800 Oakhurst Dr | 0.69mi | 3/2.0 (-1) | 1,680 (-10%) | 5mo | $189,999 | $113 | 42 |
| 242 Tantallon Dr | 0.74mi | 3/3.0 (-1) | 1,728 (-8%) | 6mo | $299,000 | $173 | 38 |
| 6900 Red Bud Ln | 0.74mi | 3/2.0 (-1) | 1,677 (-10%) | 7mo | $242,500 | $145 | 37 |
Match score weights: distance 35% · size 25% · config 20% · recency 20%. Top-matched comps best support the ARV.
Projected returns pro-forma
-3.0% appreciation · 1.31% rent growth · sell at horizon
- IRR
- -15.4%
- Equity multiple
- 0.46×
- Total profit
- $-43,241
- Equity at exit
- $42,480
- IRR
- -9.9%
- Equity multiple
- 0.44×
- Total profit
- $-44,851
- Equity at exit
- $24,633
Cash invested: $79,772 (down + closing). Projections, not guarantees.
Landlord ↔ Tenant lean methodology
- Overall (STATE)
- 90 Strongly Landlord-Friendly
- State Mississippi
- 90 Strongly Landlord-Friendly · R+11
- County
- — inherits STATE
- City
- — inherits STATE
ZIP-level market 39564
- Home prices YoY
- -26.8%
- Rents YoY
- 1.3%
- Active inventory
- 714
- Price-to-rent
- 9.9×
Monthly cashflow live
- Estimated rent
- $2,401 high interval (Pro) →
- Mortgage (P&I)
- −$1,494
- Tax from tax record
- −$153 /mo · $1,830/yr
- Insurance
- −$119
- HOA
- −$21
- Vacancy / Maint / Mgmt
- −$504
- Net cashflow
- $110
Break-even live
UW: 25.0% down · 7.5% · 30yr · 1.5% tax · 5.0% vac · 8.0% maint · 8.0% mgmt
Financing live
Cash to close
- Down payment
- $71,225
- Closing costs
- $8,547
- Reserves months
- —
- Total cash needed
- —
Loan-product check · same deal, 3 products live
Conventional
25% down · 7.5% · 30yr
- Down + closing
- —
- Monthly P&I
- —
- Monthly cashflow
- —
- DSCR
- —
- Eligible?
- —
Personal DTI + credit; lowest rate.
DSCR
20% down · 8.5% · 30yr
- Down + closing
- —
- Monthly P&I
- —
- Monthly cashflow
- —
- DSCR
- —
- Eligible?
- —
No personal income docs; deal must DSCR.
Hard money
10% down · 12.0% · 12mo
- Down + closing
- —
- Monthly P&I
- —
- Monthly cashflow
- —
- DSCR
- —
- Eligible?
- —
Short-term bridge; refi at stabilization.
Rent comps 9 comps
| Address | Beds | Baths | Sqft | Rent | $/sqft | DOM | Units | Dist |
|---|---|---|---|---|---|---|---|---|
| 62 Tantallon Dr Ocean Springs, MS | 4.0 | 2.0 | 1966 | $2,450 | $1.25 | 14d | 1 | 0.10mi |
| 413 Sturnidae Cv Ocean Springs, MS | 3.0 | 2.0 | 1676 | $1,900 | $1.13 | 44d | 1 | 0.14mi |
| 6453 Chickory Way Ocean Springs, MS | 4.0 | 2.5 | 2516 | $2,500 | $0.99 | 44d | 1 | 0.22mi |
| 1070 Brackish Pl Ocean Springs, MS | 4.0 | 2.5 | 2353 | $2,500 | $1.06 | 14d | 1 | 0.32mi |
| 1208 Carraway Cv Ocean Springs, MS | 4.0 | 3.0 | 2486 | $2,800 | $1.13 | 14d | 1 | 0.35mi |
| 6717 Belle Fontaine Dr Unit 1032111P Ocean Springs, MS | 3.0 | 3.0 | 1991 | $7,902 | $3.97 | 14d | 1 | 0.84mi |
| 1608 Hunt St Ocean Springs, MS | 3.0 | 2.0 | 1550 | $1,700 | $1.10 | 44d | 1 | 0.88mi |
| 8001 Westwood Cir Ocean Springs, MS | 3.0–5.0 | 2.0–3.0 | 1996 | $2,425 | $1.21 | 14d | 1 | 1.01mi |
| 1632 Emerald Lakes Dr Ocean Springs, MS | 3.0–4.0 | 2.0 | 1585 | $2,350 | $1.48 | 14d | 1 | 1.08mi |
HOA detail
- Monthly dues
- $21 · $252/yr
Listing history 8 events
-
2026-04-27$284,900 Active 1318-char remark
-
2021-10-01historical
-
2020-09-23soldstatus
Show marketing remark (455 chars)
Simple splendor in the place you want to be! This home welcomes you with a open covered front porch and wide entry into either kitchen or family room. The ample family room beckons you to cozy up and enjoy family and company! And you'll have no worries entertaining or spending time in the large fenced in backyard with plenty of space for kids and furbabies to run around in! Call today for your appointment to see this beautiful home! It wont last long!
-
2020-08-07$212,000
Show marketing remark (455 chars)
Simple splendor in the place you want to be! This home welcomes you with a open covered front porch and wide entry into either kitchen or family room. The ample family room beckons you to cozy up and enjoy family and company! And you'll have no worries entertaining or spending time in the large fenced in backyard with plenty of space for kids and furbabies to run around in! Call today for your appointment to see this beautiful home! It wont last long!
-
2018-11-28soldstatus
-
2018-10-03$189,900
-
2016-07-24$198,500
ⓘ Source: listings_history table (triggers on properties + properties_extension) + one-shot
backfill from property_details.listing_events for pre-trigger history.
Tax reassessment forecast MS · Resets to sale price
- Current annual tax
- $1,830 · $153/mo
- Projected year-2 tax
- $2,251 · $188/mo
- Expected delta
- +$420/yr (+$35/mo · 23.0%)
ⓘ Screening estimate from a state-policy table — verify with the county assessor before closing.
Climate risk First Street
- Flood 4/10 Moderate FEMA zone X (shaded) · 21% chance over 30 yrs
- Wildfire 5/10 Major
- Heat 10/10 Extreme 7 d/yr ≥105°F today · 25 d/yr by 30 yrs out
- Wind 9/10 Extreme 99% chance of damaging wind over 30 yrs
- Air quality 2/10 Low 1 unhealthy d/yr today · 2 by 30 yrs out
Nearby sold comps map
Loading sold comps map…
Walkable amenities ~0.75 mi
Loading nearby amenities…
Taxation est. · year 1
- Rental income
- $28,807
- − Mortgage interest
- −$15,959
- − Property taxes
- −$1,830
- − Insurance
- −$1,424
- − Repairs & maintenance
- −$2,305
- − Management
- −$2,305
- − HOA
- −$252
- − Depreciation
- −$8,288
- Taxable loss
- −$3,556
- Est. tax savings @ 24.0%
- +$853
- After-tax cash flow
- $2,175/yr
For passive investors: Depreciation is non-cash, so a rental often shows a tax loss while cash-flowing — sheltering income. Rental losses are passive: they offset passive income freely, and up to $25,000/yr can offset ordinary (W-2) income if you actively participate and your MAGI is under $100k (phasing out to $0 by $150k); unused losses carry forward. On sale, claimed depreciation is recaptured at up to 25%, and gains may owe capital-gains tax (a 1031 exchange can defer both). Figures are a year-1 estimate at your 24.0% rate — not tax advice; consult a CPA.
Schools (NCES district)
- District
- Ocean Springs School District
- NCES district ID
- 2803360
- Math proficiency
- 64% ▼ -3.00%
- Reading proficiency
- 59% ▲ 1.00%
- Median HH income
- $60,485
- Composite
- 53.35/100
- National rank
- #1477
- State rank
- #1 of 130 in MS
Livability — Gulf Park Estates
- Score
- 70/100
- State rank
- #43
- US rank
- #7955
Category grades
Schools grade is shown separately in the Schools card above.
Census & demographics
- County
- Jackson County · 82,196 people
- Metro
- Gulfport-Biloxi, MS
- Population (ZIP)
- 43,240
- Household income
- $78,596
- Rent vs Own
- Severe rent burden
- 734.0
Population outlook (Jackson County) Hauer SSP2
- Today (2025)
- 146,926 people
- By 2030
- 148,442 · +1.0%
- By 2040
- 149,631 · +1.8%
- By 2050
- 148,723 · +1.2%
- By 2075
- 147,845 · +0.6%
- By 2100
- 144,510 · -1.6%
Race, ethnicity, and origin ACS 2023
- Neighborhood character
- Predominantly White (74%)
- Race & ethnicity
- White 74% Black 10% Hispanic / Latino 8% Two or more races 7% Asian 4%
- Hispanic origin (detail)
- Mexican 3% Puerto Rican 2%
- Common ancestry
- Lithuanian 5% Slovak 4% Romanian 2%
- Foreign-born
- 5% · Canada, South Korea, Vietnam
- Languages at home
- 93% English-only · Spanish 3% Vietnamese 2% Tagalog/Filipino 1%
Political lean MEDSL · Jackson
- 2024 margin
- Solid R (+39.9) · D 29.5% · R 69.4% · Other 1.1%
- 2008→2024 swing
- -6.4pp toward R · 2008: -33.5pp · 2024: -39.9pp
- All cycles
- 2024: R+39.9 2020: R+34.6 2016: R+39.9 2012: R+36.1 2008: R+33.5
Not yet ingested
- Civics
- —
Market trends
- HPI YoY
- ▼ -74.77%
- Current HPI
- 204.2244
- Rent YoY
- ▲ 1.31%
- Metro
- Gulfport-Biloxi, MS
- State GDP YoY
- —
- F500 in state
- 0
Price history
+43.5% since first listed9 events — show timeline
- 2026-05-25 Pending — MLSU
- 2026-04-27 Listed $284,900 MLSU
- 2021-10-01 Listing Removed — MLSU
- 2020-09-23 Sold (Public Records) — Public Records
- 2020-09-23 Sold (MLS) — MLSU
- 2020-08-07 Listed $212,000 MLSU
- 2018-11-28 Sold (MLS) — MLSU
- 2018-10-03 Listed $189,900 MLSU
- 2016-07-24 Listed $198,500 MLSU
Property tax history
+1.9%/yrLatest (2025): $1,830 · +5.9% YoY. Source: county tax records.
Cash-flow waterfall
monthlySold comps — $/sqft
last 12 mo · ≤1 miLoading sold comps…