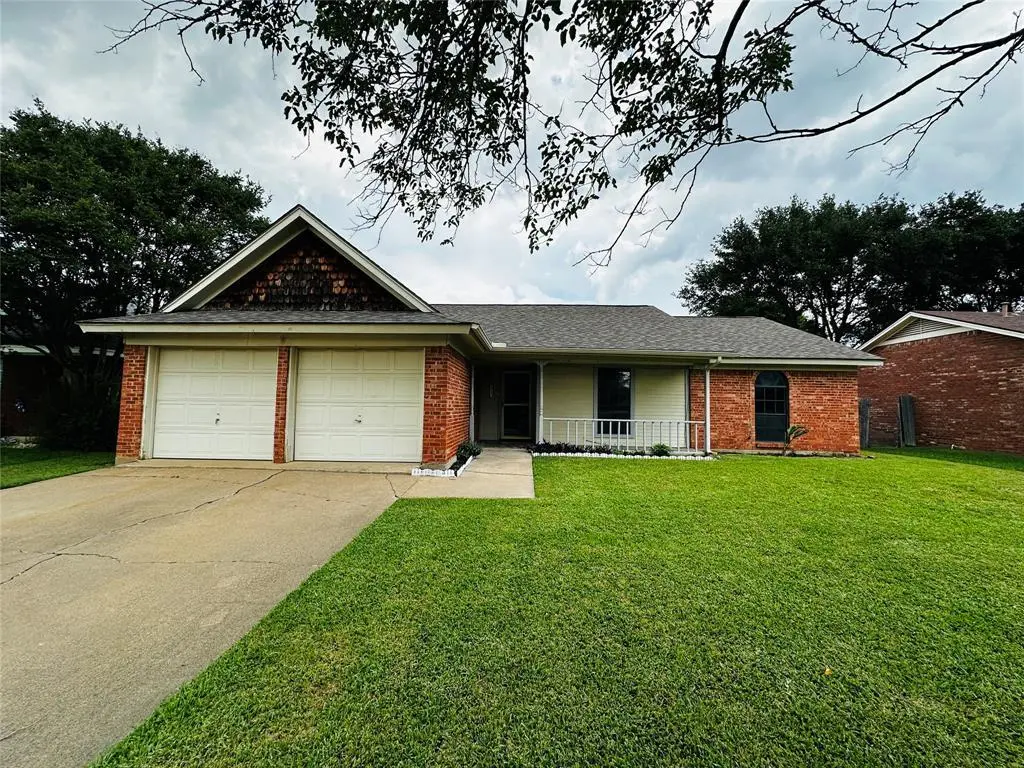
6741 Ridgetop Rd · North Richland Hills, TX
Flood risk 1/10 · Minimal
- FEMA flood zone
- X (unshaded)
- Chance of flooding over 30 yrs
- 0.0%
- Est. flood insurance / yr
- $507 – $1,088
Fire risk 1/10 · Minimal
- Est. fire insurance / yr
- $1,222 – $2,270
Heat risk 8/10 · Major
- Hot days now (above 109°F)
- 7 days/yr
- Hot days in 30 yrs
- 24 days/yr
Wind risk 4/10 · Minor
- Chance of severe wind over 30 yrs
- 24.0%
Air-quality risk 3/10 · Minor
- Unhealthy air days now
- 3 days/yr
- Unhealthy air days in 30 yrs
- 4 days/yr
Risk factors via First Street. Map © Google.
Why this score? — see what drove the D+ grade
The composite is a weighted blend of 9 inputs, each scored 0–100. Each bar is that input's sub-score; the figure is the points it added to the 100-point composite (weight × sub-score).
- ARV discount +15.0/15.0
- Cash flow +11.9/30.0
- 1% rule +3.7/10.0
- Schools +3.7/10.0
- Livability +3.6/5.0
- DSCR +3.5/10.0
- Rent growth +3.1/5.0
- Condition / age +2.5/5.0
- Appreciation +0.0/10.0
$250,000
🖨 Deal sheet 📄 Offer letter ✓ Due diligence
Listing remarks MLS
Good location, convenient and not on a busy street. Home has an open floorplan with good flow between living, breakfast and kitchen areas. Split bedooms with dual closets in master. Covered porch is a great place to enjoy relaxing backyard.
Key facts
- Beamed ceilings
- Large backyard
- Covered back patio
Tags
Property features AI
Finance
- HOA & community: No association
Exterior
- Parking: Attached 2-car garage with double doors, garage faces front; 2 covered parking spaces
- Utilities: City water; City sewer; Electricity connected; Individual water meter; Cable available
- Home design: Single family residence; One story; Residential property; Built in 1983
- Construction: Brick and siding exterior; Composition shingle roof; Preowned construction
- Exterior features: Covered porch(es); Gutters; Wood fencing; Few trees; Large backyard with grass; Located in a subdivision
Interior
- Kitchen: Dishwasher; Electric oven; Pantry
- Bedrooms: 3 bedrooms; Primary bedroom on main level with ensuite bath, separate shower, dual sinks, and walk-in closet
- Flooring: Luxury vinyl plank flooring
- Bathrooms: 2 full bathrooms
- Heating & cooling: Electric heating; Fireplace heating (wood burning); Ceiling fans; Electric cooling
- Interior features: Open floorplan; Pantry; Cable TV available; High speed internet available; One living area; One dining area
- Laundry & utility: Washer hookup; Electric dryer hookup; Full-size washer/dryer area; Laundry located in kitchen
Neighborhood map
What this means for you Summary
Snapshot
- This is a 3-bed/2.0-bath single-family listed at $250k.
Deal economics
- At list price, monthly cash flow is $-62 ($-746/yr) — negative.
- To cash-flow at today's rent, offer at most $239k (4.4% below list).
- To meet the 1% rule (rent ≥ 1% of price), the offer needs to be $217k (13.1% below list).
- Recommended offer: $217k (13.1% below list) — sets the bar for 1% rule.
- Cap rate 6.0% vs local median 3.6% in North Richland Hills — top-decile yield for the area; either an underpriced asset or a hidden risk that comps aren't pricing in. Stress-test before assuming the spread holds.
Location & tenants
- Location reads 71/100 on livability (#286 in TX) — a middle-class / working-renter tenant base. Strengths: housing A+, cost of living A, employment A-; Watch: amenities F, commute F, health & safety D-.
- Birdville ISD (suburban): math 42% / reading 43% proficiency, ranked #299 of 826 in TX (top 36%) — families likely to look elsewhere, expect single-tenant / working-renter base with shorter leases.
- Market conditions: Rents rising (+2.2%/yr); 174 active listings in the ZIP; 40 comparable units currently listed for rent nearby; rentals at typical pace (median 25d on market — plan ~3-4 weeks tenant-placement turnaround); high-income renter base; 18,938 units permitted in Tarrant County in 2024 (8,336 in 5+ unit buildings).
Forward outlook
- Local home prices are declining (-3.0%/yr); year-one equity from $2k of loan paydown is wiped out by about $8k of value loss. Plan a longer hold.
- Tarrant County population projected at +41% by 2050 — long-run rental-demand tailwind backs the buy-and-hold thesis.
Negotiation context
- Only 10 days on market — expect competitive offers; lowballing is unlikely to land.
- 2 sale attempts since 16y ago with the ask held roughly flat each time — persistent listings suggest the price (not the market) is what's stuck; bring a comps-based counter.
Risks & watch-outs
- Climate carrying-cost: extreme-heat days projected 7→24/yr by 2055 (HVAC capex compounding) — expect insurance premiums to compound above CPI over the hold.
Questions for the listing agent
- What do current leases actually rent for vs. the listed asking? Can we see a recent rent roll and the last 12 months of T-12 income?
- Is there a deadline driving the sale (1031 exchange, divorce, estate, relocation)? That informs how much negotiation room exists.
- Schools are B-rated — typically a magnet for longer-tenancy family renters. What's the average tenant stay here, and is there a school-zone premium baked into asking?
- The area grade is low — what's the realistic commute time and amenity access for the typical tenant pool here? Any planned neighborhood developments (good or bad) we should know about?
- What's the average days-on-market for RENTAL listings here right now (not sales)? A rising rental-DOM trend means longer vacancies and softer asking-rent achievability than the comps imply.
- What's the recent tenant-quality profile in this submarket — average credit score on applications, eviction rate, late-payment / NSF rate, and stable-employment percentage? A property-management company in the area should have these aggregated.
- How much new for-sale + rental construction is in the pipeline within 1–3 miles? Heavy new supply typically softens prices + rents 12–24 months out; constrained supply supports both.
Investment metrics
- 1% rule
- 0.87% ✗
- Cap rate
- 5.99%
- Cash-on-cash
- -1.07%
- DSCR
- 0.95
- GRM
- 9.6
CMA / ARV
- ARV (on-the-fly)
- $337,335
- Comps found
- 12
Show comp detail 12 sales within ~0.75 mi
| Address | Dist | Beds/Ba | Sqft | Sold | Price | $/sf | Match |
|---|---|---|---|---|---|---|---|
| 6524 Blue Grass Dr | 0.48mi | 3/2.0 | 1,595 (+2%) | 1mo | $269,000 | $169 | 74 |
| 7301 Windcrest Ln | 0.42mi | 3/2.0 | 1,494 (-5%) | 2mo | $365,000 | $244 | 71 |
| 6640 Fair Oaks Dr | 0.46mi | 3/2.0 | 1,484 (-5%) | 2mo | $265,000 | $179 | 68 |
| 6636 Redbud Dr | 0.60mi | 3/2.0 | 1,603 (+2%) | 1mo | $315,000 | $197 | 68 |
| 7020 Green Ridge Trl | 0.36mi | 3/2.0 | 1,416 (-10%) | 1mo | $297,500 | $210 | 66 |
| 7205 Windcrest Ct E | 0.54mi | 3/2.0 | 1,643 (+5%) | 3mo | $353,900 | $215 | 65 |
| 6520 Kary Lynn Dr S | 0.55mi | 3/2.0 | 1,481 (-6%) | 2mo | $320,000 | $216 | 63 |
| 6516 N Park Dr | 0.66mi | 3/2.0 | 1,630 (+4%) | 1mo | $360,000 | $221 | 61 |
| 6828 Moss Ln | 0.65mi | 3/2.5 | 1,649 (+5%) | 0mo | $390,000 | $237 | 59 |
| 6804 Greenleaf Dr | 0.53mi | 3/2.0 | 1,746 (+11%) | 0mo | $344,900 | $198 | 56 |
| 6529 Blue Grass Dr | 0.47mi | 3/2.0 | 1,354 (-14%) | 2mo | $314,900 | $233 | 54 |
| 6461 Westridge Dr | 0.69mi | 3/2.0 | 1,406 (-10%) | 1mo | $209,900 | $149 | 49 |
Match score weights: distance 35% · size 25% · config 20% · recency 20%. Top-matched comps best support the ARV.
Projected returns pro-forma
-3.0% appreciation · 2.23% rent growth · sell at horizon
- IRR
- -18.9%
- Equity multiple
- 0.34×
- Total profit
- $-46,079
- Equity at exit
- $37,276
- IRR
- -13.1%
- Equity multiple
- 0.26×
- Total profit
- $-51,714
- Equity at exit
- $21,615
Cash invested: $70,000 (down + closing). Projections, not guarantees.
Landlord ↔ Tenant lean methodology
- Overall (STATE)
- 87 Strongly Landlord-Friendly
- State Texas
- 87 Strongly Landlord-Friendly · R+5
- County
- — inherits STATE
- City
- — inherits STATE
ZIP-level market 76182
- Rents YoY
- 2.2%
- Active inventory
- 174
- Price-to-rent
- 9.6×
Monthly cashflow live
- Estimated rent
- $2,171 high interval (Pro) →
- Mortgage (P&I)
- −$1,311
- Tax from tax record
- −$362 /mo · $4,350/yr
- Insurance
- −$104
- HOA
- −$0
- Vacancy / Maint / Mgmt
- −$456
- Net cashflow
- $-62
Break-even live
UW: 25.0% down · 7.5% · 30yr · 1.5% tax · 5.0% vac · 8.0% maint · 8.0% mgmt
Financing live
Cash to close
- Down payment
- $62,500
- Closing costs
- $7,500
- Reserves months
- —
- Total cash needed
- —
Loan-product check · same deal, 3 products live
Conventional
25% down · 7.5% · 30yr
- Down + closing
- —
- Monthly P&I
- —
- Monthly cashflow
- —
- DSCR
- —
- Eligible?
- —
Personal DTI + credit; lowest rate.
DSCR
20% down · 8.5% · 30yr
- Down + closing
- —
- Monthly P&I
- —
- Monthly cashflow
- —
- DSCR
- —
- Eligible?
- —
No personal income docs; deal must DSCR.
Hard money
10% down · 12.0% · 12mo
- Down + closing
- —
- Monthly P&I
- —
- Monthly cashflow
- —
- DSCR
- —
- Eligible?
- —
Short-term bridge; refi at stabilization.
Rent comps 40 comps
| Address | Beds | Baths | Sqft | Rent | $/sqft | DOM | Units | Dist |
|---|---|---|---|---|---|---|---|---|
| 6889 Hightower Dr Unit 6922 North Richland Hills, TX | 3.0 | 2.0 | 1219 | $1,921 | $1.58 | 3d | 1 | 0.04mi |
| 6889 Hightower Dr North Richland Hills, TX | 3.0 | 2.0 | 1219 | $1,939 | $1.59 | 13d | 1 | 0.09mi |
| 6633 Greendale Dr Watauga, TX | 3.0 | 2.0 | 1379 | $2,025 | $1.47 | 25d | 1 | 0.32mi |
| 6633 Greendale Dr Watauga, TX | 3.0 | 2.0 | 1379 | $2,025 | $1.47 | 21d | 1 | 0.32mi |
| 7008 Hanging Cliff Pl North Richland Hills, TX | 3.0 | 2.0 | 1441 | $2,095 | $1.45 | 44d | 1 | 0.36mi |
| 7427 Windhaven Rd North Richland Hills, TX | 2.0 | 2.0 | 1100 | $1,575 | $1.43 | 3d | 1 | 0.49mi |
| 6529 Blue Grass Dr Watauga, TX | 3.0 | 2.0 | 1354 | $2,150 | $1.59 | 24d | 1 | 0.50mi |
| 7002 Lincoln Dr North Richland Hills, TX | 2.0 | 2.0 | 1125 | $1,675 | $1.49 | 15d | 1 | 0.50mi |
| 6569 Westridge Dr Watauga, TX | 3.0 | 2.5 | 1487 | $2,050 | $1.38 | 44d | 1 | 0.52mi |
| 6937 Cheswick Dr North Richland Hills, TX | 3.0 | 2.0 | 1181 | $1,900 | $1.61 | 22d | 1 | 0.52mi |
| 6937 Cheswick Dr North Richland Hills, TX | 3.0 | 2.0 | 1181 | $1,900 | $1.61 | 18d | 1 | 0.52mi |
| 6516 Meadowview Ln Watauga, TX | 3.0 | 2.0 | 1164 | $2,100 | $1.80 | 24d | 1 | 0.54mi |
| 7525 Windhaven Rd North Richland Hills, TX | 3.0 | 2.0 | 1212 | $1,595 | $1.32 | 25d | 1 | 0.58mi |
| 6621 North Park Dr Watauga, TX | 3.0 | 2.0 | 1401 | $2,085 | $1.49 | 25d | 1 | 0.60mi |
| 6405 Kary Lynn Dr S Watauga, TX | 3.0 | 2.0 | 1072 | $1,950 | $1.82 | 24d | 1 | 0.69mi |
| 6869 Dogwood Ct North Richland Hills, TX | 3.0 | 2.5 | 1887 | $2,545 | $1.35 | 44d | 1 | 0.70mi |
| 6620 Moss Ln Watauga, TX | 3.0 | 2.0 | 1659 | $2,250 | $1.36 | 4d | 1 | 0.70mi |
| 6405 Kary Lynn Dr N Watauga, TX | 3.0 | 2.0 | 1072 | $1,950 | $1.82 | 24d | 1 | 0.71mi |
| 6437 Starnes Rd Watauga, TX | 3.0 | 2.0 | 1297 | $1,980 | $1.53 | 44d | 1 | 0.75mi |
| 7013 Lincolnshire Ln North Richland Hills, TX | 3.0 | 2.0 | 1419 | $2,000 | $1.41 | 3d | 1 | 0.77mi |
| 7013 Lincolnshire Ln North Richland Hills, TX | 3.0 | 2.0 | 1419 | $2,200 | $1.55 | 25d | 1 | 0.77mi |
| 7608 Meadowlark Ln N Watauga, TX | 3.0 | 2.0 | 1377 | $1,925 | $1.40 | 22d | 1 | 0.77mi |
| 7529 Meadowlark Ln N Watauga, TX | 3.0 | 2.0 | 1342 | $2,150 | $1.60 | 44d | 1 | 0.78mi |
| 8041 Miles Dr Unit LO Watauga, TX | 3.0 | 2.0 | 1568 | $2,095 | $1.34 | 17d | 1 | 0.82mi |
| 6705 Nola Ct Watauga, TX | 3.0 | 2.0 | 1792 | $2,500 | $1.40 | 44d | 1 | 0.82mi |
| 6629 High Lawn Ter Watauga, TX | 3.0 | 2.0 | 1497 | $2,150 | $1.44 | 18d | 1 | 0.82mi |
| 7400 Echo Hill Dr Watauga, TX | 3.0 | 2.0 | 1364 | $1,950 | $1.43 | 5d | 1 | 0.85mi |
| 7320 Echo Hill Dr Watauga, TX | 3.0 | 2.0 | 1287 | $1,890 | $1.47 | 44d | 1 | 0.85mi |
| 7529 Walnuthill Ct Watauga, TX | 3.0 | 2.0 | 1360 | $2,150 | $1.58 | 44d | 1 | 0.86mi |
| 6421 Alta Vista Dr Watauga, TX | 4.0 | 2.0 | 1596 | $2,165 | $1.36 | 44d | 1 | 0.86mi |
| 6355 Starnes Rd Watauga, TX | 3.0 | 2.5 | 1956 | $2,600 | $1.33 | 22d | 1 | 0.88mi |
| 6541 Wakefield Rd Unit N North Richland Hills, TX | 3.0 | 2.0 | 1564 | $1,800 | $1.15 | 44d | 1 | 0.88mi |
| 7001 Newcastle Pl North Richland Hills, TX | 3.0 | 2.0 | 1455 | $2,400 | $1.65 | 44d | 1 | 0.88mi |
| 6617 Nola Dr Watauga, TX | 3.0 | 2.0 | 1395 | $2,095 | $1.50 | 25d | 1 | 0.89mi |
| 6548 Fairview Dr Watauga, TX | 3.0 | 2.0 | 1733 | $2,950 | $1.70 | 44d | 1 | 0.90mi |
| 6444 Whitehurst Dr Watauga, TX | 3.0 | 3.0 | 1610 | $2,450 | $1.52 | 44d | 1 | 0.96mi |
| 6024 Herschel Dr Watauga, TX | 3.0 | 2.0 | 1418 | $1,950 | $1.38 | 15d | 1 | 1.03mi |
| 6024 Herschel Dr Watauga, TX | 3.0 | 2.0 | 1418 | $1,950 | $1.38 | 22d | 1 | 1.03mi |
| 6420 Sunrise Dr North Richland Hills, TX | 3.0 | 2.0 | 1470 | $1,725 | $1.17 | 25d | 1 | 1.05mi |
| 6017 Hillcrest Dr Watauga, TX | 3.0 | 2.0 | 1314 | $1,950 | $1.48 | 8d | 1 | 1.08mi |
Listing history 14 events
-
2026-06-07statusdays on market $250,000 Pending 10 DOM
-
2026-06-04days on market $250,000 Active Option Contract 9 DOM
-
2026-06-03days on market $250,000 Active Option Contract 8 DOM
-
2026-06-02statusdays on market $250,000 Active Option Contract 7 DOM
-
2026-06-01days on market $250,000 Active 6 DOM
-
2026-05-31days on market $250,000 Active 5 DOM
-
2026-05-26$250,000 Active
-
2010-09-30soldstatus
-
2010-09-28soldstatus 240-char remark
Show marketing remark (240 chars)
Good location, convenient and not on a busy street. Home has an open floorplan with good flow between living, breakfast and kitchen areas. Split bedooms with dual closets in master. Covered porch is a great place to enjoy relaxing backyard.
-
2010-08-30historical 240-char remark
Show marketing remark (240 chars)
Good location, convenient and not on a busy street. Home has an open floorplan with good flow between living, breakfast and kitchen areas. Split bedooms with dual closets in master. Covered porch is a great place to enjoy relaxing backyard.
-
2010-01-13$100,000 240-char remark
Show marketing remark (240 chars)
Good location, convenient and not on a busy street. Home has an open floorplan with good flow between living, breakfast and kitchen areas. Split bedooms with dual closets in master. Covered porch is a great place to enjoy relaxing backyard.
-
2005-04-01soldstatus
-
1992-06-05soldstatus
-
1988-12-02soldstatus
ⓘ Source: listings_history table (triggers on properties + properties_extension) + one-shot
backfill from property_details.listing_events for pre-trigger history.
Tax reassessment forecast TX · Resets to sale price
- Current annual tax
- $4,350 · $362/mo
- Projected year-2 tax
- $4,575 · $381/mo
- Expected delta
- +$225/yr (+$19/mo · 5.2%)
ⓘ Screening estimate from a state-policy table — verify with the county assessor before closing.
Climate risk First Street
- Flood 1/10 Low FEMA zone X (unshaded) · 0% chance over 30 yrs
- Wildfire 1/10 Low
- Heat 8/10 Severe 7 d/yr ≥109°F today · 24 d/yr by 30 yrs out
- Wind 4/10 Moderate 24% chance of damaging wind over 30 yrs
- Air quality 3/10 Moderate 3 unhealthy d/yr today · 4 by 30 yrs out
Nearby sold comps map
Loading sold comps map…
Walkable amenities ~0.75 mi
Loading nearby amenities…
Taxation est. · year 1
- Rental income
- $26,058
- − Mortgage interest
- −$14,004
- − Property taxes
- −$4,350
- − Insurance
- −$1,250
- − Repairs & maintenance
- −$2,085
- − Management
- −$2,085
- − Depreciation
- −$7,273
- Taxable loss
- −$4,988
- Est. tax savings @ 24.0%
- +$1,197
- After-tax cash flow
- $451/yr
For passive investors: Depreciation is non-cash, so a rental often shows a tax loss while cash-flowing — sheltering income. Rental losses are passive: they offset passive income freely, and up to $25,000/yr can offset ordinary (W-2) income if you actively participate and your MAGI is under $100k (phasing out to $0 by $150k); unused losses carry forward. On sale, claimed depreciation is recaptured at up to 25%, and gains may owe capital-gains tax (a 1031 exchange can defer both). Figures are a year-1 estimate at your 24.0% rate — not tax advice; consult a CPA.
Schools (NCES district)
- District
- Birdville ISD
- NCES district ID
- 4810230
- Math proficiency
- 42% ▼ -12.00%
- Reading proficiency
- 43% ▼ -6.00%
- Median HH income
- $55,930
- Composite
- 37.13/100
- National rank
- #4491
- State rank
- #299 of 826 in TX
Livability — North Richland Hills
- Score
- 71/100
- State rank
- #286
- US rank
- #6602
Category grades
Schools grade is shown separately in the Schools card above.
Census & demographics
- Census place
- North Richland Hills, TX
- County
- Tarrant County · 2,033,669 people
- City population
- 68,613
- Metro
- Dallas-Fort Worth-Arlington, TX
- Population (ZIP)
- 30,242
- Household income
- $120,558
- Rent vs Own
- Severe rent burden
- 284.0
Population outlook (Tarrant County) Hauer SSP2
- Today (2025)
- 2,380,417 people
- By 2030
- 2,578,900 · +8.3%
- By 2040
- 2,974,995 · +25.0%
- By 2050
- 3,350,489 · +40.8%
- By 2075
- 4,216,909 · +77.2%
- By 2100
- 4,741,527 · +99.2%
Race, ethnicity, and origin ACS 2023
- Neighborhood character
- Predominantly White (74%)
- Race & ethnicity
- White 74% Hispanic / Latino 15% Two or more races 10% Asian 4% Black 4%
- Hispanic origin (detail)
- Mexican 10% Puerto Rican 1%
- Common ancestry
- Lithuanian 3% Slovak 3% Italian 3%
- Foreign-born
- 8% · Canada, Vietnam, Jamaica
- Languages at home
- 87% English-only · Spanish 8% Arabic 1% Other Indo-European 1%
Political lean MEDSL · Tarrant
- 2024 margin
- Lean R (+5.1) · D 46.7% · R 51.9% · Other 1.4%
- 2008→2024 swing
- +6.6pp toward D · 2008: -11.7pp · 2024: -5.1pp
- All cycles
- 2024: R+5.1 2020: D+0.2 2016: R+8.7 2012: R+15.7 2008: R+11.7
Not yet ingested
- Civics
- —
Market trends
- HPI YoY
- ▼ -168.20%
- Current HPI
- 277.0162
- Rent YoY
- ▲ 2.23%
- Metro
- Dallas-Fort Worth-Arlington, TX
- State GDP YoY
- ▲ 3.95%
- F500 in state
- 110
Industry mix (Fortune 500 HQ in TX)
| Industry | F500 HQs | Revenue |
|---|---|---|
| Energy | 16 | $1,198B |
|
||
| Technology | 5 | $198B |
|
||
| Engineering / Construction | 4 | $72B |
|
||
| Energy Services | 3 | $60B |
|
||
| Utilities | 3 | $41B |
|
||
| Healthcare | 2 | $330B |
|
||
Price history
+150.0% since first listed8 events — show timeline
- 2026-05-26 Listed $250,000 NTREIS
- 2010-09-30 Sold (Public Records) — Public Records
- 2010-09-28 Sold (MLS) — NTREIS
- 2010-08-30 Listing Removed — NTREIS
- 2010-01-13 Listed $100,000 NTREIS
- 2005-04-01 Sold (Public Records) — Public Records
- 1992-06-05 Sold (Public Records) — Public Records
- 1988-12-02 Sold (Public Records) — Public Records
Property tax history
+2.6%/yrLatest (2025): $4,350 · -15.9% YoY. Source: county tax records.
Cash-flow waterfall
monthlySold comps — $/sqft
last 12 mo · ≤1 miLoading sold comps…