5 & 9 Walnut Dr · Mound City, KS
Flood risk No data
- FEMA flood zone
- —
- Chance of flooding over 30 yrs
- —
- Est. flood insurance / yr
- —
Fire risk No data
- Est. fire insurance / yr
- —
Heat risk No data
- Hot days now (above threshold)
- —
- Hot days in 30 yrs
- —
Wind risk No data
- Chance of severe wind over 30 yrs
- —
Air-quality risk No data
- Unhealthy air days now
- —
- Unhealthy air days in 30 yrs
- —
Risk factors via First Street. Map © Google.
Why this score? — see what drove the B+ grade
The composite is a weighted blend of 9 inputs, each scored 0–100. Each bar is that input's sub-score; the figure is the points it added to the 100-point composite (weight × sub-score).
- Cash flow +30.0/30.0
- DSCR +10.0/10.0
- Appreciation +9.6/10.0
- 1% rule +9.4/10.0
- ARV discount +7.5/15.0
- Livability +3.2/5.0
- Schools +2.6/10.0
- Rent growth +2.5/5.0
- Condition / age +2.5/5.0
$69,900
🖨 Deal sheet (PDF) 📄 Offer letter ✓ Due diligence
Listing remarks MLS
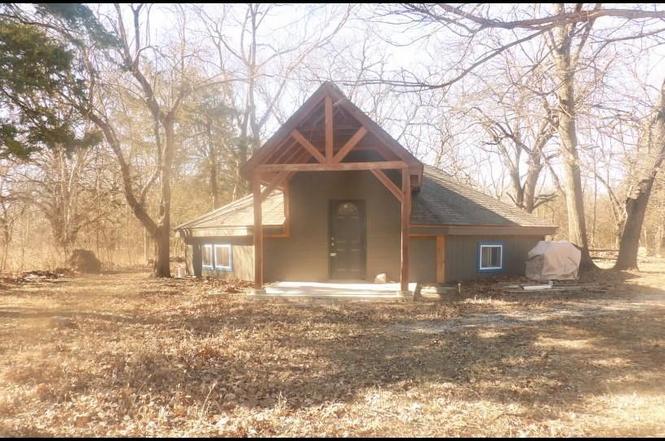
Octagon cabin Sugar Valley Lake, home located on 2 level lots, treed, cabin has electricity & holding tank, interior ready to finish, close to Dam & swimming area yet secluded from traffic. golf, fish & swim, boat.
Key facts
- 0.42 acre lot
- Built 1998
- Listed 150 days
Property features AI
Finance
- Other: Lot size approximately 18,200 square feet
- HOA & community: Homeowners association with an annual fee of $400; No maintenance provided
Exterior
- Parking: Off-street parking
- Utilities: Other water source; Other sewer
- Home design: Single-family residence; Residential property; One-story (above grade living area 1,148)
- Construction: Frame construction; Composition roof; Built approximately 21–30 years ago
- Exterior features: Level lot; Not in a flood plain
Interior
- Bedrooms: 2 bedrooms
- Bathrooms: 1 full bathroom
- Heating & cooling: No heating; No cooling
- Interior features: Slab foundation
Neighborhood map
What this means for you Summary
Snapshot
- This is a 2-bed/1.0-bath single-family listed at $70k.
Deal economics
- At list price, monthly cash flow is $277 ($3k/yr) — positive.
- The deal already cash-flows at list — no discount required.
- Meets the 1% rule at list price ($1k rent vs $70k).
- Recommended offer: $62k (12.0% below list) — sets the bar for market timing.
Location & tenants
- Location reads 63/100 on livability (#339 in KS) — a middle-class / working-renter tenant base. Strengths: cost of living A+, housing A+, health & safety A; Watch: schools D+, crime F, amenities F.
- Jayhawk (rural): math 32% / reading 30% proficiency, ranked #95 of 169 in KS (top 56%) — families likely to look elsewhere, expect single-tenant / working-renter base with shorter leases.
- Market conditions: 53 active listings in the ZIP; 97 units permitted in Linn County in 2024 (0 in 5+ unit buildings).
Forward outlook
- In year one you build about $7k of equity ($483 loan paydown + $6k appreciation (9.2% local appreciation)).
- At projected returns (9.2% appreciation + 3.0% rent growth), your $20k cash investment doubles in ~2 years — after that, you're playing with house money.
- By year 5, paydown + projected appreciation supports a ~$32k cash-out refi (75% LTV) — recoverable capital for the next deal without selling this one.
Negotiation context
- It's been on market 150 days — a 12% lower offer ($62k) is reasonable based on typical stale-listing flexibility.
- 2 sale attempts since 3y ago; this cycle's ask has dropped $9k (11%) from the opening price — seller is motivated, your offer sets the floor, not the list.
Questions for the listing agent
- It's been on market 150 days. Have you received any prior offers? Is the seller open to a 12% concession, seller financing, or rate buy-down credit?
- What does the HOA fee cover, when was the last increase, and are there any pending special assessments or reserve-fund shortfalls?
- Why hasn't it sold? Are there any deal-killer items the seller is aware of (foundation, flood, title, zoning, code violations)?
- Is there a deadline driving the sale (1031 exchange, divorce, estate, relocation)? That informs how much negotiation room exists.
- Schools are D-rated, which usually means shorter tenancies and higher turnover. Who's the typical renter profile here, and what's been the actual vacancy rate?
- Crime grade is F in this area — have there been break-ins, vandalism, or insurance claims at this property in the last 3 years? What carrier currently insures it and at what premium?
- What's the average days-on-market for RENTAL listings here right now (not sales)? A rising rental-DOM trend means longer vacancies and softer asking-rent achievability than the comps imply.
- What's the recent tenant-quality profile in this submarket — average credit score on applications, eviction rate, late-payment / NSF rate, and stable-employment percentage? A property-management company in the area should have these aggregated.
- How much new for-sale + rental construction is in the pipeline within 1–3 miles? Heavy new supply typically softens prices + rents 12–24 months out; constrained supply supports both.
Investment metrics
- 1% rule
- 1.44% ✓
- Cap rate
- 11.04%
- Cash-on-cash
- 16.96%
- DSCR
- 1.75
- GRM
- 5.8
CMA / ARV
- ARV (on-the-fly)
- $285,852
- Comps found
- 4
Show comp detail 4 sales within ~0.75 mi
| Address | Dist | Beds/Ba | Sqft | Sold | Price | $/sf | Match |
|---|---|---|---|---|---|---|---|
| 34 Bobcat Dr | 0.67mi | 2/1.0 | 1,120 (-2%) | 3mo | $237,500 | $212 | 62 |
| 9 Sugar Lake Ter | 0.35mi | 2/2.0 | 1,120 (-2%) | 24mo | $279,000 | $249 | 56 |
| 58 E Sugar Lake Cv | 0.45mi | 2/1.0 | 1,008 (-12%) | 3mo | $299,600 | $297 | 56 |
| 1 Walleye Dr | 0.67mi | 1/2.0 (-1) | 1,196 (+4%) | 23mo | $100,000 | $84 | 34 |
Match score weights: distance 35% · size 25% · config 20% · recency 20%. Top-matched comps best support the ARV.
Projected returns pro-forma
9.18% appreciation · 3.0% rent growth · sell at horizon
- IRR
- 35.4%
- Equity multiple
- 3.65×
- Total profit
- $51,848
- Equity at exit
- $58,849
- IRR
- 30.9%
- Equity multiple
- 8.05×
- Total profit
- $138,058
- Equity at exit
- $122,765
Cash invested: $19,572 (down + closing). Projections, not guarantees.
Landlord ↔ Tenant lean methodology
- Overall (STATE)
- 83 Strongly Landlord-Friendly
- State Kansas
- 83 Strongly Landlord-Friendly · R+10
- County
- — inherits STATE
- City
- — inherits STATE
ZIP-level market 66056
- Home prices YoY
- 2.4%
- Active inventory
- 53
- Price-to-rent
- 5.8×
Monthly cashflow live
- Estimated rent
- $1,003 medium interval (Pro) →
- Mortgage (P&I)
- −$367
- Tax est. 1.5%
- −$87 /mo · $1,048/yr
- Insurance
- −$29
- HOA
- −$33
- Vacancy / Maint / Mgmt
- −$211
- Net cashflow
- $277
Break-even live
Sensitivity live
| Price | -10% $325 | -5% $301 | +0% $277 | +5% $252 | +10% $228 |
|---|---|---|---|---|---|
| Rent | -10% $197 | -5% $237 | +0% $277 | +5% $316 | +10% $356 |
| Rate | -1.0pp $312 | -0.5pp $294 | base $277 | +0.5pp $259 | +1.0pp $240 |
UW: 25.0% down · 7.5% · 30yr · 1.5% tax · 5.0% vac · 8.0% maint · 8.0% mgmt
Financing live
Cash to close
- Down payment
- $17,475
- Closing costs
- $2,097
- Reserves months
- —
- Total cash needed
- —
Loan-product check · same deal, 3 products live
Conventional
25% down · 7.5% · 30yr
- Down + closing
- —
- Monthly P&I
- —
- Monthly cashflow
- —
- DSCR
- —
- Eligible?
- —
Personal DTI + credit; lowest rate.
DSCR
20% down · 8.5% · 30yr
- Down + closing
- —
- Monthly P&I
- —
- Monthly cashflow
- —
- DSCR
- —
- Eligible?
- —
No personal income docs; deal must DSCR.
Hard money
10% down · 12.0% · 12mo
- Down + closing
- —
- Monthly P&I
- —
- Monthly cashflow
- —
- DSCR
- —
- Eligible?
- —
Short-term bridge; refi at stabilization.
HOA detail
- Monthly dues
- $33 · $396/yr
- Likely covers
- electric
Listing history 23 events
-
2026-06-21days on market $69,900 Active 150 DOM
-
2026-06-18days on market $69,900 Active 148 DOM
-
2026-06-17days on market $69,900 Active 147 DOM
-
2026-06-16days on market $69,900 Active 146 DOM
-
2026-06-15days on market $69,900 Active 145 DOM
-
2026-06-13days on market $69,900 Active 143 DOM
-
2026-06-12days on market $69,900 Active 142 DOM
-
2026-06-09days on market $69,900 Active 139 DOM
-
2026-06-08days on market $69,900 Active 138 DOM
-
2026-06-07days on market $69,900 Active 137 DOM
-
2026-06-05days on market $69,900 Active 135 DOM
-
2026-06-04days on market $69,900 Active 133 DOM
-
2026-06-02days on market $69,900 Active 132 DOM
-
2026-06-01days on market $69,900 Active 131 DOM
-
2026-05-31days on market $69,900 Active 130 DOM
-
2026-05-31days on market $69,900 Active 129 DOM
-
2026-03-20price $69,900
-
2026-01-21$78,900 Active
-
2023-07-24soldstatus Closed 233-char remark
Show marketing remark (233 chars)
Octagon cabin Sugar Valley Lake, home located on 2 level lots, treed, cabin has electricity & holding tank, interior ready to finish, close to Dam & swimming area yet secluded from traffic. golf, fish & swim, boat.
-
2023-07-17status Pending 233-char remark
Show marketing remark (233 chars)
Octagon cabin Sugar Valley Lake, home located on 2 level lots, treed, cabin has electricity & holding tank, interior ready to finish, close to Dam & swimming area yet secluded from traffic. golf, fish & swim, boat.
-
2023-06-29price $59,900 233-char remark
Show marketing remark (233 chars)
Octagon cabin Sugar Valley Lake, home located on 2 level lots, treed, cabin has electricity & holding tank, interior ready to finish, close to Dam & swimming area yet secluded from traffic. golf, fish & swim, boat.
-
2023-06-13$69,900 Active 233-char remark
Show marketing remark (233 chars)
Octagon cabin Sugar Valley Lake, home located on 2 level lots, treed, cabin has electricity & holding tank, interior ready to finish, close to Dam & swimming area yet secluded from traffic. golf, fish & swim, boat.
-
1997-05-01soldstatus
ⓘ Source: listings_history table (triggers on properties + properties_extension) + one-shot
backfill from property_details.listing_events for pre-trigger history.
Nearby sold comps map
Loading sold comps map…
Walkable amenities ~0.75 mi
Loading nearby amenities…
Taxation est. · year 1
- Rental income
- $12,041
- − Mortgage interest
- −$3,915
- − Property taxes
- −$1,048
- − Insurance
- −$350
- − Repairs & maintenance
- −$963
- − Management
- −$963
- − HOA
- −$396
- − Depreciation
- −$2,033
- Taxable income
- $2,371
- Est. tax owed @ 24.0%
- −$569
- After-tax cash flow
- $2,750/yr
For passive investors: Depreciation is non-cash, so a rental often shows a tax loss while cash-flowing — sheltering income. Rental losses are passive: they offset passive income freely, and up to $25,000/yr can offset ordinary (W-2) income if you actively participate and your MAGI is under $100k (phasing out to $0 by $150k); unused losses carry forward. On sale, claimed depreciation is recaptured at up to 25%, and gains may owe capital-gains tax (a 1031 exchange can defer both). Figures are a year-1 estimate at your 24.0% rate — not tax advice; consult a CPA.
Schools (NCES district)
- District
- Jayhawk
- NCES district ID
- 2007750
- Math proficiency
- 32% ▬ 0.00%
- Reading proficiency
- 30% ▼ -3.00%
- Median HH income
- $42,226
- Composite
- 26.3/100
- National rank
- #7244
- State rank
- #95 of 169 in KS
Livability — Mound City
- Score
- 63/100
- State rank
- #339
- US rank
- #15276
Category grades
Schools grade is shown separately in the Schools card above.
Census & demographics
- Population (ZIP)
- 1,428
Population outlook (Linn County) Hauer SSP2
- Today (2025)
- 9,581 people
- By 2030
- 9,574 · -0.1%
- By 2040
- 9,550 · -0.3%
- By 2050
- 9,483 · -1.0%
- By 2075
- 9,510 · -0.7%
- By 2100
- 8,873 · -7.4%
Race, ethnicity, and origin ACS 2023
- Neighborhood character
- Predominantly White (92%)
- Race & ethnicity
- White 92% Two or more races 3% Hispanic / Latino 2%
- Common ancestry
- Italian 5% Lithuanian 3% Slovak 1%
- Languages at home
- 99% English-only · Spanish 1%
Political lean MEDSL · Linn
- 2024 margin
- Solid R (+64.6) · D 17.0% · R 81.6% · Other 1.4%
- 2008→2024 swing
- -28.6pp toward R · 2008: -36.0pp · 2024: -64.6pp
- All cycles
- 2024: R+64.6 2020: R+62.8 2016: R+62.1 2012: R+45.9 2008: R+36.0
Not yet ingested
- Civics
- —
Market trends
- HPI YoY
- ▲ 9.18%
- Current HPI
- 397.2471
- Rent YoY
- —
- Metro
- —
- State GDP YoY
- —
- F500 in state
- 0
Price history
+0.0% since first listed7 events — show timeline
- 2026-03-20 Price Changed $69,900 Heartland MLS as Distributed by MLS Grid
- 2026-01-21 Listed $78,900 Heartland MLS as Distributed by MLS Grid
- 2023-07-24 Sold (MLS) — Heartland MLS as Distributed by MLS Grid
- 2023-07-17 Pending — Heartland MLS as Distributed by MLS Grid
- 2023-06-29 Price Changed $59,900 Heartland MLS as Distributed by MLS Grid
- 2023-06-13 Listed $69,900 Heartland MLS as Distributed by MLS Grid
- 1997-05-01 Sold (Public Records) — Public Records
Cash-flow waterfall
monthlySold comps — $/sqft
last 12 mo · ≤1 miLoading sold comps…