 🏷️ Likely Rental
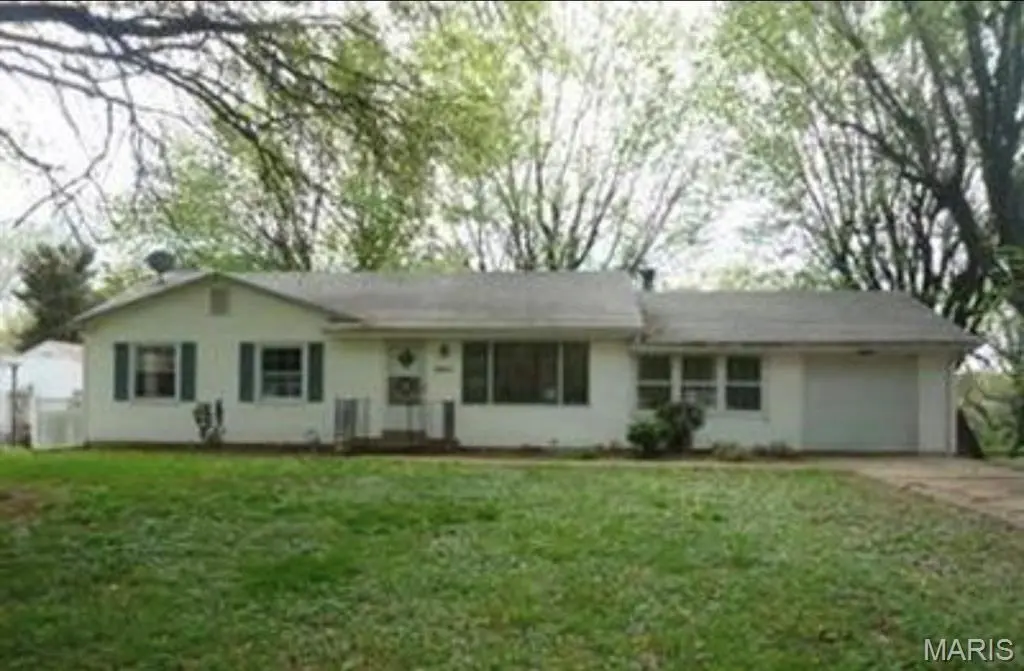
12511 Hillview Dr · Spanish Lake, MO
Flood risk 1/10 · Minimal
- FEMA flood zone
- X (unshaded)
- Chance of flooding over 30 yrs
- 0.0%
- Est. flood insurance / yr
- $473 – $860
Fire risk 1/10 · Minimal
- Est. fire insurance / yr
- $1,054 – $1,958
Heat risk 5/10 · Moderate
- Hot days now (above 107°F)
- 7 days/yr
- Hot days in 30 yrs
- 20 days/yr
Wind risk 2/10 · Minimal
- Chance of severe wind over 30 yrs
- 1.0%
Air-quality risk 4/10 · Minor
- Unhealthy air days now
- 4 days/yr
- Unhealthy air days in 30 yrs
- 5 days/yr
Risk factors via First Street. Map © Google.
Why this score? — see what drove the C- grade
The composite is a weighted blend of 9 inputs, each scored 0–100. Each bar is that input's sub-score; the figure is the points it added to the 100-point composite (weight × sub-score).
- Cash flow +16.6/30.0
- ARV discount +15.0/15.0
- DSCR +5.2/10.0
- 1% rule +4.5/10.0
- Livability +2.6/5.0
- Condition / age +2.5/5.0
- Rent growth +2.1/5.0
- Schools +1.7/10.0
- Appreciation +0.0/10.0
$155,000
🖨 Deal sheet 📄 Offer letter ✓ Due diligence
Listing remarks MLS
Investor ready! Tenant occupied property for sale. 3 bedroom 2 bath ranch home. Great investment property already generating income. No showings without accepted contract.
Key facts
- 0.46 acre lot
- Garage
- Built 1954
Neighborhood map
What this means for you Summary
Snapshot
- This is a 3-bed/2.0-bath single-family listed at $155k.
Deal economics
- At list price, monthly cash flow is $95 ($1k/yr) — positive.
- The deal already cash-flows at list — no discount required.
- To meet the 1% rule (rent ≥ 1% of price), the offer needs to be $148k (4.8% below list).
- Recommended offer: $146k (6.0% below list) — sets the bar for market timing.
Location & tenants
- Location reads 51/100 on livability (#870 in MO) — a working-class tenant base; expect higher turnover. Strengths: cost of living A+, housing A+; Watch: schools F, crime F, amenities F.
- Hazelwood (suburban): math 11% / reading 26% proficiency, ranked #306 of 324 in MO (top 94%) — low school quality limits family demand, transient renter base, plan for 1-2y turnover.
- Market conditions: Rents soft (-1.5%/yr); 101 active listings in the ZIP; 16 comparable units currently listed for rent nearby; rentals at typical pace (median 24d on market — plan ~3-4 weeks tenant-placement turnaround); 44% of comp listings sitting > 30 days — soft ceiling on asking rent; 920 units permitted in St. Louis County in 2024 (250 in 5+ unit buildings).
- This rent runs 32% of the median local income ($56k/yr) — at the standard rent-burdened threshold; future hikes will face affordability resistance.
Forward outlook
- Local home prices are declining (-3.0%/yr); year-one equity from $1k of loan paydown is wiped out by about $5k of value loss. Plan a longer hold.
Negotiation context
- It's been on market 70 days — a 6% lower offer ($146k) is reasonable based on typical stale-listing flexibility.
- 3 sale attempts since 11y ago with the ask held roughly flat each time — persistent listings suggest the price (not the market) is what's stuck; bring a comps-based counter.
- Current owner paid $120k; 29% above their basis — modest negotiation headroom, anchor on the comps not their cost.
Risks & watch-outs
- Watch-outs: built in 1954 — expect roof / HVAC / electrical / plumbing capex.
- Climate carrying-cost: extreme-heat days projected 7→20/yr by 2055 (HVAC capex compounding) — expect insurance premiums to compound above CPI over the hold.
Questions for the listing agent
- It's been on market 70 days. Have you received any prior offers? Is the seller open to a 6% concession, seller financing, or rate buy-down credit?
- Built in 1954 — when were the roof, HVAC, electrical panel, plumbing, and water heater last replaced?
- Why hasn't it sold? Are there any deal-killer items the seller is aware of (foundation, flood, title, zoning, code violations)?
- Is there a deadline driving the sale (1031 exchange, divorce, estate, relocation)? That informs how much negotiation room exists.
- Schools are F-rated, which usually means shorter tenancies and higher turnover. Who's the typical renter profile here, and what's been the actual vacancy rate?
- Crime grade is F in this area — have there been break-ins, vandalism, or insurance claims at this property in the last 3 years? What carrier currently insures it and at what premium?
- What's the average days-on-market for RENTAL listings here right now (not sales)? A rising rental-DOM trend means longer vacancies and softer asking-rent achievability than the comps imply.
- What's the recent tenant-quality profile in this submarket — average credit score on applications, eviction rate, late-payment / NSF rate, and stable-employment percentage? A property-management company in the area should have these aggregated.
- How much new for-sale + rental construction is in the pipeline within 1–3 miles? Heavy new supply typically softens prices + rents 12–24 months out; constrained supply supports both.
Investment metrics
- 1% rule
- 0.95% ✗
- Cap rate
- 7.03%
- Cash-on-cash
- 2.63%
- DSCR
- 1.12
- GRM
- 8.8
CMA / ARV
- ARV (median comp)
- $205,989
- List price
- $155,000
- Delta
- -24.75%
- Verdict
- UNDERPRICED
- Comps
- 20 within 1.0 mi
Show comp detail 12 sales within ~0.75 mi
| Address | Dist | Beds/Ba | Sqft | Sold | Price | $/sf | Match |
|---|---|---|---|---|---|---|---|
| 1618 Clock Tower Dr | 0.38mi | 3/2.0 | 1,600 (+5%) | 7mo | $248,900 | $156 | 68 |
| 12654 Treeyard Ln | 0.24mi | 3/2.5 | 1,676 (+10%) | 9mo | $139,000 | $83 | 62 |
| 1421 San Salvador Dr | 0.48mi | 4/2.0 (+1) | 1,505 (-1%) | 13mo | $144,900 | $96 | 60 |
| 12361 Santa Maria Dr | 0.50mi | 3/2.0 | 1,656 (+9%) | 4mo | $135,000 | $82 | 58 |
| 13057 Lakeridge Dr | 0.28mi | 3/1.0 | 1,314 (-14%) | 6mo | $170,000 | $129 | 55 |
| 12336 Lusher Rd | 0.70mi | 2/1.0 (-1) | 1,548 (+2%) | 2mo | $189,900 | $123 | 54 |
| 1772 Meadowdale Dr | 0.36mi | 3/2.0 | 1,676 (+10%) | 16mo | $234,900 | $140 | 54 |
| 13091 E Lakeridge Dr | 0.34mi | 4/2.5 (+1) | 1,313 (-14%) | 2mo | $75,000 | $57 | 53 |
| 1737 Parker Rd | 0.51mi | 3/1.5 | 1,466 (-4%) | 21mo | $129,900 | $89 | 51 |
| 12702 Meadowdale Dr | 0.45mi | 3/2.0 | 1,676 (+10%) | 18mo | $214,900 | $128 | 47 |
| 1767 Edgebriar Ln | 0.43mi | 4/2.5 (+1) | 1,443 (-5%) | 22mo | $214,900 | $149 | 46 |
| 17 Nob Hill Dr | 0.63mi | 3/2.0 | 1,317 (-13%) | 5mo | $230,000 | $175 | 44 |
Match score weights: distance 35% · size 25% · config 20% · recency 20%. Top-matched comps best support the ARV.
Projected returns pro-forma
-3.0% appreciation · 0.0% rent growth · sell at horizon
- IRR
- -15.6%
- Equity multiple
- 0.46×
- Total profit
- $-23,369
- Equity at exit
- $23,111
- IRR
- -13.3%
- Equity multiple
- 0.33×
- Total profit
- $-29,182
- Equity at exit
- $13,402
Cash invested: $43,400 (down + closing). Projections, not guarantees.
Landlord ↔ Tenant lean methodology
- Overall (STATE)
- 81 Strongly Landlord-Friendly
- State Missouri
- 81 Strongly Landlord-Friendly · R+10
- County
- — inherits STATE
- City
- — inherits STATE
ZIP-level market 63138
- Home prices YoY
- -31.0%
- Rents YoY
- -1.5%
- Active inventory
- 101
- Price-to-rent
- 8.8×
Monthly cashflow live
- Estimated rent
- $1,476 high interval (Pro) →
- Mortgage (P&I)
- −$813
- Tax from tax record
- −$193 /mo · $2,319/yr
- Insurance
- −$65
- HOA
- −$0
- Vacancy / Maint / Mgmt
- −$310
- Net cashflow
- $95
Break-even live
UW: 25.0% down · 7.5% · 30yr · 1.5% tax · 5.0% vac · 8.0% maint · 8.0% mgmt
Financing live
Cash to close
- Down payment
- $38,750
- Closing costs
- $4,650
- Reserves months
- —
- Total cash needed
- —
Loan-product check · same deal, 3 products live
Conventional
25% down · 7.5% · 30yr
- Down + closing
- —
- Monthly P&I
- —
- Monthly cashflow
- —
- DSCR
- —
- Eligible?
- —
Personal DTI + credit; lowest rate.
DSCR
20% down · 8.5% · 30yr
- Down + closing
- —
- Monthly P&I
- —
- Monthly cashflow
- —
- DSCR
- —
- Eligible?
- —
No personal income docs; deal must DSCR.
Hard money
10% down · 12.0% · 12mo
- Down + closing
- —
- Monthly P&I
- —
- Monthly cashflow
- —
- DSCR
- —
- Eligible?
- —
Short-term bridge; refi at stabilization.
Rent comps 16 comps
| Address | Beds | Baths | Sqft | Rent | $/sqft | DOM | Units | Dist |
|---|---|---|---|---|---|---|---|---|
| 12035 Krenning Ln Saint Louis, MO | 3.0 | 1.0 | 1170 | $1,125 | $0.96 | 23d | 1 | 0.76mi |
| 12303 Benham Rd Saint Louis, MO | 4.0 | 2.0 | 1845 | $1,771 | $0.96 | 17d | 1 | 0.82mi |
| 1708 San Remo Ct St. Louis, MO | 1.0–3.0 | 1.0–1.5 | 1053 | $1,300 | $1.23 | 1d | 9 | 0.85mi |
| 1510 Trampe Ave Saint Louis, MO | 4.0 | 2.0 | 1581 | $1,600 | $1.01 | 1d | 1 | 0.88mi |
| 11969 Continental Dr St. Louis, MO | 2.0–3.0 | 1.5 | 1075 | $1,325 | $1.23 | 1d | 3 | 1.06mi |
| 1386 Fairmeadows Ln Saint Louis, MO | 3.0 | 1.0 | 1512 | $1,250 | $0.83 | 43d | 1 | 1.06mi |
| 1516 Farmview Ave Saint Louis, MO | 3.0 | 1.5 | 1156 | $1,295 | $1.12 | 43d | 1 | 1.08mi |
| 12887 Fox Haven Dr Florissant, MO | 3.0 | 2.0 | 1135 | $1,750 | $1.54 | 43d | 1 | 1.12mi |
| 1459 Redman Blvd Saint Louis, MO | 4.0 | 1.5 | 1150 | $1,550 | $1.35 | 20d | 1 | 1.12mi |
| 1202 Laredo Ave Saint Louis, MO | 3.0 | 2.0 | 1152 | $1,450 | $1.26 | 16d | 1 | 1.25mi |
| 1209 Redman Blvd Saint Louis, MO | 4.0 | 1.0 | 1535 | $1,295 | $0.84 | 43d | 1 | 1.31mi |
| 12810 Verwood Dr Florissant, MO | 3.0 | 2.0 | 1408 | $2,026 | $1.44 | 43d | 1 | 1.34mi |
| 11921 Larimore Rd Saint Louis, MO | 3.0 | 1.0 | 1078 | $1,100 | $1.02 | 43d | 1 | 1.35mi |
| 11726 Criterion Ave Saint Louis, MO | 3.0 | 2.0 | 1205 | $1,420 | $1.18 | 23d | 1 | 1.39mi |
| 1132 Redman Blvd Saint Louis, MO | 4.0 | 1.0 | 1080 | $1,195 | $1.11 | 43d | 1 | 1.39mi |
| 1911 Redman Rd Saint Louis, MO | 3.0 | 1.0 | 1454 | $1,495 | $1.03 | 2d | 1 | 1.44mi |
Listing history 27 events
-
2026-06-18days on market $155,000 Active 70 DOM
-
2026-06-17days on market $155,000 Active 69 DOM
-
2026-06-16days on market $155,000 Active 68 DOM
-
2026-06-15days on market $155,000 Active 67 DOM
-
2026-06-13days on market $155,000 Active 65 DOM
-
2026-06-13days on market $155,000 Active 64 DOM
-
2026-06-09days on market $155,000 Active 61 DOM
-
2026-06-08days on market $155,000 Active 60 DOM
-
2026-06-07days on market $155,000 Active 59 DOM
-
2026-06-05days on market $155,000 Active 56 DOM
-
2026-06-03days on market $155,000 Active 55 DOM
-
2026-06-02days on market $155,000 Active 54 DOM
-
2026-06-01days on market $155,000 Active 53 DOM
-
2026-05-31days on market $155,000 Active 52 DOM
-
2026-04-10$155,000 Active 171-char remark
Show marketing remark (171 chars)
Investor ready! Tenant occupied property for sale. 3 bedroom 2 bath ranch home. Great investment property already generating income. No showings without accepted contract.
-
2026-04-08historical $155,000 171-char remark
Show marketing remark (171 chars)
Investor ready! Tenant occupied property for sale. 3 bedroom 2 bath ranch home. Great investment property already generating income. No showings without accepted contract.
-
2024-12-29historical
-
2021-06-08soldstatus $120,000
-
2021-06-04soldstatus Closed
-
2021-05-10historical Active Under Contract
-
2021-04-05price $128,000
-
2021-03-10$131,000 Active
-
2016-01-13soldstatus $102,150
-
2015-06-18soldstatus Closed
-
2015-05-21historical
-
2015-04-25$49,900 Active
-
2002-06-07soldstatus $94,900
ⓘ Source: listings_history table (triggers on properties + properties_extension) + one-shot
backfill from property_details.listing_events for pre-trigger history.
Tax reassessment forecast MO · Resets to sale price
- Current annual tax
- $2,319 · $193/mo
- Projected year-2 tax
- $2,319 · $193/mo
- Expected delta
- $0/yr ($0/mo · 0.0%)
ⓘ Screening estimate from a state-policy table — verify with the county assessor before closing.
Climate risk First Street
- Flood 1/10 Low FEMA zone X (unshaded) · 0% chance over 30 yrs
- Wildfire 1/10 Low
- Heat 5/10 Major 7 d/yr ≥107°F today · 20 d/yr by 30 yrs out
- Wind 2/10 Low 100% chance of damaging wind over 30 yrs
- Air quality 4/10 Moderate 4 unhealthy d/yr today · 5 by 30 yrs out
Nearby sold comps map
Loading sold comps map…
Walkable amenities ~0.75 mi
Loading nearby amenities…
Taxation est. · year 1
- Rental income
- $17,706
- − Mortgage interest
- −$8,682
- − Property taxes
- −$2,319
- − Insurance
- −$775
- − Repairs & maintenance
- −$1,417
- − Management
- −$1,417
- − Depreciation
- −$4,509
- Taxable loss
- −$1,412
- Est. tax savings @ 24.0%
- +$339
- After-tax cash flow
- $1,479/yr
For passive investors: Depreciation is non-cash, so a rental often shows a tax loss while cash-flowing — sheltering income. Rental losses are passive: they offset passive income freely, and up to $25,000/yr can offset ordinary (W-2) income if you actively participate and your MAGI is under $100k (phasing out to $0 by $150k); unused losses carry forward. On sale, claimed depreciation is recaptured at up to 25%, and gains may owe capital-gains tax (a 1031 exchange can defer both). Figures are a year-1 estimate at your 24.0% rate — not tax advice; consult a CPA.
Schools (NCES district)
- District
- Hazelwood
- NCES district ID
- 2913830
- Math proficiency
- 11% ▼ -13.00%
- Reading proficiency
- 26% ▼ -6.00%
- Median HH income
- $51,621
- Composite
- 16.77/100
- National rank
- #9156
- State rank
- #306 of 324 in MO
Livability — Spanish Lake
- Score
- 51/100
- State rank
- #870
- US rank
- #25189
Category grades
Schools grade is shown separately in the Schools card above.
Census & demographics
- Census place
- Spanish Lake, MO
- County
- Saint Louis County · 888,823 people
- City population
- 18,233
- Metro
- St. Louis, MO-IL
- Population (ZIP)
- 18,233
- Household income
- $56,096
- Rent vs Own
- Severe rent burden
- 925.0
Population outlook (St. Louis County) Hauer SSP2
- Today (2025)
- 1,025,227 people
- By 2030
- 1,028,023 · +0.3%
- By 2040
- 1,020,940 · -0.4%
- By 2050
- 1,007,280 · -1.8%
- By 2075
- 987,277 · -3.7%
- By 2100
- 921,984 · -10.1%
Race, ethnicity, and origin ACS 2023
- Neighborhood character
- Predominantly Black (81%)
- Race & ethnicity
- Black 81% White 14% Two or more races 4% Hispanic / Latino 1%
- Foreign-born
- 2% · Canada
- Languages at home
- 98% English-only · Spanish 1%
Political lean MEDSL · St. Louis
- 2024 margin
- Strong D (+23.4) · D 60.8% · R 37.4% · Other 1.7%
- 2008→2024 swing
- +3.5pp toward D · 2008: 19.9pp · 2024: 23.4pp
- All cycles
- 2024: D+23.4 2020: D+24.0 2016: D+16.2 2012: D+13.7 2008: D+19.9
Not yet ingested
- Civics
- —
Market trends
- HPI YoY
- ▼ -74.09%
- Current HPI
- 165.2146
- Rent YoY
- ▼ -1.54%
- Metro
- St. Louis, MO-IL
- State GDP YoY
- ▲ 1.84%
- F500 in state
- 20
Industry mix (Fortune 500 HQ in MO)
| Industry | F500 HQs | Revenue |
|---|---|---|
| Healthcare | 1 | $163B |
|
||
| Insurance | 1 | $21B |
|
||
| Industrial Technology | 1 | $17B |
|
||
| Retail | 1 | $16B |
|
||
| Industrial Distribution | 1 | $10B |
|
||
| Utilities | 1 | $9B |
|
||
Price history
+63.3% since first listed13 events — show timeline
- 2026-04-10 Listed $155,000 MARIS as Distributed by MLS Grid
- 2026-04-08 Coming Soon $155,000 MARIS as Distributed by MLS Grid
- 2024-12-29 Delisted — MARIS as Distributed by MLS Grid
- 2021-06-08 Sold (Public Records) $120,000 Public Records
- 2021-06-04 Sold (MLS) — MARIS as Distributed by MLS Grid
- 2021-05-10 Contingent — MARIS as Distributed by MLS Grid
- 2021-04-05 Price Changed $128,000 MARIS as Distributed by MLS Grid
- 2021-03-10 Listed $131,000 MARIS as Distributed by MLS Grid
- 2016-01-13 Sold (Public Records) $102,150 Public Records
- 2015-06-18 Sold (MLS) — MARIS as Distributed by MLS Grid
- 2015-05-21 Delisted — MARIS as Distributed by MLS Grid
- 2015-04-25 Listed $49,900 MARIS as Distributed by MLS Grid
- 2002-06-07 Sold (Public Records) $94,900 Public Records
Property tax history
-1.1%/yrLatest (2022): $2,319 · +1.5% YoY. Source: county tax records.
Cash-flow waterfall
monthlySold comps — $/sqft
last 12 mo · ≤1 miLoading sold comps…