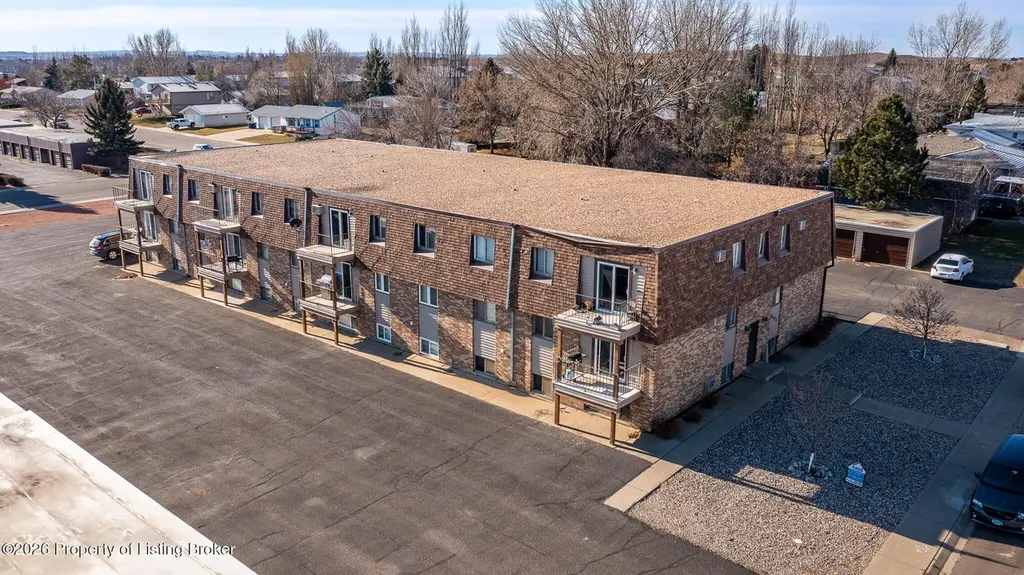
671 24th St W · Dickinson, ND
Flood risk No data
- FEMA flood zone
- —
- Chance of flooding over 30 yrs
- —
- Est. flood insurance / yr
- —
Fire risk No data
- Est. fire insurance / yr
- —
Heat risk No data
- Hot days now (above threshold)
- —
- Hot days in 30 yrs
- —
Wind risk No data
- Chance of severe wind over 30 yrs
- —
Air-quality risk No data
- Unhealthy air days now
- —
- Unhealthy air days in 30 yrs
- —
Risk factors via First Street. Map © Google.
Why this score? — see what drove the B+ grade
The composite is a weighted blend of 9 inputs, each scored 0–100. Each bar is that input's sub-score; the figure is the points it added to the 100-point composite (weight × sub-score).
- Cash flow +30.0/30.0
- ARV discount +14.1/15.0
- 1% rule +10.0/10.0
- DSCR +10.0/10.0
- Livability +3.8/5.0
- Schools +3.5/10.0
- Rent growth +3.0/5.0
- Condition / age +2.2/5.0
- Appreciation +0.0/10.0
$64,900
🖨 Deal sheet (PDF) 📄 Offer letter ✓ Due diligence
Listing remarks MLS
G R E A T B U Y! Come on over and take a look at this great investment. Two bedrooms, 1 bath, condo living. Call to take a look today.
Key facts
- Walk-in closet
- Private patio
- Generous dining area
Tags
Property features AI
Finance
- Financial info: Annual tax: $808.82
Exterior
- Parking: 1-car garage
- Utilities: Public sewer
- Home design: Condominium (residential)
- Exterior features: Common area lot
Interior
- Bathrooms: 1 full bathroom
- Heating & cooling: Baseboard heating; Has cooling
- Interior features: 6 total rooms
Neighborhood map
What this means for you Summary
Snapshot
- This is a 2-bed/1.0-bath single-family listed at $65k. Condition is rated fair.
Deal economics
- At list price, monthly cash flow is $492 ($6k/yr) — positive.
- The deal already cash-flows at list — no discount required.
- Meets the 1% rule at list price ($1k rent vs $65k).
- Recommended offer: $63k (3.0% below list) — sets the bar for market timing.
- Cap rate 15.4% vs local median 2.9% in Dickinson — top-decile yield for the area; either an underpriced asset or a hidden risk that comps aren't pricing in. Stress-test before assuming the spread holds.
Location & tenants
- Location reads 76/100 on livability (#12 in ND, #3,334 nationally) — a middle-class / working-renter tenant base. Strengths: cost of living A+, housing A+, health & safety A+; Watch: amenities F, commute F.
- Dickinson 1 (town): math 35% / reading 43% proficiency, ranked #29 of 53 in ND (top 55%) — families likely to look elsewhere, expect single-tenant / working-renter base with shorter leases.
- Zoned schools: Dickinson Middle School (math 36% / reading 50%, grade D-, #17 of 35 statewide, top 47%, 842 students, 28% FRL).
- Market conditions: Rents rising (+1.9%/yr); 236 active listings in the ZIP; solid renter incomes; 20 units permitted in Stark County in 2024 (0 in 5+ unit buildings).
- This rent is only 17% of the median local income ($86k/yr) — well below the 30% rent-burden line; pricing power to push rent on renewal without tenant pushback.
Forward outlook
- Local home prices are declining (-3.0%/yr); year-one equity from $449 of loan paydown is wiped out by about $2k of value loss. Plan a longer hold.
- Stark County population projected at +120% by 2050 — long-run rental-demand tailwind backs the buy-and-hold thesis.
- At projected returns (-3.0% appreciation + 1.9% rent growth), your $18k cash investment doubles in ~4 years — after that, you're playing with house money.
Negotiation context
- It's been on market 57 days — a 3% lower offer ($63k) is reasonable based on typical stale-listing flexibility.
- 22 sale attempts since 14y ago with the ask held roughly flat each time — persistent listings suggest the price (not the market) is what's stuck; bring a comps-based counter.
Questions for the listing agent
- It's been on market 57 days. Have you received any prior offers? Is the seller open to a 3% concession, seller financing, or rate buy-down credit?
- Have any recent inspections been done? Can we get a copy of the seller's disclosures and any deferred-maintenance estimates?
- Built in 1978 — when were the roof, HVAC, electrical panel, plumbing, and water heater last replaced?
- Is there a deadline driving the sale (1031 exchange, divorce, estate, relocation)? That informs how much negotiation room exists.
- Schools are B-rated — typically a magnet for longer-tenancy family renters. What's the average tenant stay here, and is there a school-zone premium baked into asking?
- What's the average days-on-market for RENTAL listings here right now (not sales)? A rising rental-DOM trend means longer vacancies and softer asking-rent achievability than the comps imply.
- What's the recent tenant-quality profile in this submarket — average credit score on applications, eviction rate, late-payment / NSF rate, and stable-employment percentage? A property-management company in the area should have these aggregated.
- How much new for-sale + rental construction is in the pipeline within 1–3 miles? Heavy new supply typically softens prices + rents 12–24 months out; constrained supply supports both.
Investment metrics
- 1% rule
- 1.83% ✓
- Cap rate
- 15.39%
- Cash-on-cash
- 32.50%
- DSCR
- 2.45
- GRM
- 4.5
CMA / ARV
- ARV (on-the-fly)
- $76,024
- Comps found
- 1
Show comp detail 1 sale within ~0.75 mi
| Address | Dist | Beds/Ba | Sqft | Sold | Price | $/sf | Match |
|---|---|---|---|---|---|---|---|
| 665 23rd Street West #13 St | 0.06mi | 2/1.0 | 816 (-8%) | 12mo | $70,000 | $86 | 75 |
Match score weights: distance 35% · size 25% · config 20% · recency 20%. Top-matched comps best support the ARV.
Projected returns pro-forma
-3.0% appreciation · 1.95% rent growth · sell at horizon
- IRR
- 26.4%
- Equity multiple
- 2.08×
- Total profit
- $19,598
- Equity at exit
- $9,677
- IRR
- 33.4%
- Equity multiple
- 3.89×
- Total profit
- $52,494
- Equity at exit
- $5,611
Cash invested: $18,172 (down + closing). Projections, not guarantees.
Landlord ↔ Tenant lean methodology
- Overall (STATE)
- 82 Strongly Landlord-Friendly
- State North Dakota
- 82 Strongly Landlord-Friendly · R+20
- County
- — inherits STATE
- City
- — inherits STATE
ZIP-level market 58601
- Rents YoY
- 1.9%
- Active inventory
- 236
- Price-to-rent
- 4.5×
Monthly cashflow live
- Estimated rent
- $1,191 medium interval (Pro) →
- Mortgage (P&I)
- −$340
- Tax est. 1.5%
- −$81 /mo · $974/yr
- Insurance
- −$27
- HOA
- −$0
- Vacancy / Maint / Mgmt
- −$250
- Net cashflow
- $492
Break-even live
Sensitivity live
| Price | -10% $537 | -5% $515 | +0% $492 | +5% $470 | +10% $447 |
|---|---|---|---|---|---|
| Rent | -10% $398 | -5% $445 | +0% $492 | +5% $539 | +10% $586 |
| Rate | -1.0pp $525 | -0.5pp $509 | base $492 | +0.5pp $475 | +1.0pp $458 |
UW: 25.0% down · 7.5% · 30yr · 1.5% tax · 5.0% vac · 8.0% maint · 8.0% mgmt
Financing live
Cash to close
- Down payment
- $16,225
- Closing costs
- $1,947
- Reserves months
- —
- Total cash needed
- —
Loan-product check · same deal, 3 products live
Conventional
25% down · 7.5% · 30yr
- Down + closing
- —
- Monthly P&I
- —
- Monthly cashflow
- —
- DSCR
- —
- Eligible?
- —
Personal DTI + credit; lowest rate.
DSCR
20% down · 8.5% · 30yr
- Down + closing
- —
- Monthly P&I
- —
- Monthly cashflow
- —
- DSCR
- —
- Eligible?
- —
No personal income docs; deal must DSCR.
Hard money
10% down · 12.0% · 12mo
- Down + closing
- —
- Monthly P&I
- —
- Monthly cashflow
- —
- DSCR
- —
- Eligible?
- —
Short-term bridge; refi at stabilization.
Listing history 50 events
-
2026-06-21days on market $64,900 Active 57 DOM
-
2026-06-19days on market $64,900 Active 55 DOM
-
2026-06-18days on market $64,900 Active 54 DOM
-
2026-06-17days on market $64,900 Active 53 DOM
-
2026-06-16days on market $64,900 Active 52 DOM
-
2026-06-15days on market $64,900 Active 51 DOM
-
2026-06-14days on market $64,900 Active 49 DOM
-
2026-06-12days on market $64,900 Active 48 DOM
-
2026-06-09days on market $64,900 Active 45 DOM
-
2026-06-08days on market $64,900 Active 44 DOM
-
2026-06-07days on market $64,900 Active 43 DOM
-
2026-06-05days on market $64,900 Active 40 DOM
-
2026-06-03days on market $64,900 Active 39 DOM
-
2026-06-02days on market $64,900 Active 38 DOM
-
2026-06-01days on market $64,900 Active 37 DOM
-
2026-05-31days on market $64,900 Active 36 DOM
-
2026-05-30days on market $64,900 Active 35 DOM
-
2026-04-26$64,900 Active
-
2026-04-21price $67,000 134-char remark
Show marketing remark (134 chars)
G R E A T B U Y! Come on over and take a look at this great investment. Two bedrooms, 1 bath, condo living. Call to take a look today.
-
2025-09-30soldstatus Closed 134-char remark
Show marketing remark (134 chars)
G R E A T B U Y! Come on over and take a look at this great investment. Two bedrooms, 1 bath, condo living. Call to take a look today.
-
2025-09-03historical Active Under Contract 134-char remark
Show marketing remark (134 chars)
G R E A T B U Y! Come on over and take a look at this great investment. Two bedrooms, 1 bath, condo living. Call to take a look today.
-
2025-08-11$70,000 Active 134-char remark
Show marketing remark (134 chars)
G R E A T B U Y! Come on over and take a look at this great investment. Two bedrooms, 1 bath, condo living. Call to take a look today.
-
2025-08-11$70,000 Active 134-char remark
Show marketing remark (134 chars)
G R E A T B U Y! Come on over and take a look at this great investment. Two bedrooms, 1 bath, condo living. Call to take a look today.
-
2025-07-08soldstatus Closed
-
2025-06-11status Active
-
2025-05-15historical Active Under Contract
-
2025-04-29$69,900 Active
-
2024-08-09soldstatus Closed
-
2024-07-30historical Active Under Contract
-
2024-07-24status Active
-
2024-07-08soldstatus Closed
-
2024-06-30historical Active Under Contract
-
2024-06-29status Active
-
2024-06-14soldstatus Closed
-
2024-06-14soldstatus Closed
-
2024-04-30$74,700 Active
-
2024-04-29$74,700 Active
-
2024-04-28historical Active Under Contract
-
2024-04-24$74,700 Active
-
2024-04-10historical $895
-
2024-03-29$895
-
2024-03-27historical Active Under Contract
-
2024-03-13status Active
-
2024-03-01soldstatus Closed
-
2024-02-28historical Active Under Contract
-
2024-02-24$70,000 Active
-
2024-01-25historical Active Under Contract
-
2024-01-20historical $799
-
2024-01-07$799
-
2023-09-06historical
ⓘ Source: listings_history table (triggers on properties + properties_extension) + one-shot
backfill from property_details.listing_events for pre-trigger history.
Nearby sold comps map
Loading sold comps map…
Walkable amenities ~0.75 mi
Loading nearby amenities…
Taxation est. · year 1
- Rental income
- $14,288
- − Mortgage interest
- −$3,635
- − Property taxes
- −$974
- − Insurance
- −$324
- − Repairs & maintenance
- −$1,143
- − Management
- −$1,143
- − Depreciation
- −$1,888
- Taxable income
- $5,180
- Est. tax owed @ 24.0%
- −$1,243
- After-tax cash flow
- $4,662/yr
For passive investors: Depreciation is non-cash, so a rental often shows a tax loss while cash-flowing — sheltering income. Rental losses are passive: they offset passive income freely, and up to $25,000/yr can offset ordinary (W-2) income if you actively participate and your MAGI is under $100k (phasing out to $0 by $150k); unused losses carry forward. On sale, claimed depreciation is recaptured at up to 25%, and gains may owe capital-gains tax (a 1031 exchange can defer both). Figures are a year-1 estimate at your 24.0% rate — not tax advice; consult a CPA.
Condition & rehab AI · 12 photos
This property requires moderate renovations to improve its condition and appeal to buyers. Upgrading the kitchen and bathroom, and repairing the roof would significantly increase its value.
Repairs flagged
- Moderate kitchen cabinets — dated and worn
- Moderate bathroom vanity — dated and worn
- Moderate roof shingles — appears worn
Value-add opportunities
- Resale update kitchen cabinets and countertops — modernizing the kitchen would attract more buyers
- Resale update bathroom vanity and fixtures — modernizing the bathroom would attract more buyers
- Both repair/replace roof shingles — improving the roof would increase both resale and rental value
Renovation cost estimate screening
| Repair item | Severity | Est. cost |
|---|---|---|
| kitchen cabinets · dated and worn | Moderate | $3,000–15,000 |
| bathroom vanity · dated and worn | Moderate | $3,000–15,000 |
| roof shingles · appears worn | Moderate | $3,000–15,000 |
| Total estimated repair cost · 3 items | $9,000–45,000 |
Value-add ROI direction
- Resale update kitchen cabinets and countertops — modernizing the kitchen would attract more buyers ↑
- Resale update bathroom vanity and fixtures — modernizing the bathroom would attract more buyers ↑
- Both repair/replace roof shingles — improving the roof would increase both resale and rental value ↑
ⓘ Cost ranges are severity-bucket heuristics (US national rule-of-thumb). Get contractor quotes + a written scope before underwriting a rehab budget.
Schools (NCES district)
- District
- Dickinson 1
- NCES district ID
- 3800038
- Math proficiency
- 35% ▼ -12.00%
- Reading proficiency
- 43% ▼ -7.00%
- Median HH income
- $63,270
- Composite
- 34.9/100
- National rank
- #5080
- State rank
- #29 of 53 in ND
Livability — Dickinson
- Score
- 76/100
- State rank
- #12
- US rank
- #3334
Category grades
Schools grade is shown separately in the Schools card above.
Census & demographics
- Census place
- Dickinson, ND
- County
- Stark County · 29,916 people
- City population
- 29,916
- Metro
- Dickinson, ND
- Population (ZIP)
- 29,916
- Household income
- $85,821
- Rent vs Own
- Severe rent burden
- 813.0
Population outlook (Stark County) Hauer SSP2
- Today (2025)
- 50,426 people
- By 2030
- 60,812 · +20.6%
- By 2040
- 84,155 · +66.9%
- By 2050
- 110,718 · +119.6%
- By 2075
- 186,710 · +270.3%
- By 2100
- 264,902 · +425.3%
Race, ethnicity, and origin ACS 2023
- Neighborhood character
- Predominantly White (85%)
- Race & ethnicity
- White 85% Hispanic / Latino 7% Two or more races 5% Black 3% Asian 1%
- Hispanic origin (detail)
- Mexican 5%
- Common ancestry
- Portuguese 9% Scotch-Irish 2% Lithuanian 2%
- Foreign-born
- 4% · Canada, China
- Languages at home
- 92% English-only · Spanish 4% German/W. Germanic 1% Arabic 1%
Political lean MEDSL · Stark
- 2024 margin
- Solid R (+65.6) · D 16.5% · R 82.1% · Other 1.5%
- 2008→2024 swing
- -36.5pp toward R · 2008: -29.1pp · 2024: -65.6pp
- All cycles
- 2024: R+65.6 2020: R+63.9 2016: R+65.8 2012: R+49.4 2008: R+29.1
Not yet ingested
- Civics
- —
Market trends
- HPI YoY
- ▼ -133.57%
- Current HPI
- 188.1029
- Rent YoY
- ▲ 1.95%
- Metro
- Dickinson, ND
- State GDP YoY
- ▲ 2.09%
- F500 in state
- 2
Industry mix (Fortune 500 HQ in ND)
| Industry | F500 HQs | Revenue |
|---|---|---|
| Utilities / Construction | 1 | $6B |
|
||
Price history
-27.8% since first listed47 events — show timeline
- 2026-04-26 Listed $64,900 Badlands BOR MLS
- 2026-04-21 Price Changed $67,000 Badlands BOR MLS
- 2025-09-30 Sold (MLS) — Badlands BOR MLS
- 2025-09-03 Contingent — Badlands BOR MLS
- 2025-08-11 Listed $70,000 Badlands BOR MLS
- 2025-08-11 Listed $70,000 Badlands BOR MLS
- 2025-07-08 Sold (MLS) — Badlands BOR MLS
- 2025-06-11 Relisted — Badlands BOR MLS
- 2025-05-15 Contingent — Badlands BOR MLS
- 2025-04-29 Listed $69,900 Badlands BOR MLS
- 2024-08-09 Sold (MLS) — Badlands BOR MLS
- 2024-07-30 Contingent — Badlands BOR MLS
- 2024-07-24 Relisted — Badlands BOR MLS
- 2024-07-08 Sold (MLS) — Badlands BOR MLS
- 2024-06-30 Contingent — Badlands BOR MLS
- 2024-06-29 Relisted — Badlands BOR MLS
- 2024-06-14 Sold (MLS) — Badlands BOR MLS
- 2024-06-14 Sold (MLS) — Badlands BOR MLS
- 2024-04-30 Listed $74,700 Badlands BOR MLS
- 2024-04-29 Listed $74,700 Badlands BOR MLS
- 2024-04-28 Contingent — Badlands BOR MLS
- 2024-04-24 Listed $74,700 Badlands BOR MLS
- 2024-04-10 Rental Removed $895 APPFOLIO
- 2024-03-29 Listed for Rent $895 APPFOLIO
- 2024-03-27 Contingent — Badlands BOR MLS
- 2024-03-13 Relisted — Badlands BOR MLS
- 2024-03-01 Sold (MLS) — Badlands BOR MLS
- 2024-02-28 Contingent — Badlands BOR MLS
- 2024-02-24 Listed $70,000 Badlands BOR MLS
- 2024-01-25 Contingent — Badlands BOR MLS
- 2024-01-20 Rental Removed $799 APPFOLIO
- 2024-01-07 Listed for Rent $799 APPFOLIO
- 2023-09-06 Delisted — Badlands BOR MLS
- 2023-09-06 Delisted — Badlands BOR MLS
- 2023-09-06 Delisted — Badlands BOR MLS
- 2023-09-06 Delisted — Badlands BOR MLS
- 2023-09-06 Delisted — Badlands BOR MLS
- 2023-09-06 Delisted — Badlands BOR MLS
- 2023-09-06 Delisted — Badlands BOR MLS
- 2023-08-26 Listed $75,000 Badlands BOR MLS
- 2022-06-02 Listed $54,900 Badlands BOR MLS
- 2021-05-08 Listed $49,000 Badlands BOR MLS
- 2021-05-08 Listed $45,000 Badlands BOR MLS
- 2021-05-08 Listed $45,000 Badlands BOR MLS
- 2021-05-08 Listed $45,000 Badlands BOR MLS
- 2012-10-26 Listed $89,000 Badlands BOR MLS
- 2012-08-20 Listed $89,900 Badlands BOR MLS
Cash-flow waterfall
monthlySold comps — $/sqft
last 12 mo · ≤1 miLoading sold comps…