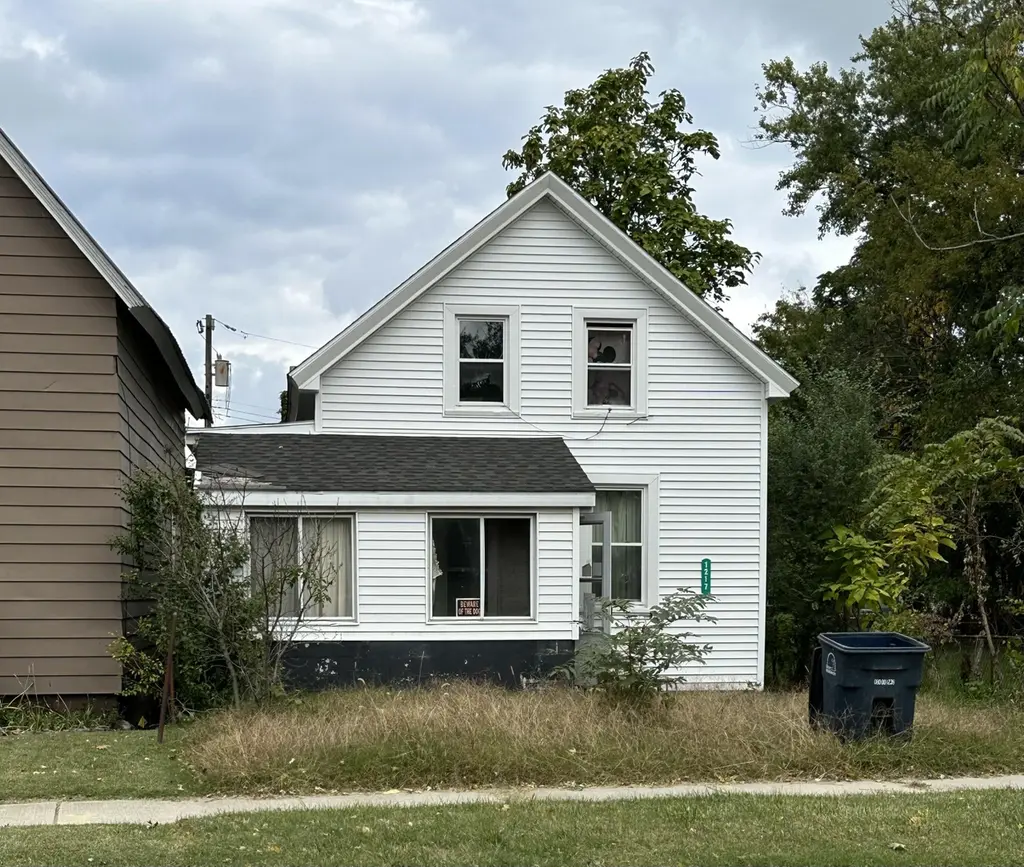
1217 W 10th St · Michigan City, IN
Flood risk 1/10 · Minimal
- FEMA flood zone
- X (unshaded)
- Chance of flooding over 30 yrs
- 0.0%
- Est. flood insurance / yr
- $473 – $860
Fire risk 3/10 · Minor
- Est. fire insurance / yr
- $717 – $1,331
Heat risk 3/10 · Minor
- Hot days now (above 99°F)
- 7 days/yr
- Hot days in 30 yrs
- 14 days/yr
Wind risk 2/10 · Minimal
- Chance of severe wind over 30 yrs
- —
Air-quality risk 3/10 · Minor
- Unhealthy air days now
- 2 days/yr
- Unhealthy air days in 30 yrs
- 3 days/yr
Risk factors via First Street. Map © Google.
Why this score? — see what drove the B grade
The composite is a weighted blend of 9 inputs, each scored 0–100. Each bar is that input's sub-score; the figure is the points it added to the 100-point composite (weight × sub-score).
- Cash flow +30.0/30.0
- 1% rule +10.0/10.0
- DSCR +10.0/10.0
- ARV discount +7.5/15.0
- Rent growth +4.9/5.0
- Livability +4.0/5.0
- Condition / age +2.5/5.0
- Schools +2.2/10.0
- Appreciation +0.0/10.0
$49,000
🖨 Deal sheet (PDF) 📄 Offer letter ✓ Due diligence
Listing remarks MLS
Attention investors or the handy home owner! Needs a little TLC but this home would be great for your next flip, rental or place to call home!
Key facts
- 4,356 sq ft lot
- Built 1890
- Listed 62 days
Neighborhood map
What this means for you Summary
Snapshot
- This is a 3-bed/2.0-bath single-family listed at $49k.
Deal economics
- At list price, monthly cash flow is $881 ($11k/yr) — positive.
- The deal already cash-flows at list — no discount required.
- Meets the 1% rule at list price ($2k rent vs $49k).
- Recommended offer: $46k (6.0% below list) — sets the bar for market timing.
- Cap rate 27.9% vs local median 2.7% in Michigan City — top-decile yield for the area; either an underpriced asset or a hidden risk that comps aren't pricing in. Stress-test before assuming the spread holds.
Location & tenants
- Location reads 81/100 on livability (#15 in IN, #1,317 nationally) — a professional / high-income tenant draw. Strengths: commute A+, cost of living A+, housing A+; Watch: employment D, schools D-, amenities D-.
- Michigan City Area Schools (urban): math 23% / reading 28% proficiency, ranked #262 of 301 in IN (top 87%) — low school quality limits family demand, transient renter base, plan for 1-2y turnover; 68% free/reduced lunch — lower-income household profile, screen leases tightly.
- Market conditions: Rents rising fast (+9.7%/yr); 371 active listings in the ZIP; 4 comparable units currently listed for rent nearby; rentals lingering (median 45d on market — plan ~5-8 weeks vacancy on turnover, expect pricing pressure); 100% of comp listings sitting > 30 days — soft ceiling on asking rent; 216 units permitted in LaPorte County in 2024 (75 in 5+ unit buildings).
- This rent runs 31% of the median local income ($59k/yr) — at the standard rent-burdened threshold; future hikes will face affordability resistance.
Forward outlook
- Local home prices are declining (-3.0%/yr); year-one equity from $339 of loan paydown is wiped out by about $1k of value loss. Plan a longer hold.
- LaPorte County population projected to shrink 7% by 2050 — rents likely to lag national; underwrite the cash flow, not the appreciation.
- At projected returns (-3.0% appreciation + 8.0% rent growth), your $14k cash investment doubles in ~2 years — after that, you're playing with house money.
Negotiation context
- It's been on market 63 days — a 6% lower offer ($46k) is reasonable based on typical stale-listing flexibility.
Risks & watch-outs
- Watch-outs: built in 1890 — expect roof / HVAC / electrical / plumbing capex.
Questions for the listing agent
- It's been on market 63 days. Have you received any prior offers? Is the seller open to a 6% concession, seller financing, or rate buy-down credit?
- Built in 1890 — when were the roof, HVAC, electrical panel, plumbing, and water heater last replaced?
- Why hasn't it sold? Are there any deal-killer items the seller is aware of (foundation, flood, title, zoning, code violations)?
- Is there a deadline driving the sale (1031 exchange, divorce, estate, relocation)? That informs how much negotiation room exists.
- Schools are D-rated, which usually means shorter tenancies and higher turnover. Who's the typical renter profile here, and what's been the actual vacancy rate?
- What's the average days-on-market for RENTAL listings here right now (not sales)? A rising rental-DOM trend means longer vacancies and softer asking-rent achievability than the comps imply.
- What's the recent tenant-quality profile in this submarket — average credit score on applications, eviction rate, late-payment / NSF rate, and stable-employment percentage? A property-management company in the area should have these aggregated.
- How much new for-sale + rental construction is in the pipeline within 1–3 miles? Heavy new supply typically softens prices + rents 12–24 months out; constrained supply supports both.
Investment metrics
- 1% rule
- 3.15% ✓
- Cap rate
- 27.87%
- Cash-on-cash
- 77.07%
- DSCR
- 4.43
- GRM
- 2.6
CMA / ARV
- ARV (median comp)
- $110,104
- List price
- $49,000
- Delta
- -55.50%
- Verdict
- UNDERPRICED
- Comps
- 20 within 1.0 mi
Show comp detail 12 sales within ~0.75 mi
| Address | Dist | Beds/Ba | Sqft | Sold | Price | $/sf | Match |
|---|---|---|---|---|---|---|---|
| 234 Douglas Ave | 0.24mi | 3/2.0 | 1,400 (+0%) | 1mo | $40,000 | $29 | 88 |
| 102 Grant Ave | 0.31mi | 3/2.0 | 1,344 (-4%) | 10mo | $100,000 | $74 | 71 |
| 1301 Elston St | 0.50mi | 4/1.0 (+1) | 1,282 (-8%) | 3mo | $207,000 | $161 | 52 |
| 435 Hayes Ave | 0.37mi | 3/1.0 | 1,260 (-10%) | 14mo | $45,000 | $36 | 50 |
| 816 W 4th St | 0.34mi | 3/1.0 | 1,579 (+13%) | 12mo | $240,000 | $152 | 49 |
| 1350 Russell St | 0.40mi | 2/1.0 (-1) | 1,213 (-13%) | 3mo | $144,000 | $119 | 48 |
| 607 W Ripley St | 0.53mi | 2/1.0 (-1) | 1,546 (+11%) | 3mo | $97,000 | $63 | 46 |
| 1701 Manhattan St | 0.64mi | 3/2.0 | 1,539 (+10%) | 11mo | $169,000 | $110 | 44 |
| 1919 Elston St | 0.68mi | 2/2.0 (-1) | 1,532 (+10%) | 4mo | $159,900 | $104 | 44 |
| 1109 Manhattan St | 0.53mi | 4/1.0 (+1) | 1,584 (+13%) | 7mo | $75,000 | $47 | 38 |
| 1818 Elston St | 0.66mi | 3/1.0 | 1,592 (+14%) | 5mo | $115,000 | $72 | 38 |
| 1930 Tennessee St | 0.66mi | 4/1.5 (+1) | 1,596 (+14%) | 5mo | $170,000 | $107 | 34 |
Match score weights: distance 35% · size 25% · config 20% · recency 20%. Top-matched comps best support the ARV.
Projected returns pro-forma
-3.0% appreciation · 8.0% rent growth · sell at horizon
- IRR
- 82.7%
- Equity multiple
- 5.11×
- Total profit
- $56,365
- Equity at exit
- $7,306
- IRR
- 87.2%
- Equity multiple
- 12.56×
- Total profit
- $158,581
- Equity at exit
- $4,237
Cash invested: $13,720 (down + closing). Projections, not guarantees.
Landlord ↔ Tenant lean methodology
- Overall (STATE)
- 90 Strongly Landlord-Friendly
- State Indiana
- 90 Strongly Landlord-Friendly · R+11
- County
- — inherits STATE
- City
- — inherits STATE
ZIP-level market 46360
- Rents YoY
- 9.7%
- Active inventory
- 371
- Price-to-rent
- 2.6×
Monthly cashflow live
- Estimated rent
- $1,544 medium interval (Pro) →
- Mortgage (P&I)
- −$257
- Tax est. 1.5%
- −$61 /mo · $735/yr
- Insurance
- −$20
- HOA
- −$0
- Vacancy / Maint / Mgmt
- −$324
- Net cashflow
- $881
Break-even live
Sensitivity live
| Price | -10% $915 | -5% $898 | +0% $881 | +5% $864 | +10% $847 |
|---|---|---|---|---|---|
| Rent | -10% $759 | -5% $820 | +0% $881 | +5% $942 | +10% $1,003 |
| Rate | -1.0pp $906 | -0.5pp $894 | base $881 | +0.5pp $868 | +1.0pp $856 |
UW: 25.0% down · 7.5% · 30yr · 1.5% tax · 5.0% vac · 8.0% maint · 8.0% mgmt
Financing live
Cash to close
- Down payment
- $12,250
- Closing costs
- $1,470
- Reserves months
- —
- Total cash needed
- —
Loan-product check · same deal, 3 products live
Conventional
25% down · 7.5% · 30yr
- Down + closing
- —
- Monthly P&I
- —
- Monthly cashflow
- —
- DSCR
- —
- Eligible?
- —
Personal DTI + credit; lowest rate.
DSCR
20% down · 8.5% · 30yr
- Down + closing
- —
- Monthly P&I
- —
- Monthly cashflow
- —
- DSCR
- —
- Eligible?
- —
No personal income docs; deal must DSCR.
Hard money
10% down · 12.0% · 12mo
- Down + closing
- —
- Monthly P&I
- —
- Monthly cashflow
- —
- DSCR
- —
- Eligible?
- —
Short-term bridge; refi at stabilization.
Rent comps 4 comps
| Address | Beds | Baths | Sqft | Rent | $/sqft | DOM | Units | Dist |
|---|---|---|---|---|---|---|---|---|
| 1303 Buffalo St Unit 1 Michigan City, IN | 3.0 | 1.0 | 1700 | $1,700 | $1.00 | 44d | 1 | 0.59mi |
| 934 Henry St Michigan City, IN | 3.0 | 1.0 | 1100 | $1,250 | $1.14 | 44d | 1 | 0.84mi |
| 416 E 9th St Unit 2 Michigan City, IN | 3.0 | 2.0 | 1400 | $1,325 | $0.95 | 44d | 1 | 1.10mi |
| 3581 Hampden Rd Michigan City, IN | 4.0 | 1.0 | 1120 | $2,000 | $1.79 | 44d | 1 | 1.24mi |
Listing history 20 events
-
2026-06-19days on market $49,000 Active 63 DOM
-
2026-06-18days on market $49,000 Active 62 DOM
-
2026-06-17days on market $49,000 Active 61 DOM
-
2026-06-16days on market $49,000 Active 60 DOM
-
2026-06-15days on market $49,000 Active 59 DOM
-
2026-06-14days on market $49,000 Active 57 DOM
-
2026-06-13days on market $49,000 Active 56 DOM
-
2026-06-10days on market $49,000 Active 54 DOM
-
2026-06-09days on market $49,000 Active 53 DOM
-
2026-06-08days on market $49,000 Active 52 DOM
-
2026-06-07days on market $49,000 Active 51 DOM
-
2026-06-03days on market $49,000 Active 47 DOM
-
2026-06-03price $49,000 Active 46 DOM
-
2026-06-02days on market $55,000 Active 46 DOM
-
2026-06-01days on market $55,000 Active 45 DOM
-
2026-05-31days on market $55,000 Active 44 DOM
-
2026-05-30days on market $55,000 Active 43 DOM
-
2026-05-15price $55,000 142-char remark
Show marketing remark (142 chars)
Attention investors or the handy home owner! Needs a little TLC but this home would be great for your next flip, rental or place to call home!
-
2026-05-08price $59,000 142-char remark
Show marketing remark (142 chars)
Attention investors or the handy home owner! Needs a little TLC but this home would be great for your next flip, rental or place to call home!
-
2026-04-17$65,000 Active 142-char remark
Show marketing remark (142 chars)
Attention investors or the handy home owner! Needs a little TLC but this home would be great for your next flip, rental or place to call home!
ⓘ Source: listings_history table (triggers on properties + properties_extension) + one-shot
backfill from property_details.listing_events for pre-trigger history.
Climate risk First Street
- Flood 1/10 Low FEMA zone X (unshaded) · 0% chance over 30 yrs
- Wildfire 3/10 Moderate
- Heat 3/10 Moderate 7 d/yr ≥99°F today · 14 d/yr by 30 yrs out
- Wind 2/10 Low
- Air quality 3/10 Moderate 2 unhealthy d/yr today · 3 by 30 yrs out
Nearby sold comps map
Loading sold comps map…
Walkable amenities ~0.75 mi
Loading nearby amenities…
Taxation est. · year 1
- Rental income
- $18,528
- − Mortgage interest
- −$2,745
- − Property taxes
- −$735
- − Insurance
- −$245
- − Repairs & maintenance
- −$1,482
- − Management
- −$1,482
- − Depreciation
- −$1,425
- Taxable income
- $10,414
- Est. tax owed @ 24.0%
- −$2,499
- After-tax cash flow
- $8,075/yr
For passive investors: Depreciation is non-cash, so a rental often shows a tax loss while cash-flowing — sheltering income. Rental losses are passive: they offset passive income freely, and up to $25,000/yr can offset ordinary (W-2) income if you actively participate and your MAGI is under $100k (phasing out to $0 by $150k); unused losses carry forward. On sale, claimed depreciation is recaptured at up to 25%, and gains may owe capital-gains tax (a 1031 exchange can defer both). Figures are a year-1 estimate at your 24.0% rate — not tax advice; consult a CPA.
Schools (NCES district)
- District
- Michigan City Area Schools
- NCES district ID
- 1806570
- Math proficiency
- 23% ▼ -16.00%
- Reading proficiency
- 28% ▼ -10.00%
- Median HH income
- $42,629
- Composite
- 21.76/100
- National rank
- #8257
- State rank
- #262 of 301 in IN
Livability — Michigan City
- Score
- 81/100
- State rank
- #15
- US rank
- #1317
Category grades
Schools grade is shown separately in the Schools card above.
Census & demographics
- Census place
- Michigan City, IN
- County
- La Porte County · 88,580 people
- City population
- 43,817
- Metro
- Michigan City-La Porte, IN
- Population (ZIP)
- 43,817
- Household income
- $59,266
- Rent vs Own
- Severe rent burden
- 1152.0
Population outlook (LaPorte County) Hauer SSP2
- Today (2025)
- 109,757 people
- By 2030
- 108,288 · -1.3%
- By 2040
- 105,070 · -4.3%
- By 2050
- 102,330 · -6.8%
- By 2075
- 97,009 · -11.6%
- By 2100
- 86,459 · -21.2%
Race, ethnicity, and origin ACS 2023
- Neighborhood character
- Predominantly White (67%)
- Race & ethnicity
- White 67% Black 20% Hispanic / Latino 8% Two or more races 7%
- Hispanic origin (detail)
- Mexican 5%
- Common ancestry
- Romanian 11% Lithuanian 2% Iranian 1%
- Foreign-born
- 3% · Canada
- Languages at home
- 95% English-only · Spanish 3%
Political lean MEDSL · LaPorte
- 2024 margin
- R (+14.1) · D 42.1% · R 56.2% · Other 1.7%
- 2008→2024 swing
- -19.1pp toward R · 2008: 5.0pp · 2024: -14.1pp
- All cycles
- 2024: R+14.1 2020: R+7.2 2016: R+6.4 2012: D+12.6 2008: D+5.0
Not yet ingested
- Civics
- —
Market trends
- HPI YoY
- ▼ -210.27%
- Current HPI
- 206.0882
- Rent YoY
- ▲ 9.72%
- Metro
- Michigan City-La Porte, IN
- State GDP YoY
- ▲ 2.90%
- F500 in state
- 18
Industry mix (Fortune 500 HQ in IN)
| Industry | F500 HQs | Revenue |
|---|---|---|
| Industrial Machinery | 2 | $37B |
|
||
| Healthcare | 1 | $177B |
|
||
| Pharmaceuticals | 1 | $45B |
|
||
| Metals / Steel | 1 | $18B |
|
||
| Agriculture | 1 | $17B |
|
||
| Packaging | 1 | $12B |
|
||
Price history
-15.4% since first listed3 events — show timeline
- 2026-05-15 Price Changed $55,000 NIRA MLS as Distributed by MLS Grid
- 2026-05-08 Price Changed $59,000 NIRA MLS as Distributed by MLS Grid
- 2026-04-17 Listed $65,000 NIRA MLS as Distributed by MLS Grid
Property tax history
+100.0%/yrLatest (2019): $48 · +0.0% YoY. Source: county tax records.
Cash-flow waterfall
monthlySold comps — $/sqft
last 12 mo · ≤1 miLoading sold comps…