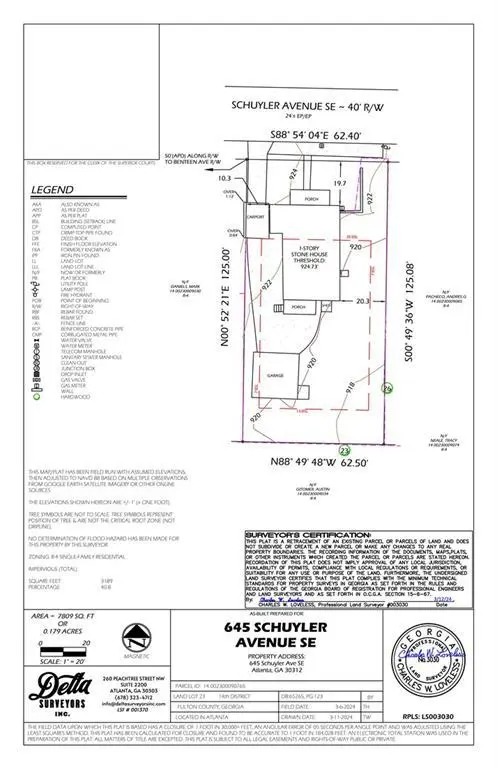
645 Schuyler Ave SE · Atlanta, GA
Flood risk 1/10 · Minimal
- FEMA flood zone
- X (unshaded)
- Chance of flooding over 30 yrs
- 0.0%
- Est. flood insurance / yr
- $473 – $860
Fire risk 1/10 · Minimal
- Est. fire insurance / yr
- $963 – $1,789
Heat risk 5/10 · Moderate
- Hot days now (above 105°F)
- 7 days/yr
- Hot days in 30 yrs
- 18 days/yr
Wind risk 6/10 · Moderate
- Chance of severe wind over 30 yrs
- 27.0%
Air-quality risk 4/10 · Minor
- Unhealthy air days now
- 4 days/yr
- Unhealthy air days in 30 yrs
- 6 days/yr
Risk factors via First Street. Map © Google.
Why this score? — see what drove the D grade
The composite is a weighted blend of 9 inputs, each scored 0–100. Each bar is that input's sub-score; the figure is the points it added to the 100-point composite (weight × sub-score).
- ARV discount +15.0/15.0
- Cash flow +9.4/30.0
- Livability +4.2/5.0
- 1% rule +3.2/10.0
- Rent growth +3.2/5.0
- Schools +2.7/10.0
- DSCR +2.6/10.0
- Condition / age +2.5/5.0
- Appreciation +0.0/10.0
$309,750
🖨 Deal sheet 📄 Offer letter ✓ Due diligence
Listing remarks MLS
Teardown on Level Lot with great Opportunity to build Intown Primary Residence or Income Producing Property! Located within walking distance to the Southside BeltLine Trail, Grant Park, Chosewood Park, Benteen Park and the vibrant East Atlanta area. Minutes from new shopping and restaurants along the Memorial Drive Corridor. This property is a strong value play surrounded by ongoing new development and new $1M+ Custom Homes. Survey in FMLS Docs and Showingtime. We have a Full Set of Architectural Plans for a Single Family Modern Home prepared by Reuden Group that we are happy to include with the sale.
Key facts
- 7,875 sq ft lot
- 2 parking spots
- Built 1925
Neighborhood map
What this means for you Summary
Snapshot
- This is a 3-bed/1.5-bath single-family listed at $310k.
Deal economics
- At list price, monthly cash flow is $-220 ($-3k/yr) — negative.
- To cash-flow at today's rent, offer at most $271k (12.6% below list).
- To meet the 1% rule (rent ≥ 1% of price), the offer needs to be $253k (18.3% below list).
- Recommended offer: $253k (18.3% below list) — sets the bar for 1% rule.
- Cap rate 5.4% vs local median 3.1% in Atlanta — top-decile yield for the area; either an underpriced asset or a hidden risk that comps aren't pricing in. Stress-test before assuming the spread holds.
Location & tenants
- Location reads 83/100 on livability (#6 in GA, #919 nationally) — a professional / high-income tenant draw. Strengths: amenities A+, commute A+, housing A+; Watch: schools C-, cost of living C-.
- Atlanta Public Schools (urban): math 28% / reading 35% proficiency, ranked #80 of 174 in GA (top 46%) — families likely to look elsewhere, expect single-tenant / working-renter base with shorter leases; 71% free/reduced lunch — lower-income household profile, screen leases tightly.
- Market conditions: Rents rising (+2.8%/yr); 237 active listings in the ZIP; 40 comparable units currently listed for rent nearby; rentals at typical pace (median 17d on market — plan ~3-4 weeks tenant-placement turnaround); solid renter incomes; 11,565 units permitted in Fulton County in 2024 (8,159 in 5+ unit buildings).
- This rent runs 37% of the median local income ($83k/yr) — at the standard rent-burdened threshold; future hikes will face affordability resistance.
Forward outlook
- Local home prices are declining (-3.0%/yr); year-one equity from $2k of loan paydown is wiped out by about $9k of value loss. Plan a longer hold.
- Fulton County population projected at +38% by 2050 — long-run rental-demand tailwind backs the buy-and-hold thesis.
Negotiation context
- It's been on market 110 days — a 9% lower offer ($282k) is reasonable based on typical stale-listing flexibility.
- 3 sale attempts since 5y ago with the ask held roughly flat each time — persistent listings suggest the price (not the market) is what's stuck; bring a comps-based counter.
- Current owner paid $260k; 19% above their basis — modest negotiation headroom, anchor on the comps not their cost.
Risks & watch-outs
- Watch-outs: built in 1925 — expect roof / HVAC / electrical / plumbing capex.
- Climate carrying-cost: major wind risk, 27% chance of damaging wind over 30y; extreme-heat days projected 7→18/yr by 2055 (HVAC capex compounding) — expect insurance premiums to compound above CPI over the hold.
Questions for the listing agent
- What do current leases actually rent for vs. the listed asking? Can we see a recent rent roll and the last 12 months of T-12 income?
- It's been on market 110 days. Have you received any prior offers? Is the seller open to a 18% concession, seller financing, or rate buy-down credit?
- Built in 1925 — when were the roof, HVAC, electrical panel, plumbing, and water heater last replaced?
- Why hasn't it sold? Are there any deal-killer items the seller is aware of (foundation, flood, title, zoning, code violations)?
- Is there a deadline driving the sale (1031 exchange, divorce, estate, relocation)? That informs how much negotiation room exists.
- The area grade is low — what's the realistic commute time and amenity access for the typical tenant pool here? Any planned neighborhood developments (good or bad) we should know about?
- What's the average days-on-market for RENTAL listings here right now (not sales)? A rising rental-DOM trend means longer vacancies and softer asking-rent achievability than the comps imply.
- What's the recent tenant-quality profile in this submarket — average credit score on applications, eviction rate, late-payment / NSF rate, and stable-employment percentage? A property-management company in the area should have these aggregated.
- How much new for-sale + rental construction is in the pipeline within 1–3 miles? Heavy new supply typically softens prices + rents 12–24 months out; constrained supply supports both.
Investment metrics
- 1% rule
- 0.82% ✗
- Cap rate
- 5.44%
- Cash-on-cash
- -3.05%
- DSCR
- 0.86
- GRM
- 10.2
CMA / ARV
- ARV (median comp)
- $488,463
- List price
- $309,750
- Delta
- -36.59%
- Verdict
- UNDERPRICED
- Comps
- 20 within 1.0 mi
Show comp detail 12 sales within ~0.75 mi
| Address | Dist | Beds/Ba | Sqft | Sold | Price | $/sf | Match |
|---|---|---|---|---|---|---|---|
| 644 Mead St SE | 0.20mi | 2/2.0 (-1) | 1,100 (+3%) | 4mo | $665,000 | $605 | 76 |
| 658 Schuyler Ave SE | 0.03mi | 2/1.0 (-1) | 1,136 (+6%) | 7mo | $282,000 | $248 | 75 |
| 740 Custer Ave SE | 0.55mi | 3/2.0 | 1,091 (+2%) | 4mo | $365,000 | $335 | 66 |
| 681 Home Ave SE | 0.31mi | 3/2.0 | 1,192 (+12%) | 5mo | $599,500 | $503 | 60 |
| 841 Teton Ave SE | 0.33mi | 2/1.0 (-1) | 947 (-11%) | 4mo | $430,000 | $454 | 56 |
| 835 Teton Ave SE | 0.32mi | 2/1.0 (-1) | 1,196 (+12%) | 4mo | $385,000 | $322 | 54 |
| 763 Ormewood Ave SE | 0.65mi | 2/1.0 (-1) | 1,005 (-6%) | 1mo | $425,000 | $423 | 52 |
| 1058 Grant Ter SE | 0.73mi | 3/2.0 | 1,148 (+8%) | 4mo | $309,500 | $270 | 49 |
| 1078 Grant Ter SE | 0.73mi | 4/2.0 (+1) | 1,148 (+8%) | 5mo | $303,500 | $264 | 42 |
| 956 Delaware Ave SE | 0.74mi | 2/2.0 (-1) | 951 (-11%) | 1mo | $420,000 | $442 | 39 |
| 824 Delmar Ct SE | 0.69mi | 3/1.0 | 912 (-15%) | 7mo | $285,000 | $313 | 35 |
| 1227 Hill St | 0.73mi | 3/2.0 | 1,210 (+13%) | 8mo | $475,000 | $393 | 35 |
Match score weights: distance 35% · size 25% · config 20% · recency 20%. Top-matched comps best support the ARV.
Projected returns pro-forma
-3.0% appreciation · 2.84% rent growth · sell at horizon
- IRR
- -21.5%
- Equity multiple
- 0.26×
- Total profit
- $-64,546
- Equity at exit
- $46,185
- IRR
- -15.5%
- Equity multiple
- 0.13×
- Total profit
- $-75,587
- Equity at exit
- $26,782
Cash invested: $86,730 (down + closing). Projections, not guarantees.
Landlord ↔ Tenant lean methodology
- Overall (STATE)
- 90 Strongly Landlord-Friendly
- State Georgia
- 90 Strongly Landlord-Friendly · R+3
- County
- — inherits STATE
- City
- — inherits STATE
ZIP-level market 30312
- Rents YoY
- 2.8%
- Active inventory
- 237
- Price-to-rent
- 10.2×
Monthly cashflow live
- Estimated rent
- $2,531 high interval (Pro) →
- Mortgage (P&I)
- −$1,624
- Tax from tax record
- −$467 /mo · $5,601/yr
- Insurance
- −$129
- HOA
- −$0
- Vacancy / Maint / Mgmt
- −$532
- Net cashflow
- $-220
Break-even live
UW: 25.0% down · 7.5% · 30yr · 1.5% tax · 5.0% vac · 8.0% maint · 8.0% mgmt
Financing live
Cash to close
- Down payment
- $77,438
- Closing costs
- $9,292
- Reserves months
- —
- Total cash needed
- —
Loan-product check · same deal, 3 products live
Conventional
25% down · 7.5% · 30yr
- Down + closing
- —
- Monthly P&I
- —
- Monthly cashflow
- —
- DSCR
- —
- Eligible?
- —
Personal DTI + credit; lowest rate.
DSCR
20% down · 8.5% · 30yr
- Down + closing
- —
- Monthly P&I
- —
- Monthly cashflow
- —
- DSCR
- —
- Eligible?
- —
No personal income docs; deal must DSCR.
Hard money
10% down · 12.0% · 12mo
- Down + closing
- —
- Monthly P&I
- —
- Monthly cashflow
- —
- DSCR
- —
- Eligible?
- —
Short-term bridge; refi at stabilization.
Rent comps 40 comps
| Address | Beds | Baths | Sqft | Rent | $/sqft | DOM | Units | Dist |
|---|---|---|---|---|---|---|---|---|
| 680 Hamilton Ave SE Atlanta, GA | 1.0–2.0 | 1.0–2.0 | 929 | $2,445 | $2.63 | 2d | 15 | 0.15mi |
| 1099 Boulevard SE Atlanta, GA | 2.0 | 1.0–2.0 | 928 | $2,294 | $2.47 | 1d | 30 | 0.16mi |
| 1015 Boulevard SE Atlanta, GA | 2.0 | 1.0–2.0 | 933 | $2,632 | $2.82 | 1d | 17 | 0.18mi |
| 655 Mead St SE #67 Atlanta, GA | 2.0 | 2.0 | 1500 | $2,295 | $1.53 | 24d | 1 | 0.27mi |
| 1104 Avondale Ave SE Atlanta, GA | 1.0–3.0 | 1.0–2.0 | 1152 | $3,715 | $3.22 | 3d | 204 | 0.33mi |
| 547 Atlanta Ave SE Atlanta, GA | 2.0 | 1.0 | 1000 | $1,850 | $1.85 | 24d | 1 | 0.37mi |
| 1267 Zucchini Cir SE Atlanta, GA | 3.0 | 3.0 | 1500 | $3,800 | $2.53 | 24d | 1 | 0.41mi |
| 1267 Zucchini Cir SE Atlanta, GA | 3.0 | 3.0 | 1500 | $3,300 | $2.20 | 7d | 1 | 0.41mi |
| 430 Englewood Ave SE Atlanta, GA | 3.0 | 1.0–2.0 | 938 | $3,605 | $3.84 | 1d | 28 | 0.44mi |
| 1051 Villa Ct SE Atlanta, GA | 1.0–2.0 | 1.0 | 760 | $1,495 | $1.97 | 24d | 3 | 0.48mi |
| 1394 Cozy Cir SE Atlanta, GA | 3.0 | 3.0 | 1500 | $2,850 | $1.90 | 14d | 1 | 0.49mi |
| 672 Cassanova St SE Unit B Atlanta, GA | 2.0 | 1.5 | 1245 | $2,300 | $1.85 | 18d | 1 | 0.61mi |
| 1000 Hill St SE Unit A Atlanta, GA | 2.0 | 1.0 | 1500 | $2,323 | $1.55 | 7d | 1 | 0.67mi |
| 979 Hill St SE Atlanta, GA | 3.0 | 2.0 | 1380 | $3,000 | $2.17 | 22d | 1 | 0.71mi |
| 795 Grant St SE Atlanta, GA | 3.0 | 2.0 | 1474 | $5,200 | $3.53 | 2d | 1 | 0.77mi |
| 222 Tuskegee St SE Atlanta, GA | 2.0–3.0 | 1.0–2.0 | 1202 | $1,525 | $1.27 | 24d | 6 | 0.82mi |
| 402 McDonough Blvd SE Atlanta, GA | 3.0 | 3.5 | 1270 | $2,350 | $1.85 | 24d | 1 | 0.82mi |
| 980 Woodland Ave SE Atlanta, GA | 3.0 | 2.0 | 1137 | $2,150 | $1.89 | 22d | 1 | 0.88mi |
| 841 Killian St SE Atlanta, GA | 1.0–3.0 | 1.0–2.0 | 1242 | $3,548 | $2.86 | 2d | 6 | 0.94mi |
| 207 South Ave SE Atlanta, GA | 2.0 | 1.0 | 750 | $1,977 | $2.64 | 24d | 1 | 0.95mi |
| 940 Martin St SE Atlanta, GA | 3.0 | 3.0 | 1364 | $2,495 | $1.83 | 24d | 1 | 0.96mi |
| 45 Boynton Ave SE Atlanta, GA | 2.0–4.0 | 2.5–4.0 | 1452 | $2,918 | $2.01 | 1d | 15 | 0.97mi |
| 967 Martin St SE Atlanta, GA | 3.0 | 2.0 | 1162 | $1,950 | $1.68 | 24d | 1 | 0.97mi |
| 356 Georgia Ave SE Atlanta, GA | 4.0 | 2.0 | 1472 | $3,195 | $2.17 | 16d | 1 | 0.97mi |
| 752 McDonough Blvd SE Atlanta, GA | 3.0 | 2.0 | 1120 | $1,895 | $1.69 | 24d | 1 | 1.00mi |
| 1940 Fisher Rd SE Atlanta, GA | 2.0 | 1.0 | 760 | $1,300 | $1.71 | 24d | 1 | 1.05mi |
| 523 SE BLVD Unit B Atlanta, GA | 2.0 | 2.0 | 1275 | $2,500 | $1.96 | 22d | 1 | 1.05mi |
| 125 Milton Ave SE Atlanta, GA | 2.0 | 1.0–2.0 | 965 | $2,494 | $2.58 | 1d | 29 | 1.06mi |
| 141 McDonough Blvd SE Atlanta, GA | 3.0 | 2.0 | 1242 | $2,250 | $1.81 | 24d | 1 | 1.08mi |
| 72 Milton Ave SE Atlanta, GA | 2.0 | 1.0–2.0 | 818 | $2,107 | $2.57 | 1d | 24 | 1.09mi |
| 1054 Atlanta, GA | 3.0–4.0 | 2.0 | 1295 | $1,974 | $1.52 | 20d | 2 | 1.09mi |
| 915 Glenwood Ave SE Atlanta, GA | 1.0–2.0 | 1.0–2.0 | 1119 | $2,771 | $2.48 | 1d | 16 | 1.11mi |
| 1496 Woodland Ave SE Atlanta, GA | 3.0 | 3.5 | 1144 | $2,600 | $2.27 | 2d | 1 | 1.13mi |
| 860 Glenwood Ave SE Atlanta, GA | 2.0 | 1.0–2.0 | 863 | $2,320 | $2.69 | 1d | 20 | 1.13mi |
| 730 Glenwood Ave SE Atlanta, GA | 1.0–2.0 | 1.0–2.5 | 1032 | $3,399 | $3.29 | 1d | 16 | 1.15mi |
| 600 Warwick St SE Atlanta, GA | 3.0 | 2.0 | 1100 | $2,495 | $2.27 | 24d | 1 | 1.17mi |
| 1455 Jonesboro Rd SE Atlanta, GA | 2.0 | 1.0 | 700 | $2,000 | $2.86 | 24d | 1 | 1.18mi |
| 1056 Hank Aaron Dr SW Atlanta, GA | 1.0–2.0 | 1.0 | 753 | $1,139 | $1.51 | 7d | 6 | 1.19mi |
| 117 Thayer Ave SE Atlanta, GA | 3.0 | 1.0 | 1241 | $1,666 | $1.34 | 14d | 1 | 1.19mi |
| 880 Glenwood Ave SE Atlanta, GA | 1.0–2.0 | 1.0–2.0 | 942 | $1,925 | $2.04 | 1d | 12 | 1.19mi |
Listing history 22 events
-
2026-06-15days on market $309,750 Active 110 DOM
-
2026-06-13days on market $309,750 Active 108 DOM
-
2026-06-13days on market $309,750 Active 107 DOM
-
2026-06-09days on market $309,750 Active 104 DOM
-
2026-06-08days on market $309,750 Active 103 DOM
-
2026-06-07days on market $309,750 Active 102 DOM
-
2026-06-04days on market $309,750 Active 99 DOM
-
2026-06-03days on market $309,750 Active 98 DOM
-
2026-06-02days on market $309,750 Active 97 DOM
-
2026-06-01days on market $309,750 Active 96 DOM
-
2026-05-31days on market $309,750 Active 95 DOM
-
2026-04-17historical
-
2026-04-13price $309,750 611-char remark
Show marketing remark (611 chars)
Teardown on Level Lot with great Opportunity to build Intown Primary Residence or Income Producing Property! Located within walking distance to the Southside BeltLine Trail, Grant Park, Chosewood Park, Benteen Park and the vibrant East Atlanta area. Minutes from new shopping and restaurants along the Memorial Drive Corridor. This property is a strong value play surrounded by ongoing new development and new $1M+ Custom Homes. Survey in FMLS Docs and Showingtime. We have a Full Set of Architectural Plans for a Single Family Modern Home prepared by Reuden Group that we are happy to include with the sale.
-
2026-02-25$309,900 New
Show marketing remark (611 chars)
Teardown on Level Lot with great Opportunity to build Intown Primary Residence or Income Producing Property! Located within walking distance to the Southside BeltLine Trail, Grant Park, Chosewood Park, Benteen Park and the vibrant East Atlanta area. Minutes from new shopping and restaurants along the Memorial Drive Corridor. This property is a strong value play surrounded by ongoing new development and new $1M+ Custom Homes. Survey in FMLS Docs and Showingtime. We have a Full Set of Architectural Plans for a Single Family Modern Home prepared by Reuden Group that we are happy to include with the sale.
-
2026-02-25$309,900 Active 611-char remark
Show marketing remark (611 chars)
Teardown on Level Lot with great Opportunity to build Intown Primary Residence or Income Producing Property! Located within walking distance to the Southside BeltLine Trail, Grant Park, Chosewood Park, Benteen Park and the vibrant East Atlanta area. Minutes from new shopping and restaurants along the Memorial Drive Corridor. This property is a strong value play surrounded by ongoing new development and new $1M+ Custom Homes. Survey in FMLS Docs and Showingtime. We have a Full Set of Architectural Plans for a Single Family Modern Home prepared by Reuden Group that we are happy to include with the sale.
-
2022-02-11soldstatus $260,000
-
2022-01-23price $2,260
-
2022-01-18historical
-
2021-09-16$315,000 New
-
1987-06-29soldstatus $29,900
-
1987-03-01soldstatus $35,000
-
1987-03-01soldstatus $35,000
ⓘ Source: listings_history table (triggers on properties + properties_extension) + one-shot
backfill from property_details.listing_events for pre-trigger history.
Tax reassessment forecast GA · Resets to sale price
- Current annual tax
- $5,601 · $467/mo
- Projected year-2 tax
- $5,601 · $467/mo
- Expected delta
- $0/yr ($0/mo · 0.0%)
ⓘ Screening estimate from a state-policy table — verify with the county assessor before closing.
Climate risk First Street
- Flood 1/10 Low FEMA zone X (unshaded) · 0% chance over 30 yrs
- Wildfire 1/10 Low
- Heat 5/10 Major 7 d/yr ≥105°F today · 18 d/yr by 30 yrs out
- Wind 6/10 Major 27% chance of damaging wind over 30 yrs
- Air quality 4/10 Moderate 4 unhealthy d/yr today · 6 by 30 yrs out
Nearby sold comps map
Loading sold comps map…
Walkable amenities ~0.75 mi
Loading nearby amenities…
Taxation est. · year 1
- Rental income
- $30,378
- − Mortgage interest
- −$17,351
- − Property taxes
- −$5,601
- − Insurance
- −$1,549
- − Repairs & maintenance
- −$2,430
- − Management
- −$2,430
- − Depreciation
- −$9,011
- Taxable loss
- −$7,995
- Est. tax savings @ 24.0%
- +$1,919
- After-tax cash flow
- $-725/yr
For passive investors: Depreciation is non-cash, so a rental often shows a tax loss while cash-flowing — sheltering income. Rental losses are passive: they offset passive income freely, and up to $25,000/yr can offset ordinary (W-2) income if you actively participate and your MAGI is under $100k (phasing out to $0 by $150k); unused losses carry forward. On sale, claimed depreciation is recaptured at up to 25%, and gains may owe capital-gains tax (a 1031 exchange can defer both). Figures are a year-1 estimate at your 24.0% rate — not tax advice; consult a CPA.
Schools (NCES district)
- District
- Atlanta Public Schools
- NCES district ID
- 1300120
- Math proficiency
- 28% ▼ -6.00%
- Reading proficiency
- 35% ▼ -2.00%
- Median HH income
- $48,306
- Composite
- 27.27/100
- National rank
- #7006
- State rank
- #80 of 174 in GA
Livability — Atlanta
- Score
- 83/100
- State rank
- #6
- US rank
- #919
Category grades
Schools grade is shown separately in the Schools card above.
Census & demographics
- Census place
- Atlanta, GA
- County
- Fulton County · 1,094,430 people
- City population
- 629,525
- Metro
- Atlanta-Sandy Springs-Alpharetta, GA
- Population (ZIP)
- 26,942
- Household income
- $82,779
- Rent vs Own
- Severe rent burden
- 2010.0
Population outlook (Fulton County) Hauer SSP2
- Today (2025)
- 1,203,707 people
- By 2030
- 1,299,706 · +8.0%
- By 2040
- 1,488,256 · +23.6%
- By 2050
- 1,664,580 · +38.3%
- By 2075
- 2,036,072 · +69.2%
- By 2100
- 2,222,402 · +84.6%
Race, ethnicity, and origin ACS 2023
- Neighborhood character
- Diverse neighborhood (Simpson 0.62)
- Race & ethnicity
- Black 46% White 41% Hispanic / Latino 6% Two or more races 5% Asian 4%
- Hispanic origin (detail)
- Mexican 2%
- Common ancestry
- Romanian 2% Lithuanian 1% Slovak 1%
- Foreign-born
- 9% · Canada
- Languages at home
- 88% English-only · Spanish 5% Other Indo-European 1% Chinese 1%
Political lean MEDSL · Fulton
- 2024 margin
- Solid D (+44.9) · D 71.9% · R 27.0% · Other 1.1%
- 2008→2024 swing
- +9.8pp toward D · 2008: 35.0pp · 2024: 44.9pp
- All cycles
- 2024: D+44.9 2020: D+46.4 2016: D+42.1 2012: D+29.6 2008: D+35.0
Not yet ingested
- Civics
- —
Market trends
- HPI YoY
- ▼ -507.19%
- Current HPI
- 240.8692
- Rent YoY
- ▲ 2.84%
- Metro
- Atlanta-Sandy Springs-Alpharetta, GA
- State GDP YoY
- ▲ 2.66%
- F500 in state
- 28
Industry mix (Fortune 500 HQ in GA)
| Industry | F500 HQs | Revenue |
|---|---|---|
| Paper / Packaging | 2 | $29B |
|
||
| Retail | 1 | $160B |
|
||
| Transportation / Logistics | 1 | $91B |
|
||
| Airlines | 1 | $62B |
|
||
| Consumer Goods | 1 | $47B |
|
||
| Utilities | 1 | $25B |
|
||
Price history
+785.0% since first listed11 events — show timeline
- 2026-04-17 Listing Removed — GAMLS
- 2026-04-13 Price Changed $309,750 FMLS
- 2026-02-25 Listed $309,900 FMLS
- 2026-02-25 Listed $309,900 GAMLS
- 2022-02-11 Sold (Public Records) $260,000 Public Records
- 2022-01-23 Price Changed $2,260 RENT.
- 2022-01-18 Listing Removed — GAMLS
- 2021-09-16 Listed $315,000 GAMLS
- 1987-06-29 Sold (Public Records) $29,900 Public Records
- 1987-03-01 Sold (Public Records) $35,000 Public Records
- 1987-03-01 Sold (Public Records) $35,000 Public Records
Property tax history
+15.6%/yrLatest (2025): $5,601 · -3.2% YoY. Source: county tax records.
Cash-flow waterfall
monthlySold comps — $/sqft
last 12 mo · ≤1 miLoading sold comps…