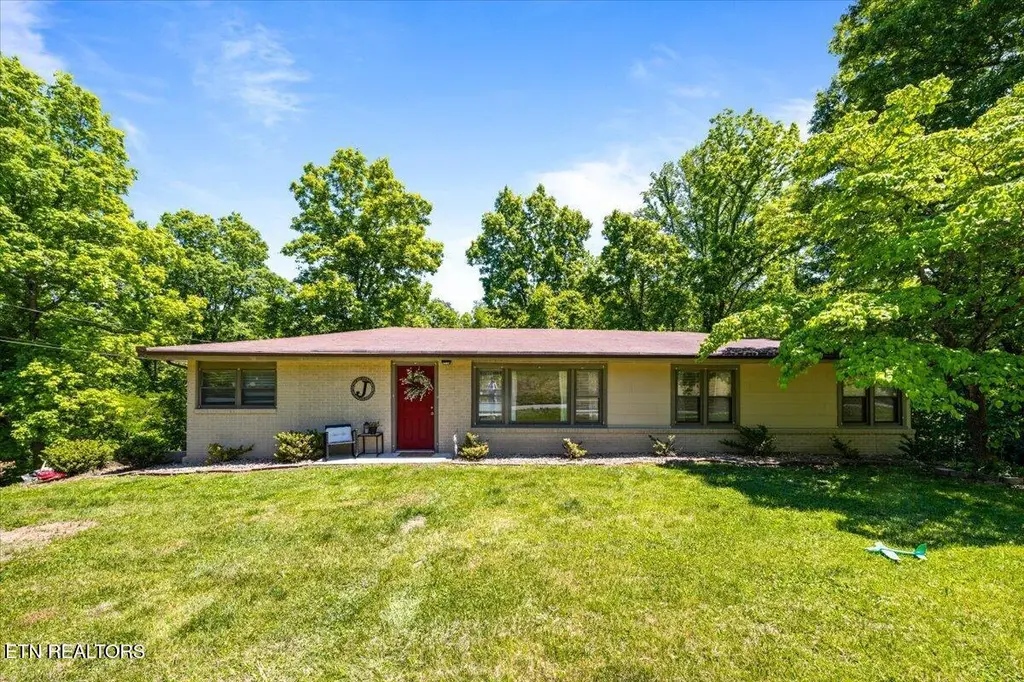
905 Pinecrest Rd · Caryville, TN
Flood risk 1/10 · Minimal
- FEMA flood zone
- X
- Chance of flooding over 30 yrs
- 0.0%
- Est. flood insurance / yr
- $507 – $1,088
Fire risk 6/10 · Moderate
- Est. fire insurance / yr
- $949 – $1,763
Heat risk 4/10 · Minor
- Hot days now (above 102°F)
- 6 days/yr
- Hot days in 30 yrs
- 17 days/yr
Wind risk 2/10 · Minimal
- Chance of severe wind over 30 yrs
- 3.0%
Air-quality risk 3/10 · Minor
- Unhealthy air days now
- 3 days/yr
- Unhealthy air days in 30 yrs
- 3 days/yr
Risk factors via First Street. Map © Google.
Why this score? — see what drove the B grade
The composite is a weighted blend of 9 inputs, each scored 0–100. Each bar is that input's sub-score; the figure is the points it added to the 100-point composite (weight × sub-score).
- Cash flow +23.0/30.0
- ARV discount +15.0/15.0
- Appreciation +10.0/10.0
- DSCR +7.4/10.0
- 1% rule +5.0/10.0
- Livability +3.2/5.0
- Rent growth +2.5/5.0
- Condition / age +2.5/5.0
- Schools +1.6/10.0
$235,000
🖨 Deal sheet (PDF) 📄 Offer letter ✓ Due diligence
Listing remarks
Heads up if you are looking for a move in ready Jacksboro home that is priced to move! This 3 bedroom 3 bath is only 7 min from downtown Jacksboro and 3 miles from Norris Lake access. Home has no stairs, brick ranch style front with picture window, updated interior, private lot, and an hvac that is only 2 years old. The walk in crawlspace offers tons of space for extra storage. Home is eligible for all first time home buyer friendly loans such as FHA, USDA, or THDA. Home is close to ATV access, 10 min from Cove Lake State Park, 8 min from Norris Lake access, and 40 min from downtown Knox. Don't wait schedule your showing today! This property is being sold as is.
Key facts
- Atv access
- Private lot
- Brick ranch style
Tags
Property features AI
Exterior
- Parking: Off-street parking
- Utilities: Septic tank
- Home design: Single-family (not attached); 1,432 sq. ft. building area
- Construction: Wood siding and brick exterior
- Exterior features: Vinyl windows; Private lot; Rolling slope; Mountain view; Country setting
Interior
- Kitchen: Microwave; Refrigerator; Eat-in kitchen layout; Pantry
- Flooring: Laminate flooring; Hardwood flooring; Vinyl flooring
- Bathrooms: Three full bathrooms
- Heating & cooling: Central heating (electric); Central cooling
- Interior features: Walk-in closets; Pantry; Eat-in kitchen; Six total rooms
Neighborhood map
What this means for you Summary
Snapshot
- This is a 3-bed/2.0-bath single-family listed at $235k.
Deal economics
- At list price, monthly cash flow is $417 ($5k/yr) — positive.
- The deal already cash-flows at list — no discount required.
- To meet the 1% rule (rent ≥ 1% of price), the offer needs to be $234k (0.4% below list).
- Recommended offer: $228k (3.0% below list) — sets the bar for market timing.
- Cap rate 8.4% vs local median 2.1% in Caryville — top-decile yield for the area; either an underpriced asset or a hidden risk that comps aren't pricing in. Stress-test before assuming the spread holds.
Location & tenants
- Location reads 63/100 on livability (#184 in TN) — a middle-class / working-renter tenant base. Strengths: cost of living A+, housing A+; Watch: amenities F, commute F, employment F.
- Campbell County (rural): math 19% / reading 20% proficiency, ranked #120 of 139 in TN (top 86%) — low school quality limits family demand, transient renter base, plan for 1-2y turnover; 64% free/reduced lunch — lower-income household profile, screen leases tightly.
- Zoned schools: Jacksboro Elementary (math 43% / reading 31%, grade F, #272 of 952 statewide, top 31%, 650 students, 0% FRL); Jacksboro Middle School (math 28% / reading 23%, grade F, #147 of 333 statewide, top 45%, 493 students, 0% FRL); Campbell County Comprehensive High School (math 12% / reading 24%, grade F, #212 of 332 statewide, top 64%, 1,242 students, 0% FRL) — zoned schools average 0% FRL vs 64% district-wide (64 pts lower); this property's tenant base skews higher-income than the district average.
- Market conditions: 92 active listings in the ZIP; 1 comparable units currently listed for rent nearby; 111 units permitted in Campbell County in 2024 (0 in 5+ unit buildings).
Forward outlook
- In year one you build about $25k of equity ($2k loan paydown + $24k appreciation (10.0% local appreciation)).
- Campbell County population projected at -21% by 2050 — secular population decline; favor cash flow + early exit over multi-decade hold.
- At projected returns (10.0% appreciation + 3.0% rent growth), your $66k cash investment doubles in ~3 years — after that, you're playing with house money.
- By year 2, paydown + projected appreciation supports a ~$40k cash-out refi (75% LTV) — recoverable capital for the next deal without selling this one.
Negotiation context
- It's been on market 47 days — a 3% lower offer ($228k) is reasonable based on typical stale-listing flexibility.
Risks & watch-outs
- Climate carrying-cost: major wildfire risk — expect insurance premiums to compound above CPI over the hold.
Questions for the listing agent
- It's been on market 47 days. Have you received any prior offers? Is the seller open to a 3% concession, seller financing, or rate buy-down credit?
- Built in 1965 — when were the roof, HVAC, electrical panel, plumbing, and water heater last replaced?
- Is there a deadline driving the sale (1031 exchange, divorce, estate, relocation)? That informs how much negotiation room exists.
- Schools are F-rated, which usually means shorter tenancies and higher turnover. Who's the typical renter profile here, and what's been the actual vacancy rate?
- What's the average days-on-market for RENTAL listings here right now (not sales)? A rising rental-DOM trend means longer vacancies and softer asking-rent achievability than the comps imply.
- What's the recent tenant-quality profile in this submarket — average credit score on applications, eviction rate, late-payment / NSF rate, and stable-employment percentage? A property-management company in the area should have these aggregated.
- How much new for-sale + rental construction is in the pipeline within 1–3 miles? Heavy new supply typically softens prices + rents 12–24 months out; constrained supply supports both.
Investment metrics
- 1% rule
- 1.00% ✗
- Cap rate
- 8.42%
- Cash-on-cash
- 7.60%
- DSCR
- 1.34
- GRM
- 8.4
CMA / ARV
- ARV (on-the-fly)
- $442,540
- Comps found
- 2
Show comp detail 2 sales within ~0.75 mi
| Address | Dist | Beds/Ba | Sqft | Sold | Price | $/sf | Match |
|---|---|---|---|---|---|---|---|
| 150 Mercury Ln | 0.43mi | 3/2.0 | 2,240 (+3%) | 15mo | $270,000 | $121 | 63 |
| 268 Gail Ln | 0.59mi | 3/2.0 | 2,024 (-7%) | 20mo | $409,900 | $203 | 44 |
Match score weights: distance 35% · size 25% · config 20% · recency 20%. Top-matched comps best support the ARV.
Projected returns pro-forma
10.0% appreciation · 3.0% rent growth · sell at horizon
- IRR
- 29.8%
- Equity multiple
- 3.35×
- Total profit
- $154,462
- Equity at exit
- $211,707
- IRR
- 25.8%
- Equity multiple
- 7.59×
- Total profit
- $433,816
- Equity at exit
- $456,553
Cash invested: $65,800 (down + closing). Projections, not guarantees.
Landlord ↔ Tenant lean methodology
- Overall (STATE)
- 87 Strongly Landlord-Friendly
- State Tennessee
- 87 Strongly Landlord-Friendly · R+13
- County
- — inherits STATE
- City
- — inherits STATE
ZIP-level market 37757
- Home prices YoY
- 6.8%
- Active inventory
- 92
- Price-to-rent
- 8.4×
Monthly cashflow live
- Estimated rent
- $2,340 medium interval (Pro) →
- Mortgage (P&I)
- −$1,232
- Tax from tax record
- −$101 /mo · $1,216/yr
- Insurance
- −$98
- HOA
- −$0
- Vacancy / Maint / Mgmt
- −$491
- Net cashflow
- $417
Break-even live
Sensitivity live
| Price | -10% $550 | -5% $483 | +0% $417 | +5% $350 | +10% $284 |
|---|---|---|---|---|---|
| Rent | -10% $232 | -5% $325 | +0% $417 | +5% $509 | +10% $602 |
| Rate | -1.0pp $535 | -0.5pp $477 | base $417 | +0.5pp $356 | +1.0pp $294 |
UW: 25.0% down · 7.5% · 30yr · 1.5% tax · 5.0% vac · 8.0% maint · 8.0% mgmt
Financing live
Cash to close
- Down payment
- $58,750
- Closing costs
- $7,050
- Reserves months
- —
- Total cash needed
- —
Loan-product check · same deal, 3 products live
Conventional
25% down · 7.5% · 30yr
- Down + closing
- —
- Monthly P&I
- —
- Monthly cashflow
- —
- DSCR
- —
- Eligible?
- —
Personal DTI + credit; lowest rate.
DSCR
20% down · 8.5% · 30yr
- Down + closing
- —
- Monthly P&I
- —
- Monthly cashflow
- —
- DSCR
- —
- Eligible?
- —
No personal income docs; deal must DSCR.
Hard money
10% down · 12.0% · 12mo
- Down + closing
- —
- Monthly P&I
- —
- Monthly cashflow
- —
- DSCR
- —
- Eligible?
- —
Short-term bridge; refi at stabilization.
Rent comps 1 comps
| Address | Beds | Baths | Sqft | Rent | $/sqft | DOM | Units | Dist |
|---|---|---|---|---|---|---|---|---|
| 178 Sycamore Dr Jacksboro, TN | 3.0 | 2.0 | 2076 | $2,340 | $1.13 | 20d | 1 | 1.40mi |
Listing history 18 events
-
2026-06-21days on market $235,000 Active 47 DOM
-
2026-06-18days on market $235,000 Active 45 DOM
-
2026-06-17days on market $235,000 Active 44 DOM
-
2026-06-16days on market $235,000 Active 43 DOM
-
2026-06-15days on market $235,000 Active 42 DOM
-
2026-06-13days on market $235,000 Active 40 DOM
-
2026-06-12remarks 670-char remark
-
2026-06-12days on market $235,000 Active 39 DOM
-
2026-06-09pricedays on market $235,000 Active 36 DOM
-
2026-06-08days on market $249,900 Active 35 DOM
-
2026-06-08days on market $249,900 Active 34 DOM
-
2026-06-07days on market $249,900 Active 33 DOM
-
2026-06-04days on market $249,900 Active 30 DOM
-
2026-06-02days on market $249,900 Active 29 DOM
-
2026-06-01days on market $249,900 Active 28 DOM
-
2026-05-31days on market $249,900 Active 27 DOM
-
2026-05-17price $249,900
-
2026-05-04$254,900 Active
ⓘ Source: listings_history table (triggers on properties + properties_extension) + one-shot
backfill from property_details.listing_events for pre-trigger history.
Tax reassessment forecast TN · Resets to sale price
- Current annual tax
- $1,216 · $101/mo
- Projected year-2 tax
- $1,668 · $139/mo
- Expected delta
- +$452/yr (+$38/mo · 37.2%)
ⓘ Screening estimate from a state-policy table — verify with the county assessor before closing.
Climate risk First Street
- Flood 1/10 Low FEMA zone X · 0% chance over 30 yrs
- Wildfire 6/10 Major
- Heat 4/10 Moderate 6 d/yr ≥102°F today · 17 d/yr by 30 yrs out
- Wind 2/10 Low 3% chance of damaging wind over 30 yrs
- Air quality 3/10 Moderate 3 unhealthy d/yr today · 3 by 30 yrs out
Nearby sold comps map
Loading sold comps map…
Walkable amenities ~0.75 mi
Loading nearby amenities…
Taxation est. · year 1
- Rental income
- $28,080
- − Mortgage interest
- −$13,164
- − Property taxes
- −$1,216
- − Insurance
- −$1,175
- − Repairs & maintenance
- −$2,246
- − Management
- −$2,246
- − Depreciation
- −$6,836
- Taxable income
- $1,196
- Est. tax owed @ 24.0%
- −$287
- After-tax cash flow
- $4,717/yr
For passive investors: Depreciation is non-cash, so a rental often shows a tax loss while cash-flowing — sheltering income. Rental losses are passive: they offset passive income freely, and up to $25,000/yr can offset ordinary (W-2) income if you actively participate and your MAGI is under $100k (phasing out to $0 by $150k); unused losses carry forward. On sale, claimed depreciation is recaptured at up to 25%, and gains may owe capital-gains tax (a 1031 exchange can defer both). Figures are a year-1 estimate at your 24.0% rate — not tax advice; consult a CPA.
Schools (NCES district)
- District
- Campbell County
- NCES district ID
- 4700420
- Math proficiency
- 19% ▼ -9.00%
- Reading proficiency
- 20% ▼ -6.00%
- Median HH income
- $32,606
- Composite
- 15.84/100
- National rank
- #9262
- State rank
- #120 of 139 in TN
Livability — Caryville
- Score
- 63/100
- State rank
- #184
- US rank
- #14954
Category grades
Schools grade is shown separately in the Schools card above.
Census & demographics
- Population (ZIP)
- 10,515
Population outlook (Campbell County) Hauer SSP2
- Today (2025)
- 37,507 people
- By 2030
- 35,989 · -4.0%
- By 2040
- 32,773 · -12.6%
- By 2050
- 29,475 · -21.4%
- By 2075
- 21,972 · -41.4%
- By 2100
- 15,332 · -59.1%
Race, ethnicity, and origin ACS 2023
- Neighborhood character
- Predominantly White (97%)
- Race & ethnicity
- White 97% Two or more races 1%
- Common ancestry
- Slovak 3% Italian 3% Serbian 1%
- Foreign-born
- 1% · China
- Languages at home
- 99% English-only · Spanish 1%
Political lean MEDSL · Campbell
- 2024 margin
- Solid R (+69.6) · D 14.8% · R 84.5%
- 2008→2024 swing
- -32.7pp toward R · 2008: -37.0pp · 2024: -69.6pp
- All cycles
- 2024: R+69.6 2020: R+66.2 2016: R+60.9 2012: R+43.6 2008: R+37.0
Not yet ingested
- Civics
- —
Market trends
- HPI YoY
- ▲ 22.88%
- Current HPI
- 360.3957
- Rent YoY
- —
- Metro
- —
- State GDP YoY
- ▲ 2.78%
- F500 in state
- 22
Industry mix (Fortune 500 HQ in TN)
| Industry | F500 HQs | Revenue |
|---|---|---|
| Healthcare | 3 | $91B |
|
||
| Retail | 3 | $72B |
|
||
| Transportation / Logistics | 1 | $88B |
|
||
| Paper / Packaging | 1 | $19B |
|
||
| Insurance | 1 | $13B |
|
||
| Energy | 1 | $12B |
|
||
Price history
-2.0% since first listed2 events — show timeline
- 2026-05-17 Price Changed $249,900 Knoxville MLS
- 2026-05-04 Listed $254,900 Knoxville MLS
Property tax history
+3.6%/yrLatest (2025): $1,216 · +0.0% YoY. Source: county tax records.
Cash-flow waterfall
monthlySold comps — $/sqft
last 12 mo · ≤1 miLoading sold comps…