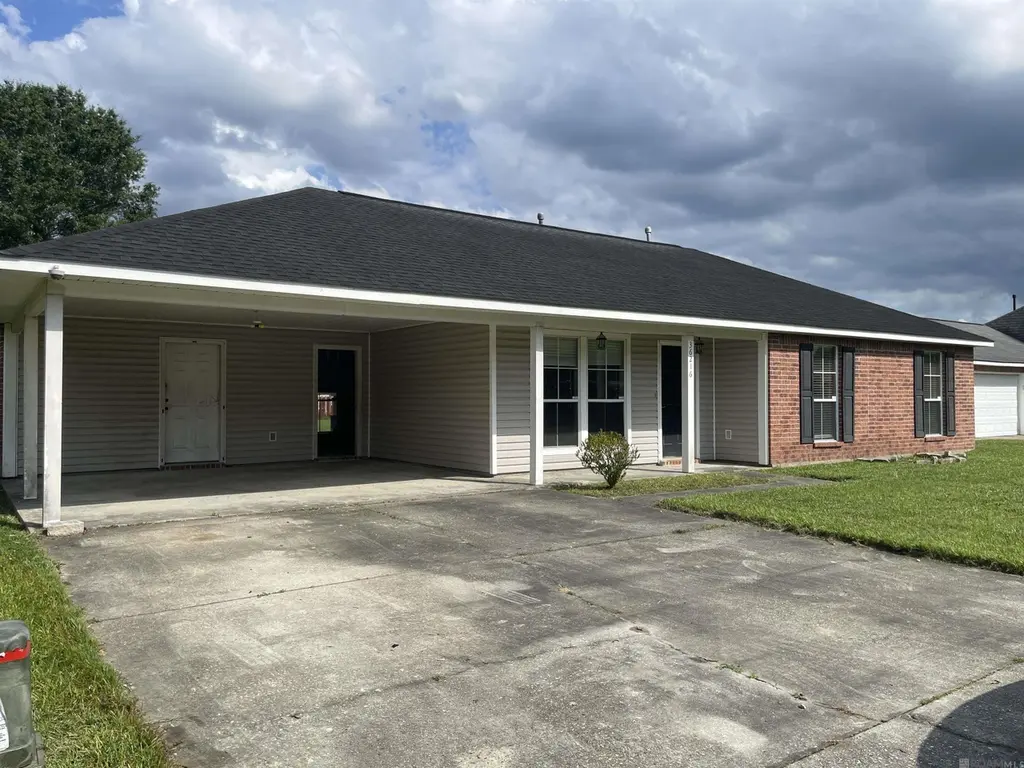
36216 Lynchburg Dr · Watson, LA
Flood risk 4/10 · Minor
- FEMA flood zone
- X (unshaded)
- Chance of flooding over 30 yrs
- 0.2%
- Est. flood insurance / yr
- $507 – $1,088
Fire risk 2/10 · Minimal
- Est. fire insurance / yr
- $1,269 – $2,357
Heat risk 8/10 · Major
- Hot days now (above 108°F)
- 7 days/yr
- Hot days in 30 yrs
- 21 days/yr
Wind risk 9/10 · Severe
- Chance of severe wind over 30 yrs
- 99.0%
Air-quality risk 3/10 · Minor
- Unhealthy air days now
- 2 days/yr
- Unhealthy air days in 30 yrs
- 3 days/yr
Risk factors via First Street. Map © Google.
Why this score? — see what drove the C- grade
The composite is a weighted blend of 9 inputs, each scored 0–100. Each bar is that input's sub-score; the figure is the points it added to the 100-point composite (weight × sub-score).
- Cash flow +15.6/30.0
- ARV discount +13.9/15.0
- DSCR +4.8/10.0
- 1% rule +4.0/10.0
- Schools +4.0/10.0
- Livability +3.6/5.0
- Rent growth +2.5/5.0
- Condition / age +2.5/5.0
- Appreciation +0.0/10.0
$180,405
🖨 Deal sheet 📄 Offer letter ✓ Due diligence
Listing remarks MLS
Discover the potential in this wonderful 3 bedroom, 2 bath home offering 1293 sqft of living space on a large 1/3 acre lot in the heart of Crestwood in Denham Springs. . Covered patio off the back of the home offers plenty of space for outdoor entertaining or enjoying the peaceful privacy fenced back yard.
Key facts
- Large lot
- Covered patio
- 0.3 acre lot
Tags
Neighborhood map
What this means for you Summary
Snapshot
- This is a 3-bed/2.0-bath single-family listed at $180k.
Deal economics
- At list price, monthly cash flow is $75 ($899/yr) — positive.
- The deal already cash-flows at list — no discount required.
- To meet the 1% rule (rent ≥ 1% of price), the offer needs to be $162k (10.1% below list).
- Recommended offer: $162k (10.1% below list) — sets the bar for 1% rule.
- Cap rate 6.8% vs local median 4.8% in Watson — top-decile yield for the area; either an underpriced asset or a hidden risk that comps aren't pricing in. Stress-test before assuming the spread holds.
Location & tenants
- Location reads 71/100 on livability (#50 in LA) — a middle-class / working-renter tenant base. Strengths: schools A+, crime A+, employment A+; Watch: amenities F, commute F, health & safety F.
- Livingston Parish (suburban): math 40% / reading 52% proficiency, ranked #13 of 98 in LA (top 13%) — families likely to look elsewhere, expect single-tenant / working-renter base with shorter leases.
- Market conditions: 342 active listings in the ZIP; 2 comparable units currently listed for rent nearby; 794 units permitted in Livingston Parish in 2024 (99 in 5+ unit buildings).
Forward outlook
- Local home prices are declining (-3.0%/yr); year-one equity from $1k of loan paydown is wiped out by about $5k of value loss. Plan a longer hold.
- Livingston County population projected at +27% by 2050 — long-run rental-demand tailwind backs the buy-and-hold thesis.
Negotiation context
- It's been on market 62 days — a 6% lower offer ($170k) is reasonable based on typical stale-listing flexibility.
- 8 sale attempts since 24y ago; this cycle's ask has dropped $9k (5%) from the opening price — seller is motivated, your offer sets the floor, not the list.
- Current owner paid $138k; 31% above their basis — modest negotiation headroom, anchor on the comps not their cost.
Risks & watch-outs
- Climate carrying-cost: severe wind risk, 99% chance of damaging wind over 30y; extreme-heat days projected 7→21/yr by 2055 (HVAC capex compounding) — expect insurance premiums to compound above CPI over the hold.
Questions for the listing agent
- It's been on market 62 days. Have you received any prior offers? Is the seller open to a 10% concession, seller financing, or rate buy-down credit?
- Why hasn't it sold? Are there any deal-killer items the seller is aware of (foundation, flood, title, zoning, code violations)?
- Is there a deadline driving the sale (1031 exchange, divorce, estate, relocation)? That informs how much negotiation room exists.
- Schools are A-rated — typically a magnet for longer-tenancy family renters. What's the average tenant stay here, and is there a school-zone premium baked into asking?
- What's the average days-on-market for RENTAL listings here right now (not sales)? A rising rental-DOM trend means longer vacancies and softer asking-rent achievability than the comps imply.
- What's the recent tenant-quality profile in this submarket — average credit score on applications, eviction rate, late-payment / NSF rate, and stable-employment percentage? A property-management company in the area should have these aggregated.
- How much new for-sale + rental construction is in the pipeline within 1–3 miles? Heavy new supply typically softens prices + rents 12–24 months out; constrained supply supports both.
Investment metrics
- 1% rule
- 0.90% ✗
- Cap rate
- 6.79%
- Cash-on-cash
- 1.78%
- DSCR
- 1.08
- GRM
- 9.3
CMA / ARV
- ARV (median comp)
- $210,200
- List price
- $180,405
- Delta
- -14.17%
- Verdict
- UNDERPRICED
- Comps
- 20 within 1.0 mi
Show comp detail 12 sales within ~0.75 mi
| Address | Dist | Beds/Ba | Sqft | Sold | Price | $/sf | Match |
|---|---|---|---|---|---|---|---|
| 10019 Lexington Dr | 0.20mi | 3/2.0 | 1,285 (-1%) | 3mo | $217,500 | $169 | 87 |
| 36221 Lynchburg Dr | 0.03mi | 3/2.0 | 1,189 (-8%) | 3mo | $207,000 | $174 | 83 |
| 10082 Lexington Dr | 0.18mi | 3/2.0 | 1,341 (+4%) | 10mo | $212,000 | $158 | 77 |
| 36246 Greenville Ave | 0.19mi | 3/2.0 | 1,187 (-8%) | 1mo | $200,000 | $168 | 77 |
| 36287 Greenville Ave | 0.25mi | 3/2.0 | 1,301 (+1%) | 13mo | $224,900 | $173 | 77 |
| 10130 Nashville Ct | 0.12mi | 3/2.0 | 1,203 (-7%) | 9mo | $225,000 | $187 | 76 |
| 10130 Memphis Ct | 0.06mi | 3/2.0 | 1,181 (-9%) | 11mo | $207,000 | $175 | 73 |
| 36101 Greenville Ave | 0.30mi | 3/2.0 | 1,344 (+4%) | 10mo | $233,150 | $173 | 72 |
| 36140 Lynchburg Dr | 0.15mi | 3/2.0 | 1,186 (-8%) | 10mo | $210,000 | $177 | 71 |
| 10004 Asheville Dr | 0.36mi | 3/2.0 | 1,278 (-1%) | 14mo | $225,000 | $176 | 70 |
| 36043 Portsmouth Dr | 0.38mi | 3/2.0 | 1,448 (+12%) | 1mo | $204,900 | $142 | 62 |
| 35646 Melrose Ave | 0.74mi | 3/2.0 | 1,416 (+10%) | 9mo | $218,000 | $154 | 42 |
Match score weights: distance 35% · size 25% · config 20% · recency 20%. Top-matched comps best support the ARV.
Projected returns pro-forma
-3.0% appreciation · 3.0% rent growth · sell at horizon
- IRR
- -13.5%
- Equity multiple
- 0.52×
- Total profit
- $-24,460
- Equity at exit
- $26,899
- IRR
- -4.6%
- Equity multiple
- 0.70×
- Total profit
- $-15,153
- Equity at exit
- $15,598
Cash invested: $50,513 (down + closing). Projections, not guarantees.
Landlord ↔ Tenant lean methodology
- Overall (STATE)
- 90 Strongly Landlord-Friendly
- State Louisiana
- 90 Strongly Landlord-Friendly · R+12
- County
- — inherits STATE
- City
- — inherits STATE
ZIP-level market 70706
- Active inventory
- 342
- Price-to-rent
- 9.3×
Monthly cashflow live
- Estimated rent
- $1,623 medium interval (Pro) →
- Mortgage (P&I)
- −$946
- Tax from tax record
- −$186 /mo · $2,228/yr
- Insurance
- −$75
- HOA
- −$0
- Vacancy / Maint / Mgmt
- −$341
- Net cashflow
- $75
Break-even live
UW: 25.0% down · 7.5% · 30yr · 1.5% tax · 5.0% vac · 8.0% maint · 8.0% mgmt
Financing live
Cash to close
- Down payment
- $45,101
- Closing costs
- $5,412
- Reserves months
- —
- Total cash needed
- —
Loan-product check · same deal, 3 products live
Conventional
25% down · 7.5% · 30yr
- Down + closing
- —
- Monthly P&I
- —
- Monthly cashflow
- —
- DSCR
- —
- Eligible?
- —
Personal DTI + credit; lowest rate.
DSCR
20% down · 8.5% · 30yr
- Down + closing
- —
- Monthly P&I
- —
- Monthly cashflow
- —
- DSCR
- —
- Eligible?
- —
No personal income docs; deal must DSCR.
Hard money
10% down · 12.0% · 12mo
- Down + closing
- —
- Monthly P&I
- —
- Monthly cashflow
- —
- DSCR
- —
- Eligible?
- —
Short-term bridge; refi at stabilization.
Rent comps 2 comps
| Address | Beds | Baths | Sqft | Rent | $/sqft | DOM | Units | Dist |
|---|---|---|---|---|---|---|---|---|
| 10124 Nashville Ct Denham Springs, LA | 3.0 | 2.0 | 1165 | $1,600 | $1.37 | 43d | 1 | 0.17mi |
| 10552 Tumbleweed Dr Denham Springs, LA | 3.0 | 2.0 | 1463 | $1,750 | $1.20 | 43d | 1 | 0.95mi |
Listing history 29 events
-
2026-06-18days on market $180,405 Active 62 DOM
-
2026-06-17days on market $180,405 Active 61 DOM
-
2026-06-16days on market $180,405 Active 60 DOM
-
2026-06-15days on market $180,405 Active 59 DOM
-
2026-06-14days on market $180,405 Active 57 DOM
-
2026-06-13days on market $180,405 Active 56 DOM
-
2026-06-10days on market $180,405 Active 54 DOM
-
2026-06-09days on market $180,405 Active 53 DOM
-
2026-06-08days on market $180,405 Active 52 DOM
-
2026-06-07days on market $180,405 Active 51 DOM
-
2026-06-03days on market $180,405 Active 47 DOM
-
2026-06-02days on market $180,405 Active 46 DOM
-
2026-06-01days on market $180,405 Active 45 DOM
-
2026-05-31days on market $180,405 Active 44 DOM
-
2026-05-31days on market $180,405 Active 43 DOM
-
2026-04-15$189,900 Active 307-char remark
Show marketing remark (306 chars)
Discover the potential in this wonderful 3 bedroom, 2 bath home offering 1293 sqft of living space on a large 1/3 acre lot in the heart of Crestwood in Denham Springs.. Covered patio off the back of the home offers plenty of space for outdoor entertaining or enjoying the peaceful privacy fenced back yard.
-
2026-04-15$189,900 Active 306-char remark
Show marketing remark (306 chars)
Discover the potential in this wonderful 3 bedroom, 2 bath home offering 1293 sqft of living space on a large 1/3 acre lot in the heart of Crestwood in Denham Springs.. Covered patio off the back of the home offers plenty of space for outdoor entertaining or enjoying the peaceful privacy fenced back yard.
-
2016-04-27soldstatus $138,000
-
2016-04-26soldstatus Sold
-
2016-03-16status Pending
-
2016-02-15$139,000 Active
-
2016-02-15$139,000
-
2009-08-11soldstatus
-
2009-08-07soldstatus
-
2008-10-07$126,500
-
2008-10-07$126,500
-
2002-07-29soldstatus
-
2002-01-18$84,800
-
2002-01-18$84,800
ⓘ Source: listings_history table (triggers on properties + properties_extension) + one-shot
backfill from property_details.listing_events for pre-trigger history.
Tax reassessment forecast LA · Resets to sale price
- Current annual tax
- $2,228 · $186/mo
- Projected year-2 tax
- $2,228 · $186/mo
- Expected delta
- $0/yr ($0/mo · 0.0%)
ⓘ Screening estimate from a state-policy table — verify with the county assessor before closing.
Climate risk First Street
- Flood 4/10 Moderate FEMA zone X (unshaded) · 20% chance over 30 yrs
- Wildfire 2/10 Low
- Heat 8/10 Severe 7 d/yr ≥108°F today · 21 d/yr by 30 yrs out
- Wind 9/10 Extreme 99% chance of damaging wind over 30 yrs
- Air quality 3/10 Moderate 2 unhealthy d/yr today · 3 by 30 yrs out
Nearby sold comps map
Loading sold comps map…
Walkable amenities ~0.75 mi
Loading nearby amenities…
Taxation est. · year 1
- Rental income
- $19,471
- − Mortgage interest
- −$10,105
- − Property taxes
- −$2,228
- − Insurance
- −$902
- − Repairs & maintenance
- −$1,558
- − Management
- −$1,558
- − Depreciation
- −$5,248
- Taxable loss
- −$2,128
- Est. tax savings @ 24.0%
- +$511
- After-tax cash flow
- $1,410/yr
For passive investors: Depreciation is non-cash, so a rental often shows a tax loss while cash-flowing — sheltering income. Rental losses are passive: they offset passive income freely, and up to $25,000/yr can offset ordinary (W-2) income if you actively participate and your MAGI is under $100k (phasing out to $0 by $150k); unused losses carry forward. On sale, claimed depreciation is recaptured at up to 25%, and gains may owe capital-gains tax (a 1031 exchange can defer both). Figures are a year-1 estimate at your 24.0% rate — not tax advice; consult a CPA.
Schools (NCES district)
- District
- Livingston Parish
- NCES district ID
- 2201020
- Math proficiency
- 40% ▼ -38.00%
- Reading proficiency
- 52% ▼ -32.00%
- Median HH income
- $56,755
- Composite
- 40.07/100
- National rank
- #3811
- State rank
- #13 of 98 in LA
Livability — Watson
- Score
- 71/100
- State rank
- #50
- US rank
- #7247
Category grades
Schools grade is shown separately in the Schools card above.
Census & demographics
- Population (ZIP)
- 22,621
Population outlook (Livingston County) Hauer SSP2
- Today (2025)
- 158,511 people
- By 2030
- 168,241 · +6.1%
- By 2040
- 186,252 · +17.5%
- By 2050
- 201,516 · +27.1%
- By 2075
- 231,217 · +45.9%
- By 2100
- 241,697 · +52.5%
Race, ethnicity, and origin ACS 2023
- Neighborhood character
- Predominantly White (86%)
- Race & ethnicity
- White 86% Black 6% Hispanic / Latino 5% Two or more races 4%
- Hispanic origin (detail)
- Common ancestry
- Lithuanian 15% Slovak 2% Italian 1%
- Foreign-born
- 1% · Canada, China
Political lean MEDSL · Livingston
- 2024 margin
- Solid R (+68.5) · D 15.1% · R 83.6% · Other 1.3%
- 2008→2024 swing
- +3.4pp toward D · 2008: -71.9pp · 2024: -68.5pp
- All cycles
- 2024: R+68.5 2020: R+70.0 2016: R+72.5 2012: R+70.4 2008: R+71.9
Not yet ingested
- Civics
- —
Market trends
- HPI YoY
- ▼ -88.82%
- Current HPI
- 160.2185
- Rent YoY
- —
- Metro
- —
- State GDP YoY
- ▲ 3.29%
- F500 in state
- 10
Industry mix (Fortune 500 HQ in LA)
| Industry | F500 HQs | Revenue |
|---|---|---|
| Telecommunications | 2 | $23B |
|
||
| Utilities | 1 | $12B |
|
||
| Wholesale / Distribution | 1 | $5B |
|
||
| Advertising | 1 | $2B |
|
||
Price history
+123.9% since first listed14 events — show timeline
- 2026-04-15 Listed $189,900 AcadianaMLS
- 2026-04-15 Listed $189,900 GBRMLS
- 2016-04-27 Sold (Public Records) $138,000 Public Records
- 2016-04-26 Sold (MLS) — GBRMLS
- 2016-03-16 Pending — GBRMLS
- 2016-02-15 Listed $139,000 GBRMLS
- 2016-02-15 Listed $139,000 AcadianaMLS
- 2009-08-11 Sold (Public Records) — Public Records
- 2009-08-07 Sold (MLS) — GBRMLS
- 2008-10-07 Listed $126,500 AcadianaMLS
- 2008-10-07 Listed $126,500 GBRMLS
- 2002-07-29 Sold (MLS) — GBRMLS
- 2002-01-18 Listed $84,800 AcadianaMLS
- 2002-01-18 Listed $84,800 GBRMLS
Property tax history
+4.1%/yrLatest (2024): $2,228 · +18.3% YoY. Source: county tax records.
Cash-flow waterfall
monthlySold comps — $/sqft
last 12 mo · ≤1 miLoading sold comps…