 🔨 Auction
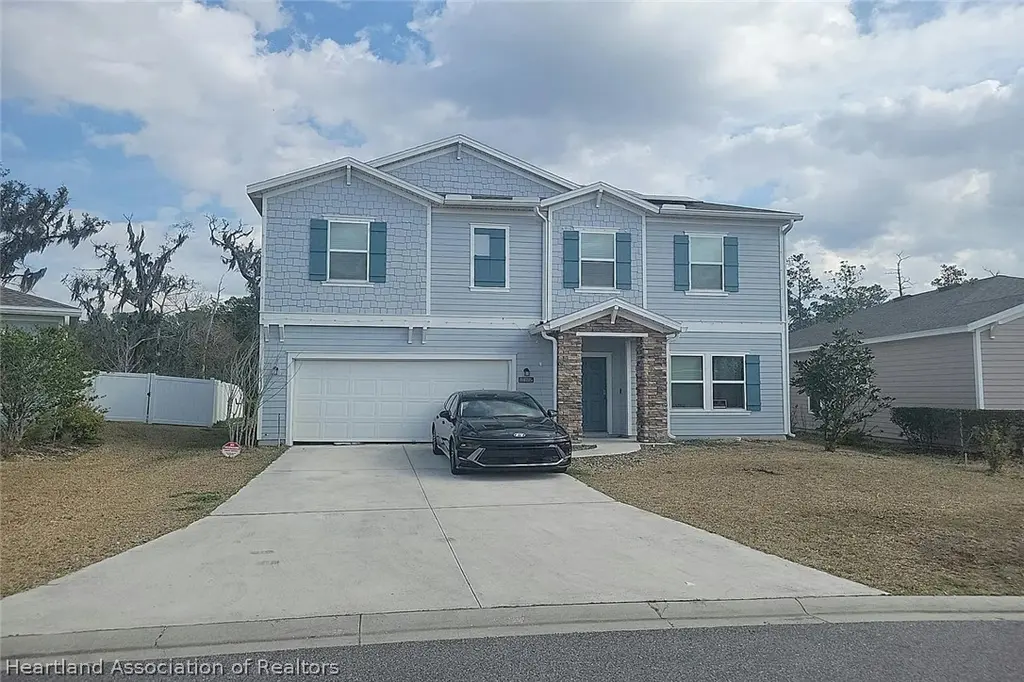
10875 Ventnor Ave · Jacksonville, FL
Flood risk 4/10 · Minor
- FEMA flood zone
- X (unshaded)
- Chance of flooding over 30 yrs
- 0.22%
- Est. flood insurance / yr
- $507 – $1,088
Fire risk 6/10 · Moderate
- Est. fire insurance / yr
- $947 – $1,759
Heat risk 9/10 · Severe
- Hot days now (above 107°F)
- 7 days/yr
- Hot days in 30 yrs
- 19 days/yr
Wind risk 9/10 · Severe
- Chance of severe wind over 30 yrs
- 99.0%
Air-quality risk 4/10 · Minor
- Unhealthy air days now
- 6 days/yr
- Unhealthy air days in 30 yrs
- 6 days/yr
Risk factors via First Street. Map © Google.
Why this score? — see what drove the F grade
The composite is a weighted blend of 9 inputs, each scored 0–100. Each bar is that input's sub-score; the figure is the points it added to the 100-point composite (weight × sub-score).
- ARV discount +7.5/15.0
- Cash flow +7.3/30.0
- Livability +4.2/5.0
- Schools +3.9/10.0
- Condition / age +2.5/5.0
- Rent growth +2.4/5.0
- 1% rule +2.1/10.0
- DSCR +1.5/10.0
- Appreciation +0.0/10.0
$5,000
🖨 Deal sheet 📄 Offer letter ✓ Due diligence
Listing remarks
Foreclosure Auction Ends June 8, 2026 at 11:00 AM EST. Explore this charming 4-bedroom, 2.5-bath residence set in a peaceful and well-located Jacksonville community. The list price is the opening bid for the online auction. Sold As-is. Explore more details and submit your bid through Federa Home App.
Key facts
- 9,148 sq ft lot
- 2 garage spots
- Built 2022
Property features AI
Exterior
- Parking: Garage (2 spaces)
- Utilities: Water: other; Sewer: other
- Home design: Single-family residence; Two levels; Residential property in a PUD
- Construction: Construction materials: see remarks
- Exterior features: Front porch; Other roof
Interior
- Bedrooms: 1 total room (listed as 1 room)
- Flooring: Other
- Bathrooms: 2 full bathrooms; 1 half bathroom
- Heating & cooling: No heating specified; No cooling specified
- Interior features: Front porch; Other flooring
Neighborhood map
What this means for you Summary
Snapshot
- This is a 4-bed/3.0-bath single-family listed at $5k.
Deal economics
- At list price, monthly cash flow is $-487 ($-6k/yr) — negative.
- The deal already cash-flows at list — no discount required.
- Meets the 1% rule at list price ($3k rent vs $5k).
Location & tenants
- Location reads 83/100 on livability (#50 in FL, #911 nationally) — a professional / high-income tenant draw. Strengths: amenities A+, commute A+, housing A+.
- Duval (urban): math 46% / reading 45% proficiency, ranked #48 of 73 in FL (top 66%) — families likely to look elsewhere, expect single-tenant / working-renter base with shorter leases.
- Market conditions: Rents soft (-0.4%/yr); 728 active listings in the ZIP; 11 comparable units currently listed for rent nearby; rentals leasing fast (median 4d on market — plan ~1-2 weeks tenant-placement turnaround); 6,503 units permitted in Duval County in 2024 (1,131 in 5+ unit buildings).
- At $2,622/mo this rent would consume 45% of the median local household income ($70k/yr) (locally 2289% of renters already pay >50% of income on rent) — very limited rent-growth headroom before tenants either downsize or default.
Forward outlook
- Local home prices are declining (-3.0%/yr); year-one equity from $3k of loan paydown is wiped out by about $11k of value loss. Plan a longer hold.
- Duval County population projected at +19% by 2050 — long-run rental-demand tailwind backs the buy-and-hold thesis.
Negotiation context
- Only 10 days on market — expect competitive offers; lowballing is unlikely to land.
Risks & watch-outs
- Watch-outs: property tax is 111.1% of price.
- Climate carrying-cost: severe wind risk, 99% chance of damaging wind over 30y; major wildfire risk; extreme-heat days projected 7→19/yr by 2055 (HVAC capex compounding) — expect insurance premiums to compound above CPI over the hold.
Questions for the listing agent
- What do current leases actually rent for vs. the listed asking? Can we see a recent rent roll and the last 12 months of T-12 income?
- Property tax is high relative to price — has the assessment been appealed recently, and will the sale trigger a re-assessment?
- Is there a deadline driving the sale (1031 exchange, divorce, estate, relocation)? That informs how much negotiation room exists.
- Schools are B-rated — typically a magnet for longer-tenancy family renters. What's the average tenant stay here, and is there a school-zone premium baked into asking?
- The area grade is low — what's the realistic commute time and amenity access for the typical tenant pool here? Any planned neighborhood developments (good or bad) we should know about?
- What's the average days-on-market for RENTAL listings here right now (not sales)? A rising rental-DOM trend means longer vacancies and softer asking-rent achievability than the comps imply.
- What's the recent tenant-quality profile in this submarket — average credit score on applications, eviction rate, late-payment / NSF rate, and stable-employment percentage? A property-management company in the area should have these aggregated.
- How much new for-sale + rental construction is in the pipeline within 1–3 miles? Heavy new supply typically softens prices + rents 12–24 months out; constrained supply supports both.
Investment metrics
- 1% rule
- 0.71% ✗
- Cap rate
- 4.71%
- Cash-on-cash
- -5.64%
- DSCR
- 0.75
- GRM
- 11.8
CMA / ARV
- ARV (on-the-fly)
- $370,206
- Comps found
- 12
Show comp detail 12 sales within ~0.75 mi
| Address | Dist | Beds/Ba | Sqft | Sold | Price | $/sf | Match |
|---|---|---|---|---|---|---|---|
| 10863 Peacock Landing Ct | 0.33mi | 4/2.5 | 2,368 (+0%) | 4mo | $350,000 | $148 | 79 |
| 10950 Osprey Hammock Blvd | 0.48mi | 3/2.5 (-1) | 2,382 (+1%) | 1mo | $349,900 | $147 | 68 |
| 5369 Kellar Cir | 0.28mi | 4/3.0 | 2,006 (-15%) | 0mo | $320,000 | $160 | 62 |
| 11222 Robert Masters Ct | 0.55mi | 4/3.0 | 2,184 (-7%) | 3mo | $330,000 | $151 | 60 |
| 5677 Kellar Cir | 0.37mi | 4/3.0 | 2,006 (-15%) | 1mo | $315,000 | $157 | 57 |
| 5477 Kellar Cir | 0.18mi | 4/3.0 | 2,006 (-15%) | 14mo | $335,000 | $167 | 56 |
| 5628 Kellar Cir | 0.31mi | 3/2.0 (-1) | 2,126 (-10%) | 7mo | $327,000 | $154 | 54 |
| 11234 Robert Masters Ct | 0.58mi | 4/3.0 | 2,556 (+8%) | 10mo | $410,776 | $161 | 51 |
| 10821 Peacock Landing Ct | 0.34mi | 3/2.0 (-1) | 2,128 (-10%) | 13mo | $345,000 | $162 | 48 |
| 11251 Robert Masters Ct | 0.60mi | 3/2.5 (-1) | 2,145 (-9%) | 3mo | $315,000 | $147 | 48 |
| 10928 Copper Hill Dr | 0.57mi | 4/2.0 | 2,036 (-14%) | 10mo | $350,000 | $172 | 39 |
| 10323 Palmetto Bay Rd | 0.68mi | 5/3.0 (+1) | 2,680 (+14%) | 9mo | $310,000 | $116 | 33 |
Match score weights: distance 35% · size 25% · config 20% · recency 20%. Top-matched comps best support the ARV.
Projected returns pro-forma
-3.0% appreciation · 0.0% rent growth · sell at horizon
- IRR
- -29.3%
- Equity multiple
- 0.05×
- Total profit
- $-98,673
- Equity at exit
- $55,199
- IRR
- -48.1%
- Equity multiple
- -0.50×
- Total profit
- $-155,423
- Equity at exit
- $32,009
Cash invested: $103,658 (down + closing). Projections, not guarantees.
Landlord ↔ Tenant lean methodology
- Overall (STATE)
- 87 Strongly Landlord-Friendly
- State Florida
- 87 Strongly Landlord-Friendly · R+3
- County
- — inherits STATE
- City
- — inherits STATE
ZIP-level market 32218
- Home prices YoY
- -25.7%
- Rents YoY
- -0.4%
- Active inventory
- 728
- Price-to-rent
- 0.2×
Monthly cashflow live
- Estimated rent
- $2,622 high interval (Pro) →
- Mortgage (P&I)
- −$1,941
- Tax est. 1.5%
- −$463 /mo · $5,553/yr
- Insurance
- −$154
- HOA
- −$0
- Vacancy / Maint / Mgmt
- −$551
- Net cashflow
- $-487
Break-even live
UW: 25.0% down · 7.5% · 30yr · 1.5% tax · 5.0% vac · 8.0% maint · 8.0% mgmt
Financing live
Cash to close
- Down payment
- $92,552
- Closing costs
- $11,106
- Reserves months
- —
- Total cash needed
- —
Loan-product check · same deal, 3 products live
Conventional
25% down · 7.5% · 30yr
- Down + closing
- —
- Monthly P&I
- —
- Monthly cashflow
- —
- DSCR
- —
- Eligible?
- —
Personal DTI + credit; lowest rate.
DSCR
20% down · 8.5% · 30yr
- Down + closing
- —
- Monthly P&I
- —
- Monthly cashflow
- —
- DSCR
- —
- Eligible?
- —
No personal income docs; deal must DSCR.
Hard money
10% down · 12.0% · 12mo
- Down + closing
- —
- Monthly P&I
- —
- Monthly cashflow
- —
- DSCR
- —
- Eligible?
- —
Short-term bridge; refi at stabilization.
Rent comps 11 comps
| Address | Beds | Baths | Sqft | Rent | $/sqft | DOM | Units | Dist |
|---|---|---|---|---|---|---|---|---|
| 10815 Ventnor Ave Jacksonville, FL | 4.0 | 3.0 | 2006 | $2,950 | $1.47 | 23d | 1 | 0.10mi |
| 10815 Ventnor Ave Jacksonville, FL | 4.0 | 3.0 | 2028 | $2,750 | $1.36 | 4d | 1 | 0.10mi |
| 4334 Woodley Creek Rd Jacksonville, FL | 3.0 | 2.0 | 1634 | $2,100 | $1.29 | 1d | 1 | 0.48mi |
| 10373 Marsh Hawk Dr Jacksonville, FL | 3.0 | 2.0 | 1868 | $2,020 | $1.08 | 3d | 1 | 0.52mi |
| 5008 Bramante Dr Jacksonville, FL | 4.0 | 2.5 | 1866 | $2,175 | $1.17 | 7d | 1 | 0.84mi |
| 5190 Johnson Lake Ct Jacksonville, FL | 4.0 | 2.0 | 2060 | $2,275 | $1.10 | 4d | 1 | 0.92mi |
| 4948 Big Pine Dr Jacksonville, FL | 4.0 | 3.0 | 2184 | $2,185 | $1.00 | 14d | 1 | 1.02mi |
| 11718 Robert Masters Blvd Jacksonville, FL | 3.0 | 2.0 | 1688 | $2,212 | $1.31 | 1d | 42 | 1.39mi |
| 10842 Lydia Estates Dr Jacksonville, FL | 4.0 | 2.0 | 2058 | $2,500 | $1.21 | 21d | 1 | 1.40mi |
| 12069 Bridgehampton Rd Jacksonville, FL | 3.0 | 2.5 | 2256 | $2,516 | $1.12 | 4d | 1 | 1.44mi |
| 9504 Evesham Rd Jacksonville, FL | 4.0 | 2.0 | 1966 | $1,645 | $0.84 | 23d | 1 | 1.44mi |
Listing history 7 events
-
2026-06-07days on market $5,000 Active 10 DOM
-
2026-06-05days on market $5,000 Active 7 DOM
-
2026-06-03days on market $5,000 Active 6 DOM
-
2026-06-02days on market $5,000 Active 5 DOM
-
2026-06-01days on market $5,000 Active 4 DOM
-
2026-05-31days on market $5,000 Active 3 DOM
-
2026-05-28$5,000 Active
ⓘ Source: listings_history table (triggers on properties + properties_extension) + one-shot
backfill from property_details.listing_events for pre-trigger history.
Climate risk First Street
- Flood 4/10 Moderate FEMA zone X (unshaded) · 22% chance over 30 yrs
- Wildfire 6/10 Major
- Heat 9/10 Extreme 7 d/yr ≥107°F today · 19 d/yr by 30 yrs out
- Wind 9/10 Extreme 99% chance of damaging wind over 30 yrs
- Air quality 4/10 Moderate 6 unhealthy d/yr today · 6 by 30 yrs out
Nearby sold comps map
Loading sold comps map…
Walkable amenities ~0.75 mi
Loading nearby amenities…
Taxation est. · year 1
- Rental income
- $31,459
- − Mortgage interest
- −$20,737
- − Property taxes
- −$5,553
- − Insurance
- −$1,851
- − Repairs & maintenance
- −$2,517
- − Management
- −$2,517
- − Depreciation
- −$10,770
- Taxable loss
- −$12,486
- Est. tax savings @ 24.0%
- +$2,997
- After-tax cash flow
- $-2,852/yr
For passive investors: Depreciation is non-cash, so a rental often shows a tax loss while cash-flowing — sheltering income. Rental losses are passive: they offset passive income freely, and up to $25,000/yr can offset ordinary (W-2) income if you actively participate and your MAGI is under $100k (phasing out to $0 by $150k); unused losses carry forward. On sale, claimed depreciation is recaptured at up to 25%, and gains may owe capital-gains tax (a 1031 exchange can defer both). Figures are a year-1 estimate at your 24.0% rate — not tax advice; consult a CPA.
Schools (NCES district)
- District
- Duval
- NCES district ID
- 1200480
- Math proficiency
- 46% ▼ -11.00%
- Reading proficiency
- 45% ▼ -4.00%
- Median HH income
- $48,987
- Composite
- 38.97/100
- National rank
- #4076
- State rank
- #48 of 73 in FL
Livability — Jacksonville
- Score
- 83/100
- State rank
- #50
- US rank
- #911
Category grades
Schools grade is shown separately in the Schools card above.
Census & demographics
- Census place
- Jacksonville, FL
- County
- Duval County · 1,015,274 people
- City population
- 979,034
- Metro
- Jacksonville, FL
- Population (ZIP)
- 72,905
- Household income
- $69,638
- Rent vs Own
- Severe rent burden
- 2289.0
Population outlook (Duval County) Hauer SSP2
- Today (2025)
- 1,013,010 people
- By 2030
- 1,059,228 · +4.6%
- By 2040
- 1,141,439 · +12.7%
- By 2050
- 1,205,258 · +19.0%
- By 2075
- 1,324,282 · +30.7%
- By 2100
- 1,319,620 · +30.3%
Race, ethnicity, and origin ACS 2023
- Neighborhood character
- Diverse neighborhood (Simpson 0.64)
- Race & ethnicity
- Black 48% White 35% Hispanic / Latino 9% Two or more races 8% Asian 2%
- Hispanic origin (detail)
- Mexican 2% Puerto Rican 4%
- Common ancestry
- Slovak 1% Lithuanian 1% Italian 1%
- Foreign-born
- 6% · Canada, Jamaica, Vietnam
- Languages at home
- 89% English-only · Spanish 6% French/Haitian/Cajun 1% Tagalog/Filipino 1%
Political lean MEDSL · Duval
- 2024 margin
- Toss-up / Even · D 48.7% · R 50.1% · Other 1.2%
- 2008→2024 swing
- +0.4pp no change · 2008: -1.9pp · 2024: -1.5pp
- All cycles
- 2024: R+1.5 2020: D+3.8 2016: R+1.5 2012: R+3.6 2008: R+1.9
Not yet ingested
- Civics
- —
Market trends
- HPI YoY
- ▼ -90.73%
- Current HPI
- 262.2329
- Rent YoY
- ▼ -0.40%
- Metro
- Jacksonville, FL
- State GDP YoY
- ▲ 3.28%
- F500 in state
- 36
Industry mix (Fortune 500 HQ in FL)
| Industry | F500 HQs | Revenue |
|---|---|---|
| Industrial Technology | 2 | $29B |
|
||
| Insurance | 2 | $17B |
|
||
| Retail | 1 | $60B |
|
||
| Technology Distribution | 1 | $58B |
|
||
| Homebuilding | 1 | $35B |
|
||
| Technology Manufacturing | 1 | $35B |
|
||
Price history
1 event — show timeline
- 2026-05-28 Listed $5,000 HAOR as distributed by MLS GRID
Property tax history
+37.2%/yrLatest (2025): $5,067 · +0.7% YoY. Source: county tax records.
Cash-flow waterfall
monthlySold comps — $/sqft
last 12 mo · ≤1 miLoading sold comps…