3609 NW Nutwood Ct · Lincoln, NE
Flood risk 1/10 · Minimal
- FEMA flood zone
- X (unshaded)
- Chance of flooding over 30 yrs
- 0.0%
- Est. flood insurance / yr
- $507 – $1,088
Fire risk 1/10 · Minimal
- Est. fire insurance / yr
- $1,161 – $2,155
Heat risk 3/10 · Minor
- Hot days now (above 105°F)
- 7 days/yr
- Hot days in 30 yrs
- 16 days/yr
Wind risk 2/10 · Minimal
- Chance of severe wind over 30 yrs
- —
Air-quality risk 1/10 · Minimal
- Unhealthy air days now
- 0 days/yr
- Unhealthy air days in 30 yrs
- 0 days/yr
Risk factors via First Street. Map © Google.
Why this score? — see what drove the B grade
The composite is a weighted blend of 9 inputs, each scored 0–100. Each bar is that input's sub-score; the figure is the points it added to the 100-point composite (weight × sub-score).
- Cash flow +30.0/30.0
- 1% rule +10.0/10.0
- DSCR +10.0/10.0
- ARV discount +7.3/15.0
- Schools +4.4/10.0
- Livability +4.2/5.0
- Condition / age +3.8/5.0
- Rent growth +3.5/5.0
- Appreciation +0.0/10.0
$45,000
🖨 Deal sheet (PDF) 📄 Offer letter ✓ Due diligence
Key facts
- Built 1988
- Listed 41 days
Property features AI
Finance
- HOA & community: Homeowner association with monthly fee of $650
Exterior
- Parking: No garage
- Utilities: Public water; Public sewer
- Home design: Residential mobile home; Not new (existing unit)
- Construction: Built in 1988; Slab foundation
- Exterior features: Porch; City lot
Interior
- Kitchen: Range; Refrigerator; Dishwasher; Disposal; Microwave
- Bedrooms: Primary bedroom on the main floor; Additional bedrooms on the main floor
- Bathrooms: Two full bathrooms (both on the main level)
- Heating & cooling: Natural gas forced-air heating; Central air conditioning
- Interior features: Range, Refrigerator, Dishwasher, Disposal, Microwave
- Laundry & utility: Washer; Dryer
Neighborhood map
What this means for you Summary
Snapshot
- This is a 3-bed/2.0-bath manufactured listed at $45k. Condition is rated good.
Deal economics
- At list price, monthly cash flow is $356 ($4k/yr) — positive.
- The deal already cash-flows at list — no discount required.
- Meets the 1% rule at list price ($2k rent vs $45k).
- Recommended offer: $44k (3.0% below list) — sets the bar for market timing.
- Cap rate 15.8% vs local median 3.0% in Lincoln — top-decile yield for the area; either an underpriced asset or a hidden risk that comps aren't pricing in. Stress-test before assuming the spread holds.
Location & tenants
- Location reads 85/100 on livability (#5 in NE, #545 nationally) — a professional / high-income tenant draw. Strengths: amenities A+, cost of living A+, housing A+; Watch: crime D+.
- Lincoln Public Schools (urban): math 50% / reading 53% proficiency, ranked #59 of 111 in NE (top 53%) — acceptable for families but not a draw, mixed tenant base, ~2y average lease.
- Zoned schools: Belmont Elementary School (math 34% / reading 44%, grade F, #371 of 502 statewide, top 74%, 814 students, 0% FRL); Goodrich Middle School (math 38% / reading 36%, grade F, #99 of 128 statewide, top 79%, 877 students, 78% FRL); Lincoln Northeast High School (math 34% / reading 36%, grade F, #207 of 261 statewide, top 79%, 1,812 students, 62% FRL).
- Zoned-school proficiency averages 37% at this address vs 52% district-wide (-14 pts) — the specific schools serving this property underperform the Lincoln Public Schools average; the district grade overstates school quality for this exact location.
- Market conditions: Rents rising fast (+4.0%/yr); 366 active listings in the ZIP; 15 comparable units currently listed for rent nearby; rentals at typical pace (median 22d on market — plan ~3-4 weeks tenant-placement turnaround); 47% of comp listings sitting > 30 days — soft ceiling on asking rent; 1,940 units permitted in Lancaster County in 2024 (895 in 5+ unit buildings).
Forward outlook
- Local home prices are declining (-3.0%/yr); year-one equity from $311 of loan paydown is wiped out by about $1k of value loss. Plan a longer hold.
- Lancaster County population projected at +37% by 2050 — long-run rental-demand tailwind backs the buy-and-hold thesis.
- At projected returns (-3.0% appreciation + 4.0% rent growth), your $13k cash investment doubles in ~4 years — after that, you're playing with house money.
Negotiation context
- It's been on market 41 days — a 3% lower offer ($44k) is reasonable based on typical stale-listing flexibility.
Risks & watch-outs
- Watch-outs: HOA is 39% of rent.
Questions for the listing agent
- It's been on market 41 days. Have you received any prior offers? Is the seller open to a 3% concession, seller financing, or rate buy-down credit?
- What does the HOA fee cover, when was the last increase, and are there any pending special assessments or reserve-fund shortfalls?
- Is there a deadline driving the sale (1031 exchange, divorce, estate, relocation)? That informs how much negotiation room exists.
- Schools are A-rated — typically a magnet for longer-tenancy family renters. What's the average tenant stay here, and is there a school-zone premium baked into asking?
- Crime grade is D in this area — have there been break-ins, vandalism, or insurance claims at this property in the last 3 years? What carrier currently insures it and at what premium?
- What's the average days-on-market for RENTAL listings here right now (not sales)? A rising rental-DOM trend means longer vacancies and softer asking-rent achievability than the comps imply.
- What's the recent tenant-quality profile in this submarket — average credit score on applications, eviction rate, late-payment / NSF rate, and stable-employment percentage? A property-management company in the area should have these aggregated.
- How much new for-sale + rental construction is in the pipeline within 1–3 miles? Heavy new supply typically softens prices + rents 12–24 months out; constrained supply supports both.
Investment metrics
- 1% rule
- 3.70% ✓
- Cap rate
- 15.78%
- Cash-on-cash
- 33.89%
- DSCR
- 2.51
- GRM
- 2.2
CMA / ARV
- ARV (median comp)
- $44,817
- List price
- $45,000
- Delta
- 0.41%
- Verdict
- FAIR
- Comps
- 11 within 1.0 mi
Show comp detail 8 sales within ~0.75 mi
| Address | Dist | Beds/Ba | Sqft | Sold | Price | $/sf | Match |
|---|---|---|---|---|---|---|---|
| 3709 NW Ebony Ct | 0.07mi | 3/2.0 | 1,216 (-5%) | 1mo | $57,500 | $47 | 87 |
| 3601 NW Magnolia Ct | 0.05mi | 3/2.0 | 1,216 (-5%) | 10mo | $56,000 | $46 | 81 |
| 3601 NW Orange Ct | 0.05mi | 3/2.0 | 1,216 (-5%) | 11mo | $28,000 | $23 | 80 |
| 3604 NW Lime Ct | 0.07mi | 3/2.0 | 1,216 (-5%) | 18mo | $57,500 | $47 | 74 |
| 3804 NW Gum Ct | 0.14mi | 3/3.0 | 1,184 (-8%) | 8mo | $56,000 | $47 | 70 |
| 3719 NW Fairwood Ct | 0.09mi | 3/2.0 | 1,216 (-5%) | 21mo | $53,000 | $44 | 69 |
| 3627 Northwest Quincy Ct | 0.14mi | 3/2.0 | 1,402 (+10%) | 14mo | $38,000 | $27 | 66 |
| 409 W Treehaven Dr | 0.08mi | 4/2.0 (+1) | 1,456 (+14%) | 11mo | $66,000 | $45 | 59 |
Match score weights: distance 35% · size 25% · config 20% · recency 20%. Top-matched comps best support the ARV.
Projected returns pro-forma
-3.0% appreciation · 4.04% rent growth · sell at horizon
- IRR
- 32.0%
- Equity multiple
- 2.39×
- Total profit
- $17,556
- Equity at exit
- $6,710
- IRR
- 40.4%
- Equity multiple
- 5.25×
- Total profit
- $53,578
- Equity at exit
- $3,891
Cash invested: $12,600 (down + closing). Projections, not guarantees.
Landlord ↔ Tenant lean methodology
- Overall (STATE)
- 83 Strongly Landlord-Friendly
- State Nebraska
- 83 Strongly Landlord-Friendly · R+13
- County
- — inherits STATE
- City
- — inherits STATE
ZIP-level market 68521
- Home prices YoY
- -34.1%
- Rents YoY
- 4.0%
- Active inventory
- 366
- Price-to-rent
- 2.2×
Monthly cashflow live
- Estimated rent
- $1,667 high interval (Pro) →
- Mortgage (P&I)
- −$236
- Tax est. 1.5%
- −$56 /mo · $675/yr
- Insurance
- −$19
- HOA
- −$650
- Vacancy / Maint / Mgmt
- −$350
- Net cashflow
- $356
Break-even live
Sensitivity live
| Price | -10% $387 | -5% $371 | +0% $356 | +5% $340 | +10% $325 |
|---|---|---|---|---|---|
| Rent | -10% $224 | -5% $290 | +0% $356 | +5% $422 | +10% $487 |
| Rate | -1.0pp $378 | -0.5pp $367 | base $356 | +0.5pp $344 | +1.0pp $332 |
UW: 25.0% down · 7.5% · 30yr · 1.5% tax · 5.0% vac · 8.0% maint · 8.0% mgmt
Financing live
Cash to close
- Down payment
- $11,250
- Closing costs
- $1,350
- Reserves months
- —
- Total cash needed
- —
Loan-product check · same deal, 3 products live
Conventional
25% down · 7.5% · 30yr
- Down + closing
- —
- Monthly P&I
- —
- Monthly cashflow
- —
- DSCR
- —
- Eligible?
- —
Personal DTI + credit; lowest rate.
DSCR
20% down · 8.5% · 30yr
- Down + closing
- —
- Monthly P&I
- —
- Monthly cashflow
- —
- DSCR
- —
- Eligible?
- —
No personal income docs; deal must DSCR.
Hard money
10% down · 12.0% · 12mo
- Down + closing
- —
- Monthly P&I
- —
- Monthly cashflow
- —
- DSCR
- —
- Eligible?
- —
Short-term bridge; refi at stabilization.
Rent comps 15 comps
| Address | Beds | Baths | Sqft | Rent | $/sqft | DOM | Units | Dist |
|---|---|---|---|---|---|---|---|---|
| 338 W Irving St Lincoln, NE | 4.0 | 2.0 | 1632 | $1,975 | $1.21 | 22d | 1 | 0.29mi |
| 4441 N 1st St Lincoln, NE | 3.0 | 1.0–2.0 | 853 | $1,780 | $2.09 | 14d | 39 | 0.48mi |
| 2900 N 1st St Lincoln, NE | 2.0–3.0 | 1.0–2.0 | 1061 | $1,395 | $1.31 | 44d | 3 | 0.50mi |
| 2801 NW 1st St Lincoln, NE | 3.0 | 2.0 | 1152 | $1,349 | $1.17 | 44d | 3 | 0.57mi |
| North Pointe Villas Lincoln, NE | 3.0 | 1.0–2.0 | 1022 | $2,266 | $2.22 | 14d | 25 | 0.62mi |
| 2700 N 1st St #2 Lincoln, NE | 2.0 | 1.0 | 897 | $1,095 | $1.22 | 22d | 1 | 0.64mi |
| 535 W Saunders Ave Unit 3 Lincoln, NE | 2.0 | 1.0 | 889 | $945 | $1.06 | 44d | 1 | 0.80mi |
| 4730 Innovation Dr Lincoln, NE | 2.0 | 1.0–2.5 | 873 | $1,800 | $2.06 | 14d | 1 | 0.82mi |
| 2636 N 4th St Unit 2636 Lincoln, NE | 3.0 | 2.0 | 1060 | $1,595 | $1.50 | 44d | 1 | 0.84mi |
| 2635 N 5th St Unit 2635 Lincoln, NE | 3.0 | 2.0 | 1060 | $1,595 | $1.50 | 44d | 1 | 0.86mi |
| 4420 N 7th St Lincoln, NE | 1.0–2.0 | 1.0–2.0 | 881 | $1,092 | $1.24 | 14d | 17 | 1.00mi |
| 5265 NW 12th St Lincoln, NE | 2.0 | 1.0–2.0 | 932 | $1,895 | $2.03 | 14d | 15 | 1.17mi |
| 1151 Elba Ave Lincoln, NE | 3.0 | 1.5 | 1443 | $1,695 | $1.17 | 44d | 1 | 1.18mi |
| 3201 N 12th St Lincoln, NE | 3.0 | 1.0 | 928 | $1,250 | $1.35 | 14d | 1 | 1.19mi |
| 1205 Adams St Lincoln, NE | 2.0 | 1.0 | 875 | $1,350 | $1.54 | 44d | 1 | 1.23mi |
HOA detail
- Monthly dues
- $650 · $7,800/yr
Listing history 16 events
-
2026-06-18days on market $45,000 Active 41 DOM
-
2026-06-17days on market $45,000 Active 40 DOM
-
2026-06-16days on market $45,000 Active 39 DOM
-
2026-06-15days on market $45,000 Active 38 DOM
-
2026-06-14days on market $45,000 Active 36 DOM
-
2026-06-10days on market $45,000 Active 33 DOM
-
2026-06-09days on market $45,000 Active 32 DOM
-
2026-06-08days on market $45,000 Active 31 DOM
-
2026-06-07days on market $45,000 Active 30 DOM
-
2026-06-05days on market $45,000 Active 27 DOM
-
2026-06-03days on market $45,000 Active 26 DOM
-
2026-06-02days on market $45,000 Active 25 DOM
-
2026-06-01days on market $45,000 Active 24 DOM
-
2026-05-31days on market $45,000 Active 23 DOM
-
2026-05-30days on market $45,000 Active 22 DOM
-
2026-05-08$45,000 New 660-char remark
ⓘ Source: listings_history table (triggers on properties + properties_extension) + one-shot
backfill from property_details.listing_events for pre-trigger history.
Climate risk First Street
- Flood 1/10 Low FEMA zone X (unshaded) · 0% chance over 30 yrs
- Wildfire 1/10 Low
- Heat 3/10 Moderate 7 d/yr ≥105°F today · 16 d/yr by 30 yrs out
- Wind 2/10 Low
- Air quality 1/10 Low 0 unhealthy d/yr today · 0 by 30 yrs out
Nearby sold comps map
Loading sold comps map…
Walkable amenities ~0.75 mi
Loading nearby amenities…
Taxation est. · year 1
- Rental income
- $20,002
- − Mortgage interest
- −$2,521
- − Property taxes
- −$675
- − Insurance
- −$225
- − Repairs & maintenance
- −$1,600
- − Management
- −$1,600
- − HOA
- −$7,800
- − Depreciation
- −$1,309
- Taxable income
- $4,272
- Est. tax owed @ 24.0%
- −$1,025
- After-tax cash flow
- $3,244/yr
For passive investors: Depreciation is non-cash, so a rental often shows a tax loss while cash-flowing — sheltering income. Rental losses are passive: they offset passive income freely, and up to $25,000/yr can offset ordinary (W-2) income if you actively participate and your MAGI is under $100k (phasing out to $0 by $150k); unused losses carry forward. On sale, claimed depreciation is recaptured at up to 25%, and gains may owe capital-gains tax (a 1031 exchange can defer both). Figures are a year-1 estimate at your 24.0% rate — not tax advice; consult a CPA.
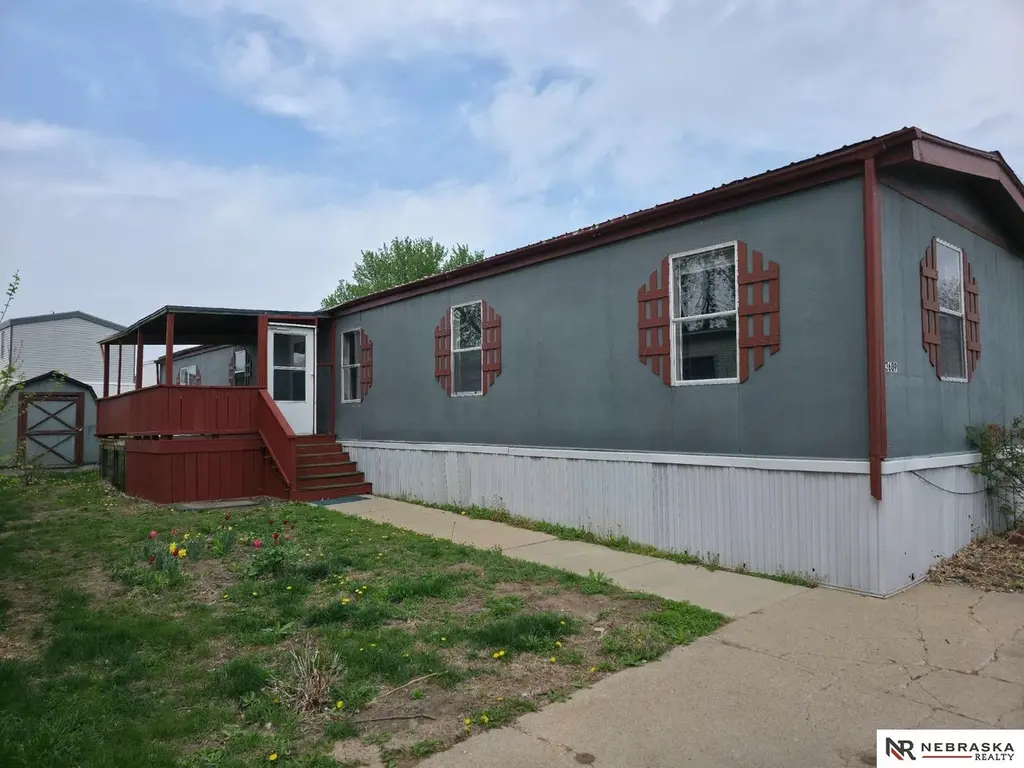
Condition & rehab AI · 5 photos
This manufactured home is in good condition with minor cosmetic improvements needed to enhance its curb appeal and value.
Value-add opportunities
- Resale Paint exterior siding — Enhances curb appeal and value
- Both Replace ceiling fan — Improves air circulation and aesthetics
- Both Landscaping upgrade — Enhances curb appeal and value
- Resale Replace kitchen appliances — Modernizes kitchen and adds value
Renovation cost estimate screening
Value-add ROI direction
- Resale Paint exterior siding — Enhances curb appeal and value ↑
- Both Replace ceiling fan — Improves air circulation and aesthetics ↑
- Both Landscaping upgrade — Enhances curb appeal and value ↑
- Resale Replace kitchen appliances — Modernizes kitchen and adds value ↑
ⓘ Cost ranges are severity-bucket heuristics (US national rule-of-thumb). Get contractor quotes + a written scope before underwriting a rehab budget.
Schools (NCES district)
- District
- Lincoln Public Schools
- NCES district ID
- 3172840
- Math proficiency
- 50% ▼ -6.00%
- Reading proficiency
- 53% ▼ -3.00%
- Median HH income
- $50,273
- Composite
- 44.05/100
- National rank
- #2880
- State rank
- #59 of 111 in NE
Livability — Lincoln
- Score
- 85/100
- State rank
- #5
- US rank
- #545
Category grades
Schools grade is shown separately in the Schools card above.
Census & demographics
- Census place
- Lincoln, NE
- County
- Lancaster County · 291,509 people
- City population
- 291,509
- Metro
- Lincoln, NE
- Population (ZIP)
- 37,050
- Household income
- $67,483
- Rent vs Own
- Severe rent burden
- 1500.0
Population outlook (Lancaster County) Hauer SSP2
- Today (2025)
- 352,806 people
- By 2030
- 377,899 · +7.1%
- By 2040
- 428,582 · +21.5%
- By 2050
- 483,103 · +36.9%
- By 2075
- 632,390 · +79.2%
- By 2100
- 759,513 · +115.3%
Race, ethnicity, and origin ACS 2023
- Neighborhood character
- Predominantly White (70%)
- Race & ethnicity
- White 70% Hispanic / Latino 12% Asian 8% Two or more races 7% Black 5%
- Hispanic origin (detail)
- Mexican 7%
- Common ancestry
- Romanian 2% Arab 2% Italian 2%
- Foreign-born
- 15% · Vietnam, Canada, United Kingdom
- Languages at home
- 78% English-only · Spanish 9% Vietnamese 6% Arabic 3%
Political lean MEDSL · Lancaster
- 2024 margin
- Toss-up / Even · D 51.4% · R 47.1% · Other 1.5%
- 2008→2024 swing
- -0.7pp no change · 2008: 5.0pp · 2024: 4.3pp
- All cycles
- 2024: D+4.3 2020: D+7.8 2016: D+0.1 2012: R+1.0 2008: D+5.0
Not yet ingested
- Civics
- —
Market trends
- HPI YoY
- ▼ -124.30%
- Current HPI
- 239.8394
- Rent YoY
- ▲ 4.04%
- Metro
- Lincoln, NE
- State GDP YoY
- ▲ 0.68%
- F500 in state
- 2
Industry mix (Fortune 500 HQ in NE)
| Industry | F500 HQs | Revenue |
|---|---|---|
| Conglomerate | 1 | $371B |
|
||
Price history
1 event — show timeline
- 2026-05-08 Listed $45,000 GPRMLS
Cash-flow waterfall
monthlySold comps — $/sqft
last 12 mo · ≤1 miLoading sold comps…