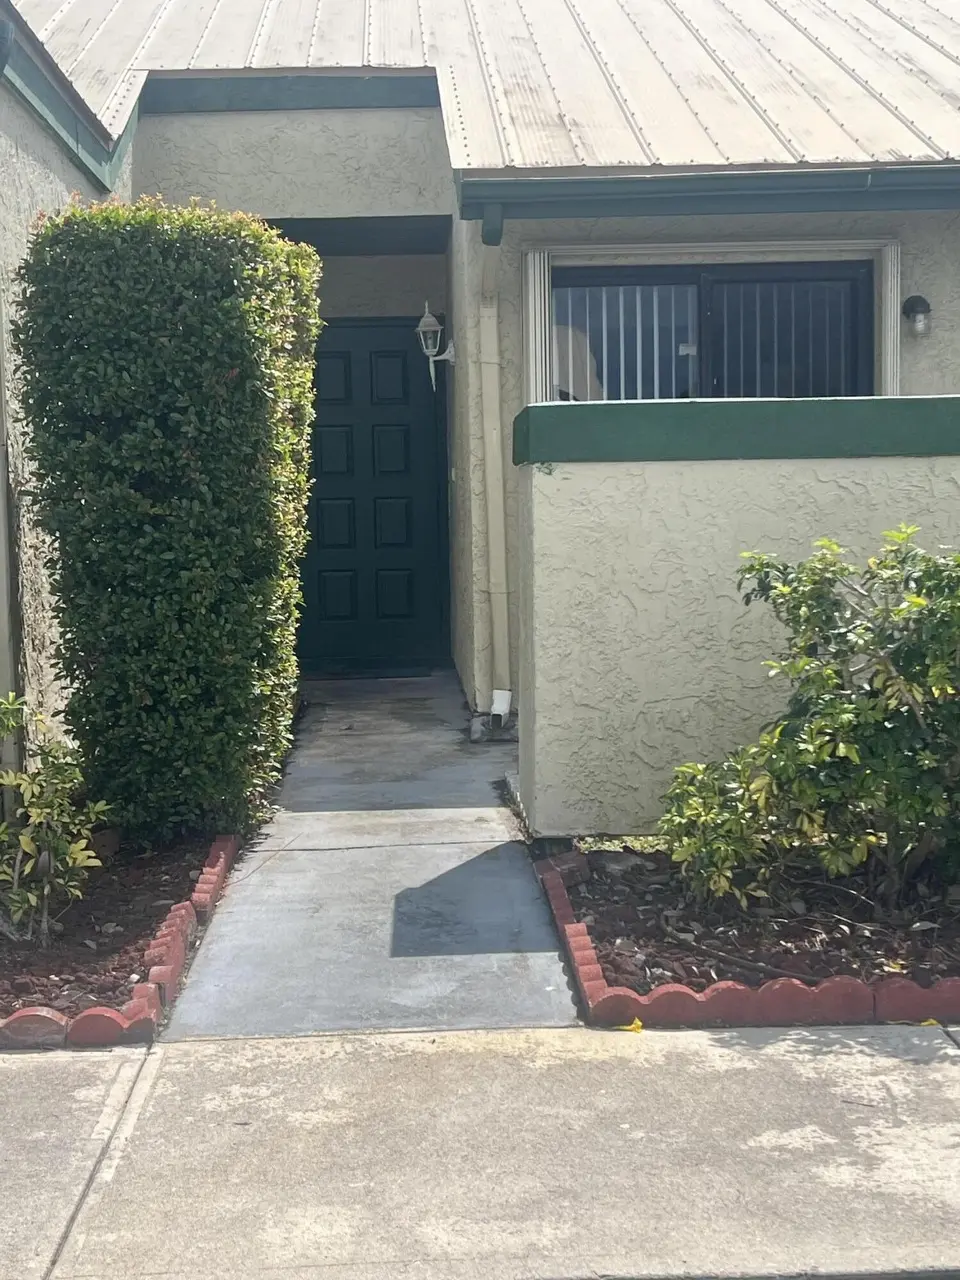
566 SW Sara Blvd · Port St. Lucie, FL
Flood risk 1/10 · Minimal
- FEMA flood zone
- X (unshaded)
- Chance of flooding over 30 yrs
- 0.0%
- Est. flood insurance / yr
- $507 – $1,088
Fire risk 1/10 · Minimal
- Est. fire insurance / yr
- $947 – $1,759
Heat risk 10/10 · Severe
- Hot days now (above 106°F)
- 7 days/yr
- Hot days in 30 yrs
- 25 days/yr
Wind risk 10/10 · Severe
- Chance of severe wind over 30 yrs
- 99.0%
Air-quality risk 1/10 · Minimal
- Unhealthy air days now
- 0 days/yr
- Unhealthy air days in 30 yrs
- 0 days/yr
Risk factors via First Street. Map © Google.
Why this score? — see what drove the C- grade
The composite is a weighted blend of 9 inputs, each scored 0–100. Each bar is that input's sub-score; the figure is the points it added to the 100-point composite (weight × sub-score).
- Cash flow +18.7/30.0
- ARV discount +13.5/15.0
- DSCR +5.9/10.0
- 1% rule +5.5/10.0
- Schools +3.7/10.0
- Rent growth +2.6/5.0
- Livability +2.5/5.0
- Condition / age +2.5/5.0
- Appreciation +0.0/10.0
$208,000
🖨 Deal sheet 📄 Offer letter ✓ Due diligence
Listing remarks MLS
Beautiful 2 Bedrooms 2 Bathrooms Villa, Washer and Dryer hookup. Convenient to the community pool, Park, School, Shopping area, Pharmacy, Publixs, Walmart etc.
Key facts
- Metal roof
- Washer dryer hookup
- Near parks
Tags
Property features AI
Finance
- HOA & community: Homeowners association (Villa's of Windmill Point/Rosewood POA); Monthly HOA fee of $200; HOA covers grounds maintenance and pool service; Community of 168 units; Pets allowed with breed restrictions
Exterior
- Parking: Open parking (2 spaces)
- Utilities: Public water; Public sewer; Three-phase electric; Cable available
- Home design: Villa; One story; Faces northwest; Resale property
- Construction: Frame and stucco construction; Metal roof
- Exterior features: No waterfront; Pool access via association
Interior
- Kitchen: Dishwasher; Electric range; Microwave; Refrigerator; Electric water heater
- Bedrooms: Two bedrooms on the main level
- Flooring: Tile
- Bathrooms: One full bathroom
- Heating & cooling: Electric heating; Central air conditioning
- Interior features: Split bedroom layout; Unfurnished
- Laundry & utility: Washer hookup
Neighborhood map
What this means for you Summary
Snapshot
- This is a 2-bed/1.0-bath single-family listed at $208k.
Deal economics
- At list price, monthly cash flow is $206 ($2k/yr) — positive.
- The deal already cash-flows at list — no discount required.
- Meets the 1% rule at list price ($2k rent vs $208k).
- Recommended offer: $189k (9.0% below list) — sets the bar for market timing.
- Cap rate 7.5% vs local median 3.9% in Port St. Lucie — top-decile yield for the area; either an underpriced asset or a hidden risk that comps aren't pricing in. Stress-test before assuming the spread holds.
Location & tenants
- Location reads: area grade C — affects rentability + tenant quality, not the cash-flow math above.
- St. Lucie (urban): math 40% / reading 48% proficiency, ranked #51 of 73 in FL (top 70%) — families likely to look elsewhere, expect single-tenant / working-renter base with shorter leases.
- Market conditions: Rents flat; 758 active listings in the ZIP; 3 comparable units currently listed for rent nearby; rentals at typical pace (median 24d on market — plan ~3-4 weeks tenant-placement turnaround); solid renter incomes; 4,868 units permitted in St. Lucie County in 2024 (268 in 5+ unit buildings).
- This rent runs 31% of the median local income ($86k/yr) — at the standard rent-burdened threshold; future hikes will face affordability resistance.
Forward outlook
- Local home prices are declining (-3.0%/yr); year-one equity from $1k of loan paydown is wiped out by about $6k of value loss. Plan a longer hold.
- St. Lucie County population projected at +20% by 2050 — long-run rental-demand tailwind backs the buy-and-hold thesis.
Negotiation context
- It's been on market 92 days — a 9% lower offer ($189k) is reasonable based on typical stale-listing flexibility.
- 10 sale attempts since 28y ago with the ask held roughly flat each time — persistent listings suggest the price (not the market) is what's stuck; bring a comps-based counter.
- Current owner paid $88k; list at $208k implies a 136% gain — meaningful room to come down on a strong offer.
Risks & watch-outs
- Climate carrying-cost: severe wind risk, 99% chance of damaging wind over 30y; extreme-heat days projected 7→25/yr by 2055 (HVAC capex compounding) — expect insurance premiums to compound above CPI over the hold.
Questions for the listing agent
- It's been on market 92 days. Have you received any prior offers? Is the seller open to a 9% concession, seller financing, or rate buy-down credit?
- What does the HOA fee cover, when was the last increase, and are there any pending special assessments or reserve-fund shortfalls?
- Why hasn't it sold? Are there any deal-killer items the seller is aware of (foundation, flood, title, zoning, code violations)?
- Is there a deadline driving the sale (1031 exchange, divorce, estate, relocation)? That informs how much negotiation room exists.
- What's the average days-on-market for RENTAL listings here right now (not sales)? A rising rental-DOM trend means longer vacancies and softer asking-rent achievability than the comps imply.
- What's the recent tenant-quality profile in this submarket — average credit score on applications, eviction rate, late-payment / NSF rate, and stable-employment percentage? A property-management company in the area should have these aggregated.
- How much new for-sale + rental construction is in the pipeline within 1–3 miles? Heavy new supply typically softens prices + rents 12–24 months out; constrained supply supports both.
Investment metrics
- 1% rule
- 1.05% ✓
- Cap rate
- 7.48%
- Cash-on-cash
- 4.24%
- DSCR
- 1.19
- GRM
- 7.9
CMA / ARV
- ARV (on-the-fly)
- $239,712
- Comps found
- 7
Show comp detail 7 sales within ~0.75 mi
| Address | Dist | Beds/Ba | Sqft | Sold | Price | $/sf | Match |
|---|---|---|---|---|---|---|---|
| 613 SW Jeanne St | 0.07mi | 2/1.0 | 908 (0%) | 16mo | $180,000 | $198 | 83 |
| 615 SW Jeanne St | 0.07mi | 2/1.0 | 908 (0%) | 18mo | $215,000 | $237 | 81 |
| 3250 SW Ronlea Ct | 0.39mi | 2/2.0 | 912 (+0%) | 12mo | $299,000 | $328 | 67 |
| 3061 SW Blout Ct | 0.42mi | 3/2.0 (+1) | 984 (+8%) | 2mo | $260,000 | $264 | 56 |
| 621 SW Stillman Ave | 0.55mi | 2/2.0 | 960 (+6%) | 9mo | $255,000 | $266 | 53 |
| 3250 SW Belmont Pl | 0.43mi | 3/2.0 (+1) | 984 (+8%) | 12mo | $210,000 | $213 | 46 |
| 718 SW Belmont Cir | 0.41mi | 3/2.0 (+1) | 998 (+10%) | 13mo | $325,000 | $326 | 44 |
Match score weights: distance 35% · size 25% · config 20% · recency 20%. Top-matched comps best support the ARV.
Projected returns pro-forma
-3.0% appreciation · 0.22% rent growth · sell at horizon
- IRR
- -13.0%
- Equity multiple
- 0.55×
- Total profit
- $-26,455
- Equity at exit
- $31,013
- IRR
- -9.2%
- Equity multiple
- 0.50×
- Total profit
- $-28,882
- Equity at exit
- $17,984
Cash invested: $58,240 (down + closing). Projections, not guarantees.
Landlord ↔ Tenant lean methodology
- Overall (STATE)
- 87 Strongly Landlord-Friendly
- State Florida
- 87 Strongly Landlord-Friendly · R+3
- County
- — inherits STATE
- City
- — inherits STATE
ZIP-level market 34953
- Home prices YoY
- -10.1%
- Rents YoY
- 0.2%
- Active inventory
- 758
- Price-to-rent
- 7.9×
Monthly cashflow live
- Estimated rent
- $2,183 medium interval (Pro) →
- Mortgage (P&I)
- −$1,091
- Tax from tax record
- −$141 /mo · $1,696/yr
- Insurance
- −$87
- HOA
- −$200
- Vacancy / Maint / Mgmt
- −$458
- Net cashflow
- $206
Break-even live
UW: 25.0% down · 7.5% · 30yr · 1.5% tax · 5.0% vac · 8.0% maint · 8.0% mgmt
Financing live
Cash to close
- Down payment
- $52,000
- Closing costs
- $6,240
- Reserves months
- —
- Total cash needed
- —
Loan-product check · same deal, 3 products live
Conventional
25% down · 7.5% · 30yr
- Down + closing
- —
- Monthly P&I
- —
- Monthly cashflow
- —
- DSCR
- —
- Eligible?
- —
Personal DTI + credit; lowest rate.
DSCR
20% down · 8.5% · 30yr
- Down + closing
- —
- Monthly P&I
- —
- Monthly cashflow
- —
- DSCR
- —
- Eligible?
- —
No personal income docs; deal must DSCR.
Hard money
10% down · 12.0% · 12mo
- Down + closing
- —
- Monthly P&I
- —
- Monthly cashflow
- —
- DSCR
- —
- Eligible?
- —
Short-term bridge; refi at stabilization.
Rent comps 3 comps
| Address | Beds | Baths | Sqft | Rent | $/sqft | DOM | Units | Dist |
|---|---|---|---|---|---|---|---|---|
| 602 SW Jeanne St Port Saint Lucie, FL | 3.0 | 2.0 | 1061 | $2,100 | $1.98 | 23d | 1 | 0.06mi |
| 273 SW Sterret Cir Port St. Lucie, FL | 2.0 | 1.0 | 933 | $1,775 | $1.90 | 23d | 1 | 0.26mi |
| 581 SW Banks Ter Port Saint Lucie, FL | 2.0 | 2.0 | 960 | $2,100 | $2.19 | 14d | 1 | 1.38mi |
HOA detail
- Monthly dues
- $200 · $2,400/yr
- Likely covers
- pool
Listing history 43 events
-
2026-06-18days on market $208,000 Active 92 DOM
-
2026-06-17days on market $208,000 Active 91 DOM
-
2026-06-16days on market $208,000 Active 90 DOM
-
2026-06-15days on market $208,000 Active 89 DOM
-
2026-06-14days on market $208,000 Active 87 DOM
-
2026-06-13days on market $208,000 Active 86 DOM
-
2026-06-10days on market $208,000 Active 84 DOM
-
2026-06-09days on market $208,000 Active 83 DOM
-
2026-06-08days on market $208,000 Active 82 DOM
-
2026-06-07days on market $208,000 Active 81 DOM
-
2026-06-05days on market $208,000 Active 78 DOM
-
2026-06-03days on market $208,000 Active 77 DOM
-
2026-06-02days on market $208,000 Active 76 DOM
-
2026-06-01days on market $208,000 Active 75 DOM
-
2026-05-31days on market $208,000 Active 74 DOM
-
2026-05-30days on market $208,000 Active 73 DOM
-
2026-03-18$208,000 Active
-
2019-06-10soldstatus $88,000
-
2019-06-07soldstatus $88,000 Closed 159-char remark
Show marketing remark (159 chars)
Beautiful 2 Bedrooms 2 Bathrooms Villa, Washer and Dryer hookup. Convenient to the community pool, Park, School, Shopping area, Pharmacy, Publixs, Walmart etc.
-
2019-05-06historical Contingent 159-char remark
Show marketing remark (159 chars)
Beautiful 2 Bedrooms 2 Bathrooms Villa, Washer and Dryer hookup. Convenient to the community pool, Park, School, Shopping area, Pharmacy, Publixs, Walmart etc.
-
2019-02-25$109,900 Active 159-char remark
Show marketing remark (159 chars)
Beautiful 2 Bedrooms 2 Bathrooms Villa, Washer and Dryer hookup. Convenient to the community pool, Park, School, Shopping area, Pharmacy, Publixs, Walmart etc.
-
2018-12-29historical
-
2018-08-28$129,900 Active
-
2013-09-21historical
-
2013-09-21historical
-
2011-02-07historical
-
2011-01-31$12,000
-
2008-04-09$80,000
-
2008-01-12historical
-
2007-11-29$85,000
-
2006-10-19historical
-
2006-07-19$138,500
-
2006-07-19$138,500
-
2002-08-30soldstatus $46,000
-
2000-05-24soldstatus $27,500
-
2000-05-19soldstatus $27,500
-
2000-05-11historical
-
2000-04-14$28,900
-
1998-09-01soldstatus $26,500
-
1998-08-28soldstatus $26,500
-
1998-08-17historical
-
1998-05-27$29,000
-
1983-09-01soldstatus $63,600
ⓘ Source: listings_history table (triggers on properties + properties_extension) + one-shot
backfill from property_details.listing_events for pre-trigger history.
Tax reassessment forecast FL · Resets to sale price
- Current annual tax
- $1,696 · $141/mo
- Projected year-2 tax
- $1,726 · $144/mo
- Expected delta
- +$30/yr (+$3/mo · 1.8%)
ⓘ Screening estimate from a state-policy table — verify with the county assessor before closing.
Climate risk First Street
- Flood 1/10 Low FEMA zone X (unshaded) · 0% chance over 30 yrs
- Wildfire 1/10 Low
- Heat 10/10 Extreme 7 d/yr ≥106°F today · 25 d/yr by 30 yrs out
- Wind 10/10 Extreme 99% chance of damaging wind over 30 yrs
- Air quality 1/10 Low 0 unhealthy d/yr today · 0 by 30 yrs out
Nearby sold comps map
Loading sold comps map…
Walkable amenities ~0.75 mi
Loading nearby amenities…
Taxation est. · year 1
- Rental income
- $26,196
- − Mortgage interest
- −$11,651
- − Property taxes
- −$1,696
- − Insurance
- −$1,040
- − Repairs & maintenance
- −$2,096
- − Management
- −$2,096
- − HOA
- −$2,400
- − Depreciation
- −$6,051
- Taxable loss
- −$833
- Est. tax savings @ 24.0%
- +$200
- After-tax cash flow
- $2,670/yr
For passive investors: Depreciation is non-cash, so a rental often shows a tax loss while cash-flowing — sheltering income. Rental losses are passive: they offset passive income freely, and up to $25,000/yr can offset ordinary (W-2) income if you actively participate and your MAGI is under $100k (phasing out to $0 by $150k); unused losses carry forward. On sale, claimed depreciation is recaptured at up to 25%, and gains may owe capital-gains tax (a 1031 exchange can defer both). Figures are a year-1 estimate at your 24.0% rate — not tax advice; consult a CPA.
Schools (NCES district)
- District
- St. Lucie
- NCES district ID
- 1201770
- Math proficiency
- 40% ▼ -11.00%
- Reading proficiency
- 48% ▼ -4.00%
- Median HH income
- $44,737
- Composite
- 37.28/100
- National rank
- #4449
- State rank
- #51 of 73 in FL
Livability — Port St. Lucie
No livability data for this city. (Only ~50 U.S. cities are tracked.)
Census & demographics
- Census place
- Port St. Lucie, FL
- County
- Saint Lucie County · 337,150 people
- City population
- 221,051
- Metro
- Port St. Lucie, FL
- Population (ZIP)
- 86,875
- Household income
- $85,667
- Rent vs Own
- Severe rent burden
- 857.0
Population outlook (St. Lucie County) Hauer SSP2
- Today (2025)
- 338,016 people
- By 2030
- 355,687 · +5.2%
- By 2040
- 385,521 · +14.1%
- By 2050
- 406,106 · +20.1%
- By 2075
- 441,054 · +30.5%
- By 2100
- 436,885 · +29.2%
Race, ethnicity, and origin ACS 2023
- Neighborhood character
- Diverse neighborhood (Simpson 0.69)
- Race & ethnicity
- White 42% Hispanic / Latino 28% Black 23% Two or more races 15% Asian 2%
- Hispanic origin (detail)
- Mexican 2% Puerto Rican 8% Cuban 4% Dominican 3%
- Common ancestry
- Hispanic 4% Romanian 2% Estonian 2%
- Foreign-born
- 24% · Canada, Jamaica, China
- Languages at home
- 69% English-only · Spanish 19% French/Haitian/Cajun 6% Other Indo-European 3%
Political lean MEDSL · St. Lucie
- 2024 margin
- Lean R (+9.1) · D 45.1% · R 54.2%
- 2008→2024 swing
- -21.2pp toward R · 2008: 12.1pp · 2024: -9.1pp
- All cycles
- 2024: R+9.1 2020: R+1.6 2016: R+2.5 2012: D+7.9 2008: D+12.1
Not yet ingested
- Civics
- —
Market trends
- HPI YoY
- ▼ -44.19%
- Current HPI
- 392.7681
- Rent YoY
- ▲ 0.22%
- Metro
- Port St. Lucie, FL
- State GDP YoY
- ▲ 3.28%
- F500 in state
- 36
Industry mix (Fortune 500 HQ in FL)
| Industry | F500 HQs | Revenue |
|---|---|---|
| Industrial Technology | 2 | $29B |
|
||
| Insurance | 2 | $17B |
|
||
| Retail | 1 | $60B |
|
||
| Technology Distribution | 1 | $58B |
|
||
| Homebuilding | 1 | $35B |
|
||
| Technology Manufacturing | 1 | $35B |
|
||
Price history
+227.0% since first listed27 events — show timeline
- 2026-03-18 Listed $208,000 Beaches MLS
- 2019-06-10 Sold (Public Records) $88,000 Public Records
- 2019-06-07 Sold (MLS) $88,000 Beaches MLS
- 2019-05-06 Contingent — Beaches MLS
- 2019-02-25 Listed $109,900 Beaches MLS
- 2018-12-29 Listing Removed — Beaches MLS
- 2018-08-28 Listed $129,900 Beaches MLS
- 2013-09-21 Listing Removed — Beaches MLS
- 2013-09-21 Listing Removed — Beaches MLS
- 2011-02-07 Listing Removed — Beaches MLS
- 2011-01-31 Listed $12,000 Beaches MLS
- 2008-04-09 Listed $80,000 Beaches MLS
- 2008-01-12 Listing Removed — Beaches MLS
- 2007-11-29 Listed $85,000 Beaches MLS
- 2006-10-19 Listing Removed — MCRTC
- 2006-07-19 Listed $138,500 MCRTC
- 2006-07-19 Listed $138,500 Beaches MLS
- 2002-08-30 Sold (Public Records) $46,000 Public Records
- 2000-05-24 Sold (Public Records) $27,500 Public Records
- 2000-05-19 Sold (MLS) $27,500 Beaches MLS
- 2000-05-11 Listing Removed — Beaches MLS
- 2000-04-14 Listed $28,900 Beaches MLS
- 1998-09-01 Sold (Public Records) $26,500 Public Records
- 1998-08-28 Sold (MLS) $26,500 Beaches MLS
- 1998-08-17 Listing Removed — Beaches MLS
- 1998-05-27 Listed $29,000 Beaches MLS
- 1983-09-01 Sold (Public Records) $63,600 Public Records
Property tax history
+4.3%/yrLatest (2025): $1,696 · +4.4% YoY. Source: county tax records.
Cash-flow waterfall
monthlySold comps — $/sqft
last 12 mo · ≤1 miLoading sold comps…