 Multi-family
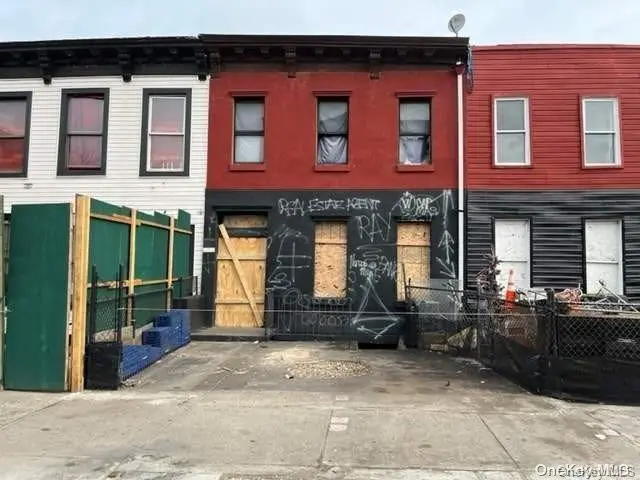
1737 Pacific St · New York, NY
Flood risk 1/10 · Minimal
- FEMA flood zone
- X (unshaded)
- Chance of flooding over 30 yrs
- 0.0%
- Est. flood insurance / yr
- $507 – $1,088
Fire risk 1/10 · Minimal
- Est. fire insurance / yr
- $691 – $1,283
Heat risk 7/10 · Major
- Hot days now (above 99°F)
- 7 days/yr
- Hot days in 30 yrs
- 15 days/yr
Wind risk 6/10 · Moderate
- Chance of severe wind over 30 yrs
- 27.0%
Air-quality risk 5/10 · Moderate
- Unhealthy air days now
- 6 days/yr
- Unhealthy air days in 30 yrs
- 8 days/yr
Risk factors via First Street. Map © Google.
Why this score? — see what drove the D- grade
The composite is a weighted blend of 9 inputs, each scored 0–100. Each bar is that input's sub-score; the figure is the points it added to the 100-point composite (weight × sub-score).
- Appreciation +10.0/10.0
- ARV discount +7.5/15.0
- Schools +5.0/10.0
- Cash flow +4.8/30.0
- Rent growth +4.0/5.0
- Livability +3.8/5.0
- Condition / age +2.5/5.0
- 1% rule +0.7/10.0
- DSCR +0.0/10.0
$1,099,000
🖨 Deal sheet 📄 Offer letter ✓ Due diligence
Multi-family units
County records classify this as Multi-Family (2-4 Unit). Listing-text estimate: 1 unit. estimate disagrees with records
Listing remarks
Brand new Crown Heights two family home - fully renovated with a rear extension added. Everything is new: electrical, plumbing, windows, flooring, and more. Entire building is heated and cooled with split systems throughout. Lower unit: duplex with a bright, finished windowed cellar (high ceilings) - 2 beds, 2 baths, rear deck and backyard access. Finished cellar includes two means of egress (front and back). Upper unit: 4 bedrooms, 1 bath - ideal for rental income or combine with the lower unit to create a spacious single family home.
Key facts
- Fully renovated
- Backyard access
- Two means of egress
Tags
Property features AI
Finance
- Financial info: Pets: building allows pets; some units may not allow
Exterior
- Home design: 2-story building; Entry level: 1
- Construction: Green building
- Exterior features: Private outdoor space (over 60 sq ft); Deck; Patio; Lot dimensions approximately 80.00 x 18.50
Interior
- Bedrooms: Total rooms: 9
- Bathrooms: 3 full bathrooms
- Heating & cooling: Cooling present
- Interior features: Smoke-free property; Basement (other)
- Laundry & utility: Washer hookup; In-unit laundry
Neighborhood map
What this means for you Summary
Snapshot
- This is a 6-bed/3.0-bath multifamily listed at $1.10M.
Deal economics
- At list price, monthly cash flow is $-3k ($-32k/yr) — negative.
- To cash-flow at today's rent, offer at most $710k (35.4% below list).
- To meet the 1% rule (rent ≥ 1% of price), the offer needs to be $622k (43.4% below list).
- Recommended offer: $622k (43.4% below list) — sets the bar for 1% rule.
- Cap rate 3.4% vs local median 2.6% in New York — meaningfully above typical; check what's discounted (condition, days-on-market, listing class) to confirm the premium yield is real.
Location & tenants
- Location reads 75/100 on livability (#268 in NY, #4,188 nationally) — a middle-class / working-renter tenant base. Strengths: amenities A+, commute A+, health & safety A; Watch: crime F, cost of living F.
- Market conditions: Rents rising fast (+6.0%/yr); 73 active listings in the ZIP; 7 comparable units currently listed for rent nearby; rentals leasing fast (median 5d on market — plan ~1-2 weeks tenant-placement turnaround); 10,063 units permitted in Kings County in 2024 (9,789 in 5+ unit buildings).
- At $6,215/mo this rent would consume 115% of the median local household income ($65k/yr) (locally 6603% of renters already pay >50% of income on rent) — very limited rent-growth headroom before tenants either downsize or default.
Forward outlook
- In year one you build about $117k of equity ($8k loan paydown + $110k appreciation (10.0% local appreciation)).
- Kings County population projected at +13% by 2050 — modest demand growth; plan on rents tracking national, not racing it.
- By year 2, paydown + projected appreciation supports a ~$189k cash-out refi (75% LTV) — recoverable capital for the next deal without selling this one.
Negotiation context
- It's been on market 53 days — a 3% lower offer ($1.07M) is reasonable based on typical stale-listing flexibility.
- 5 sale attempts since 26y ago with the ask held roughly flat each time — persistent listings suggest the price (not the market) is what's stuck; bring a comps-based counter.
- Current owner paid $525k; list at $1.10M implies a 109% gain — meaningful room to come down on a strong offer.
Risks & watch-outs
- Watch-outs: built in 1905 — expect roof / HVAC / electrical / plumbing capex.
- Climate carrying-cost: major wind risk, 27% chance of damaging wind over 30y; extreme-heat days projected 7→15/yr by 2055 (HVAC capex compounding) — expect insurance premiums to compound above CPI over the hold.
Questions for the listing agent
- What do current leases actually rent for vs. the listed asking? Can we see a recent rent roll and the last 12 months of T-12 income?
- It's been on market 53 days. Have you received any prior offers? Is the seller open to a 43% concession, seller financing, or rate buy-down credit?
- Built in 1905 — when were the roof, HVAC, electrical panel, plumbing, and water heater last replaced?
- Is there a deadline driving the sale (1031 exchange, divorce, estate, relocation)? That informs how much negotiation room exists.
- Schools are B-rated — typically a magnet for longer-tenancy family renters. What's the average tenant stay here, and is there a school-zone premium baked into asking?
- Crime grade is F in this area — have there been break-ins, vandalism, or insurance claims at this property in the last 3 years? What carrier currently insures it and at what premium?
- The area grade is low — what's the realistic commute time and amenity access for the typical tenant pool here? Any planned neighborhood developments (good or bad) we should know about?
- What's the average days-on-market for RENTAL listings here right now (not sales)? A rising rental-DOM trend means longer vacancies and softer asking-rent achievability than the comps imply.
- What's the recent tenant-quality profile in this submarket — average credit score on applications, eviction rate, late-payment / NSF rate, and stable-employment percentage? A property-management company in the area should have these aggregated.
- How much new apartment / multifamily construction is in the pipeline within 1–3 miles? Heavy new supply (>2% of stock underway) typically softens rents 12–24 months out; light construction supports rent growth.
Investment metrics
- 1% rule
- 0.57% ✗
- Cap rate
- 3.36%
- Cash-on-cash
- -10.47%
- DSCR
- 0.53
- GRM
- 14.7
CMA / ARV
No comps found within radius.
Projected returns pro-forma
10.0% appreciation · 5.95% rent growth · sell at horizon
- IRR
- 17.6%
- Equity multiple
- 2.45×
- Total profit
- $446,615
- Equity at exit
- $990,066
- IRR
- 17.1%
- Equity multiple
- 5.85×
- Total profit
- $1,493,288
- Equity at exit
- $2,135,115
Cash invested: $307,720 (down + closing). Projections, not guarantees.
Landlord ↔ Tenant lean methodology
- Overall (CITY)
- 0 Strongly Tenant-Friendly
- State New York
- 15 Strongly Tenant-Friendly · D+10
- County
- — inherits STATE
- City New York
- 0 Strongly Tenant-Friendly · D+34
ZIP-level market 11213
- Home prices YoY
- 4.3%
- Rents YoY
- 6.0%
- Active inventory
- 73
- Price-to-rent
- 37.2×
Monthly cashflow live
- Estimated rent
- $6,215 medium interval (Pro) →
- Mortgage (P&I)
- −$5,763
- Tax est. 1.5%
- −$1,374 /mo · $16,485/yr
- Insurance
- −$458
- HOA
- −$0
- Vacancy / Maint / Mgmt
- −$1,305
- Net cashflow
- $-2,685
Break-even live
3-unit breakdown (identical units grouped — click to expand)
| Units | Beds | Baths | Est. rent |
|---|---|---|---|
| 1× unit | 2 | 2 | $2,464 |
| 2× units | 4 | 1 | $3,752 |
| #2 | 4 | 1 | $1,876 |
| #3 | 4 | 1 | $1,876 |
| Total (3 units) | $6,215 | ||
UW: 25.0% down · 7.5% · 30yr · 1.5% tax · 5.0% vac · 8.0% maint · 8.0% mgmt
Financing live
Cash to close
- Down payment
- $274,750
- Closing costs
- $32,970
- Reserves months
- —
- Total cash needed
- —
Loan-product check · same deal, 3 products live
Conventional
25% down · 7.5% · 30yr
- Down + closing
- —
- Monthly P&I
- —
- Monthly cashflow
- —
- DSCR
- —
- Eligible?
- —
Personal DTI + credit; lowest rate.
DSCR
20% down · 8.5% · 30yr
- Down + closing
- —
- Monthly P&I
- —
- Monthly cashflow
- —
- DSCR
- —
- Eligible?
- —
No personal income docs; deal must DSCR.
Hard money
10% down · 12.0% · 12mo
- Down + closing
- —
- Monthly P&I
- —
- Monthly cashflow
- —
- DSCR
- —
- Eligible?
- —
Short-term bridge; refi at stabilization.
Rent comps 7 comps
| Address | Beds | Baths | Sqft | Rent | $/sqft | DOM | Units | Dist |
|---|---|---|---|---|---|---|---|---|
| 951 Madison St Brooklyn, NY | 5.0 | 1.0 | 650 | $1,280 | $1.97 | 5d | 1 | 1.06mi |
| 24 Van Buren St Brooklyn, NY | 6.0 | 3.0 | 643 | $1,110 | $1.73 | 5d | 1 | 1.06mi |
| 1223 Bedford Ave Brooklyn, NY | 5.0 | 2.0 | 680 | $1,420 | $2.09 | 20d | 1 | 1.12mi |
| 690 Prospect Pl Brooklyn, NY | 5.0 | 2.0 | 1200 | $1,200 | $1.00 | 24d | 1 | 1.12mi |
| 105 Weirfield St Brooklyn, NY | 5.0 | 2.0 | 660 | $1,190 | $1.80 | 5d | 1 | 1.30mi |
| 892 Myrtle Ave Brooklyn, NY | 6.0 | 2.0 | 665 | $1,310 | $1.97 | 5d | 1 | 1.46mi |
| 342 Rutland Rd Brooklyn, NY | 5.0 | 3.0 | 1200 | $1,420 | $1.18 | 24d | 1 | 1.49mi |
Listing history 28 events
-
2026-04-03$1,099,000 Active
-
2026-03-05historical
-
2025-12-04$1,199,000 Active
-
2025-07-23price $1,329,000
-
2025-06-12price $1,349,000
-
2025-03-11price $1,469,000
-
2024-01-19soldstatus $525,000
-
2024-01-10soldstatus $525,000 Closed
-
2023-12-04status Pending
-
2023-11-09price $569,000
-
2023-09-19status Active
-
2023-09-08status Pending
-
2023-06-14price $599,000
-
2023-03-30price $699,000
-
2023-03-16price $725,000
-
2023-02-01price $749,000
-
2022-10-25price $775,000
-
2022-09-09price $799,900
-
2022-07-15price $825,000
-
2022-06-10price $850,000
-
2022-05-12price $895,000
-
2022-04-11$995,000 Active
-
2012-10-01soldstatus $8,500
-
2004-12-20soldstatus $135,000
-
2004-10-21soldstatus $186,500
-
2001-04-18soldstatus $85,000
-
2000-05-22$92,500
-
1999-06-02soldstatus $83,000
ⓘ Source: listings_history table (triggers on properties + properties_extension) + one-shot
backfill from property_details.listing_events for pre-trigger history.
Climate risk First Street
- Flood 1/10 Low FEMA zone X (unshaded) · 0% chance over 30 yrs
- Wildfire 1/10 Low
- Heat 7/10 Severe 7 d/yr ≥99°F today · 15 d/yr by 30 yrs out
- Wind 6/10 Major 27% chance of damaging wind over 30 yrs
- Air quality 5/10 Major 6 unhealthy d/yr today · 8 by 30 yrs out
Nearby sold comps map
Loading sold comps map…
Walkable amenities ~0.75 mi
Loading nearby amenities…
Taxation est. · year 1
- Rental income
- $74,580
- − Mortgage interest
- −$61,561
- − Property taxes
- −$16,485
- − Insurance
- −$5,495
- − Repairs & maintenance
- −$5,966
- − Management
- −$5,966
- − Depreciation
- −$31,971
- Taxable loss
- −$52,865
- Est. tax savings @ 24.0%
- +$12,688
- After-tax cash flow
- $-19,534/yr
For passive investors: Depreciation is non-cash, so a rental often shows a tax loss while cash-flowing — sheltering income. Rental losses are passive: they offset passive income freely, and up to $25,000/yr can offset ordinary (W-2) income if you actively participate and your MAGI is under $100k (phasing out to $0 by $150k); unused losses carry forward. On sale, claimed depreciation is recaptured at up to 25%, and gains may owe capital-gains tax (a 1031 exchange can defer both). Figures are a year-1 estimate at your 24.0% rate — not tax advice; consult a CPA.
Schools (NCES district)
No district data.
Livability — New York
- Score
- 75/100
- State rank
- #268
- US rank
- #4188
Category grades
Schools grade is shown separately in the Schools card above.
Census & demographics
- Census place
- New York, NY
- County
- Kings County · 2,614,986 people
- City population
- 7,731,280
- Metro
- New York-Newark-Jersey City, NY-NJ-PA
- Population (ZIP)
- 68,846
- Household income
- $65,127
- Rent vs Own
- Severe rent burden
- 6603.0
Population outlook (Kings County) Hauer SSP2
- Today (2025)
- 2,847,441 people
- By 2030
- 2,937,006 · +3.1%
- By 2040
- 3,095,491 · +8.7%
- By 2050
- 3,228,968 · +13.4%
- By 2075
- 3,321,723 · +16.7%
- By 2100
- 3,111,387 · +9.3%
Race, ethnicity, and origin ACS 2023
- Neighborhood character
- Diverse neighborhood (Simpson 0.61)
- Race & ethnicity
- Black 56% White 23% Hispanic / Latino 13% Two or more races 8% Asian 2%
- Hispanic origin (detail)
- Mexican 1% Puerto Rican 3% Dominican 4%
- Common ancestry
- Hispanic 5% Scotch-Irish 2% Romanian 1%
- Foreign-born
- 32% · Canada, Mexico, China
- Languages at home
- 76% English-only · Spanish 9% French/Haitian/Cajun 6% German/W. Germanic 2%
Political lean MEDSL · Kings
- 2024 margin
- Solid D (+44.0) · D 72.0% · R 28.0%
- 2008→2024 swing
- -15.5pp toward R · 2008: 59.4pp · 2024: 44.0pp
- All cycles
- 2024: D+44.0 2020: D+54.8 2016: D+61.8 2012: D+63.9 2008: D+59.4
Not yet ingested
- Civics
- —
Market trends
- HPI YoY
- ▲ 23.71%
- Current HPI
- 577.3841
- Rent YoY
- ▲ 5.95%
- Metro
- New York-Newark-Jersey City, NY-NJ-PA
- State GDP YoY
- ▲ 2.60%
- F500 in state
- 92
Industry mix (Fortune 500 HQ in NY)
| Industry | F500 HQs | Revenue |
|---|---|---|
| Financial Services | 10 | $950B |
|
||
| Consumer Goods | 9 | $162B |
|
||
| Insurance | 4 | $225B |
|
||
| Telecommunications | 2 | $144B |
|
||
| Pharmaceuticals | 2 | $112B |
|
||
| Media / Entertainment | 2 | $69B |
|
||
Price history
+1224.1% since first listed28 events — show timeline
- 2026-04-03 Listed $1,099,000 RLS at REBNY
- 2026-03-05 Listing Removed — OneKey® MLS as Distributed by MLS Grid
- 2025-12-04 Listed $1,199,000 OneKey® MLS as Distributed by MLS Grid
- 2025-07-23 Price Changed $1,329,000 BNYMLS
- 2025-06-12 Price Changed $1,349,000 BNYMLS
- 2025-03-11 Price Changed $1,469,000 BNYMLS
- 2024-01-19 Sold (Public Records) $525,000 Public Records
- 2024-01-10 Sold (MLS) $525,000 OneKey® MLS as Distributed by MLS Grid
- 2023-12-04 Pending — OneKey® MLS as Distributed by MLS Grid
- 2023-11-09 Price Changed $569,000 OneKey® MLS as Distributed by MLS Grid
- 2023-09-19 Relisted — OneKey® MLS as Distributed by MLS Grid
- 2023-09-08 Pending — OneKey® MLS as Distributed by MLS Grid
- 2023-06-14 Price Changed $599,000 OneKey® MLS as Distributed by MLS Grid
- 2023-03-30 Price Changed $699,000 OneKey® MLS as Distributed by MLS Grid
- 2023-03-16 Price Changed $725,000 OneKey® MLS as Distributed by MLS Grid
- 2023-02-01 Price Changed $749,000 OneKey® MLS as Distributed by MLS Grid
- 2022-10-25 Price Changed $775,000 OneKey® MLS as Distributed by MLS Grid
- 2022-09-09 Price Changed $799,900 OneKey® MLS as Distributed by MLS Grid
- 2022-07-15 Price Changed $825,000 OneKey® MLS as Distributed by MLS Grid
- 2022-06-10 Price Changed $850,000 OneKey® MLS as Distributed by MLS Grid
- 2022-05-12 Price Changed $895,000 OneKey® MLS as Distributed by MLS Grid
- 2022-04-11 Listed $995,000 OneKey® MLS as Distributed by MLS Grid
- 2012-10-01 Sold (Public Records) $8,500 Public Records
- 2004-12-20 Sold (Public Records) $135,000 Public Records
- 2004-10-21 Sold (Public Records) $186,500 Public Records
- 2001-04-18 Sold (Public Records) $85,000 Public Records
- 2000-05-22 Listed $92,500 BNYMLS
- 1999-06-02 Sold (Public Records) $83,000 Public Records
Property tax history
+4.8%/yrLatest (2025): $1,748 · -1.2% YoY. Source: county tax records.
Cash-flow waterfall
monthlySold comps — $/sqft
last 12 mo · ≤1 miLoading sold comps…