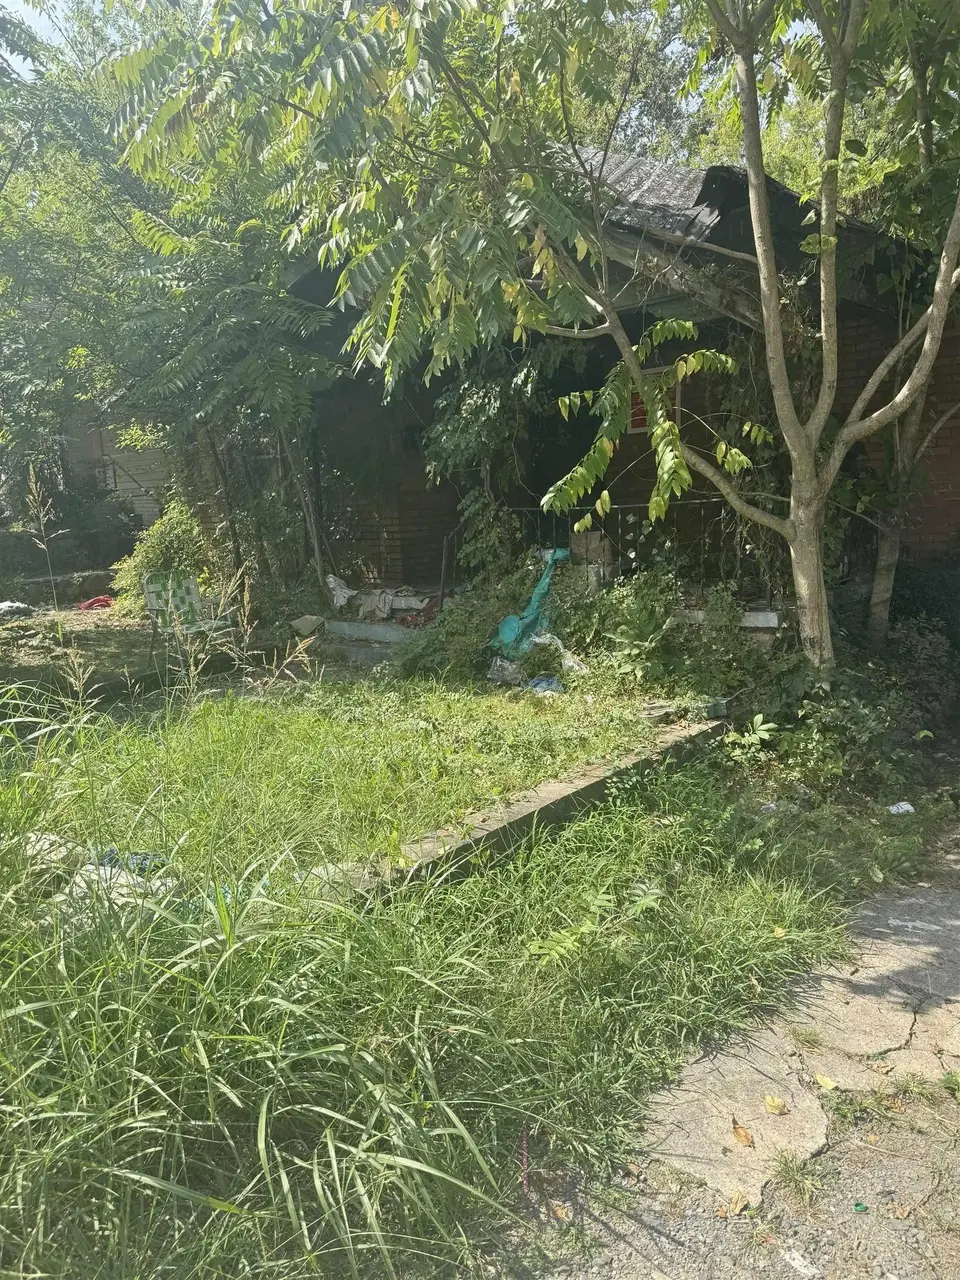
1610 S Cedar St · Little Rock, AR
Flood risk 1/10 · Minimal
- FEMA flood zone
- X (unshaded)
- Chance of flooding over 30 yrs
- 0.0%
- Est. flood insurance / yr
- $507 – $1,088
Fire risk 3/10 · Minor
- Est. fire insurance / yr
- $1,499 – $2,785
Heat risk 7/10 · Major
- Hot days now (above 110°F)
- 7 days/yr
- Hot days in 30 yrs
- 18 days/yr
Wind risk 4/10 · Minor
- Chance of severe wind over 30 yrs
- 10.0%
Air-quality risk 2/10 · Minimal
- Unhealthy air days now
- 1 days/yr
- Unhealthy air days in 30 yrs
- 1 days/yr
Risk factors via First Street. Map © Google.
Why this score? — see what drove the D grade
The composite is a weighted blend of 9 inputs, each scored 0–100. Each bar is that input's sub-score; the figure is the points it added to the 100-point composite (weight × sub-score).
- Cash flow +15.0/30.0
- ARV discount +7.5/15.0
- 1% rule +5.0/10.0
- DSCR +5.0/10.0
- Rent growth +3.7/5.0
- Livability +3.7/5.0
- Condition / age +2.5/5.0
- Schools +2.1/10.0
- Appreciation +0.0/10.0
$15,000
🖨 Deal sheet (PDF) 📄 Offer letter ✓ Due diligence
Listing remarks MLS
This house has been officially condemned by the city of Little Rock. Do not attempt to enter the house. However, this residential lot is available in an up-and-coming neighborhood. Ideal for building your dream home or as an investment opportunity. Don't wait! Bring you offer today! SEE AGENT'S REMARKS!!!
Key facts
- 5,227 sq ft lot
- Built 1940
- Listed 268 days
Neighborhood map
What this means for you Summary
Snapshot
- This is a 3-bed/1.0-bath single-family listed at $15k.
Deal economics
- At list price, monthly cash flow is $911 ($11k/yr) — positive.
- The deal already cash-flows at list — no discount required.
- Meets the 1% rule at list price ($1k rent vs $15k).
- Recommended offer: $13k (12.0% below list) — sets the bar for market timing.
- Cap rate 79.1% vs local median 4.1% in Little Rock — top-decile yield for the area; either an underpriced asset or a hidden risk that comps aren't pricing in. Stress-test before assuming the spread holds.
Location & tenants
- Location reads 73/100 on livability (#22 in AR) — a middle-class / working-renter tenant base. Strengths: commute A+, cost of living A+, housing A+; Watch: crime F.
- Little Rock School District (urban): math 23% / reading 26% proficiency, ranked #183 of 238 in AR (top 77%) — low school quality limits family demand, transient renter base, plan for 1-2y turnover; 69% free/reduced lunch — lower-income household profile, screen leases tightly.
- Zoned schools: Forest Heights Stem Academy (math 45% / reading 57%, grade C-, #88 of 454 statewide, top 19%, 739 students, 50% FRL) — zoned schools average 50% FRL vs 69% district-wide (19 pts lower); this property's tenant base skews higher-income than the district average.
- Zoned-school proficiency averages 51% at this address vs 24% district-wide (+26 pts) — the actual schools serving this property are materially stronger than the Little Rock School District average implies; a family-tenant draw the district grade alone would hide.
- Market conditions: Rents rising fast (+4.9%/yr); 187 active listings in the ZIP; 40 comparable units currently listed for rent nearby; rentals lingering (median 46d on market — plan ~5-8 weeks vacancy on turnover, expect pricing pressure); 58% of comp listings sitting > 30 days — soft ceiling on asking rent; lower-income renter base — watch delinquency; 1,006 units permitted in Pulaski County in 2024 (0 in 5+ unit buildings).
- This rent runs 38% of the median local income ($41k/yr) — at the standard rent-burdened threshold; future hikes will face affordability resistance.
Forward outlook
- Local home prices are declining (-3.0%/yr); year-one equity from $104 of loan paydown is wiped out by about $450 of value loss. Plan a longer hold.
- Pulaski County population projected at +6% by 2050 — modest demand growth; plan on rents tracking national, not racing it.
- At projected returns (-3.0% appreciation + 4.9% rent growth), your $4k cash investment doubles in ~1 year — after that, you're playing with house money.
Negotiation context
- It's been on market 268 days — a 12% lower offer ($13k) is reasonable based on typical stale-listing flexibility.
Risks & watch-outs
- Watch-outs: built in 1940 — expect roof / HVAC / electrical / plumbing capex.
- Climate carrying-cost: extreme-heat days projected 7→18/yr by 2055 (HVAC capex compounding) — expect insurance premiums to compound above CPI over the hold.
Questions for the listing agent
- It's been on market 268 days. Have you received any prior offers? Is the seller open to a 12% concession, seller financing, or rate buy-down credit?
- Built in 1940 — when were the roof, HVAC, electrical panel, plumbing, and water heater last replaced?
- Why hasn't it sold? Are there any deal-killer items the seller is aware of (foundation, flood, title, zoning, code violations)?
- Is there a deadline driving the sale (1031 exchange, divorce, estate, relocation)? That informs how much negotiation room exists.
- Crime grade is F in this area — have there been break-ins, vandalism, or insurance claims at this property in the last 3 years? What carrier currently insures it and at what premium?
- The area grade is low — what's the realistic commute time and amenity access for the typical tenant pool here? Any planned neighborhood developments (good or bad) we should know about?
- What's the average days-on-market for RENTAL listings here right now (not sales)? A rising rental-DOM trend means longer vacancies and softer asking-rent achievability than the comps imply.
- What's the recent tenant-quality profile in this submarket — average credit score on applications, eviction rate, late-payment / NSF rate, and stable-employment percentage? A property-management company in the area should have these aggregated.
- How much new for-sale + rental construction is in the pipeline within 1–3 miles? Heavy new supply typically softens prices + rents 12–24 months out; constrained supply supports both.
Investment metrics
- 1% rule
- 8.56% ✓
- Cap rate
- 79.15%
- Cash-on-cash
- 260.20%
- DSCR
- 12.58
- GRM
- 1.0
CMA / ARV
- ARV (median comp)
- $75,478
- List price
- $15,000
- Delta
- -80.13%
- Verdict
- UNDERPRICED
- Comps
- 20 within 1.0 mi
Show comp detail 12 sales within ~0.75 mi
| Address | Dist | Beds/Ba | Sqft | Sold | Price | $/sf | Match |
|---|---|---|---|---|---|---|---|
| 1608 S Martin St | 0.35mi | 3/2.0 | 1,350 (-2%) | 4mo | $240,000 | $178 | 73 |
| 3401 W 17th St | 0.38mi | 3/2.0 | 1,370 (-0%) | 7mo | $167,500 | $122 | 72 |
| 4009 W 11th St | 0.33mi | 3/2.0 | 1,305 (-5%) | 2mo | $161,950 | $124 | 71 |
| 1805 Princeton Dr | 0.39mi | 3/2.0 | 1,444 (+5%) | 4mo | $100,000 | $69 | 66 |
| 1806 Johnson | 0.58mi | 3/2.0 | 1,377 (+0%) | 7mo | $23,000 | $17 | 63 |
| 4211 W 24th St | 0.51mi | 3/1.0 | 1,276 (-7%) | 2mo | $63,000 | $49 | 63 |
| 1608 Green Meadow Dr | 0.54mi | 2/2.0 (-1) | 1,390 (+1%) | 2mo | $85,000 | $61 | 62 |
| 3501 W 25th St | 0.61mi | 3/2.0 | 1,338 (-3%) | 2mo | $145,000 | $108 | 62 |
| 2104 S Pine St | 0.30mi | 2/1.0 (-1) | 1,211 (-12%) | 3mo | $15,500 | $13 | 59 |
| 2109 Brown St | 0.57mi | 3/2.0 | 1,239 (-10%) | 3mo | $145,000 | $117 | 50 |
| 1019 Booker St | 0.74mi | 3/2.0 | 1,485 (+8%) | 3mo | $120,000 | $81 | 46 |
| 1601 Booker St | 0.65mi | 2/1.0 (-1) | 1,171 (-15%) | 2mo | $22,500 | $19 | 38 |
Match score weights: distance 35% · size 25% · config 20% · recency 20%. Top-matched comps best support the ARV.
Projected returns pro-forma
-3.0% appreciation · 4.91% rent growth · sell at horizon
- IRR
- —
- Equity multiple
- 14.83×
- Total profit
- $58,105
- Equity at exit
- $2,237
- IRR
- —
- Equity multiple
- 33.40×
- Total profit
- $136,091
- Equity at exit
- $1,297
Cash invested: $4,200 (down + closing). Projections, not guarantees.
Landlord ↔ Tenant lean methodology
- Overall (STATE)
- 92 Strongly Landlord-Friendly
- State Arkansas
- 92 Strongly Landlord-Friendly · R+14
- County
- — inherits STATE
- City
- — inherits STATE
ZIP-level market 72204
- Home prices YoY
- -21.5%
- Rents YoY
- 4.9%
- Active inventory
- 187
- Price-to-rent
- 1.0×
Monthly cashflow live
- Estimated rent
- $1,284 high interval (Pro) →
- Mortgage (P&I)
- −$79
- Tax est. 1.5%
- −$19 /mo · $225/yr
- Insurance
- −$6
- HOA
- −$0
- Vacancy / Maint / Mgmt
- −$270
- Net cashflow
- $911
Break-even live
Sensitivity live
| Price | -10% $921 | -5% $916 | +0% $911 | +5% $905 | +10% $900 |
|---|---|---|---|---|---|
| Rent | -10% $809 | -5% $860 | +0% $911 | +5% $961 | +10% $1,012 |
| Rate | -1.0pp $918 | -0.5pp $914 | base $911 | +0.5pp $907 | +1.0pp $903 |
UW: 25.0% down · 7.5% · 30yr · 1.5% tax · 5.0% vac · 8.0% maint · 8.0% mgmt
Financing live
Cash to close
- Down payment
- $3,750
- Closing costs
- $450
- Reserves months
- —
- Total cash needed
- —
Loan-product check · same deal, 3 products live
Conventional
25% down · 7.5% · 30yr
- Down + closing
- —
- Monthly P&I
- —
- Monthly cashflow
- —
- DSCR
- —
- Eligible?
- —
Personal DTI + credit; lowest rate.
DSCR
20% down · 8.5% · 30yr
- Down + closing
- —
- Monthly P&I
- —
- Monthly cashflow
- —
- DSCR
- —
- Eligible?
- —
No personal income docs; deal must DSCR.
Hard money
10% down · 12.0% · 12mo
- Down + closing
- —
- Monthly P&I
- —
- Monthly cashflow
- —
- DSCR
- —
- Eligible?
- —
Short-term bridge; refi at stabilization.
Rent comps 40 comps
| Address | Beds | Baths | Sqft | Rent | $/sqft | DOM | Units | Dist |
|---|---|---|---|---|---|---|---|---|
| 4104 W 15th St Little Rock, AR | 4.0 | 2.0 | 1223 | $1,595 | $1.30 | 45d | 1 | 0.16mi |
| 4319 W 17th St Little Rock, AR | 2.0 | 1.0 | 957 | $950 | $0.99 | 45d | 1 | 0.24mi |
| 3715 W 13th St Little Rock, AR | 2.0 | 1.0 | 1176 | $900 | $0.77 | 45d | 1 | 0.27mi |
| 4314 W 14th St Little Rock, AR | 4.0 | 2.0 | 1223 | $1,495 | $1.22 | 25d | 1 | 0.31mi |
| 3401 W 17th St Little Rock, AR | 3.0 | 2.0 | 1370 | $1,400 | $1.02 | 45d | 1 | 0.35mi |
| 4304 W 22nd St Little Rock, AR | 2.0 | 1.0 | 896 | $895 | $1.00 | 45d | 1 | 0.37mi |
| 2105 S Valentine St Little Rock, AR | 4.0 | 2.0 | 1223 | $1,595 | $1.30 | 16d | 1 | 0.38mi |
| 2100 Valmar St Little Rock, AR | 2.0 | 1.0 | 1219 | $1,200 | $0.98 | 25d | 1 | 0.39mi |
| 1205 Valmar St Little Rock, AR | 2.0 | 1.0 | 1100 | $1,199 | $1.09 | 45d | 1 | 0.41mi |
| 2305 S Oak St Little Rock, AR | 4.0 | 2.0 | 1223 | $1,525 | $1.25 | 45d | 1 | 0.42mi |
| 1626 S Brown St Little Rock, AR | 3.0 | 2.0 | 1386 | $995 | $0.72 | 45d | 1 | 0.42mi |
| 1320 Adams St Little Rock, AR | 3.0 | 1.0 | 1026 | $1,025 | $1.00 | 45d | 1 | 0.47mi |
| 4022 W 25th St Little Rock, AR | 3.0 | 1.0 | 1674 | $1,025 | $0.61 | 45d | 1 | 0.49mi |
| 2421 S Oak St Little Rock, AR | 3.0 | 1.0 | 1092 | $950 | $0.87 | 23d | 1 | 0.51mi |
| 3214 W 13th St Little Rock, AR | 3.0 | 2.0 | 1264 | $1,095 | $0.87 | 45d | 1 | 0.51mi |
| 1720 Pinewood Dr Little Rock, AR | 3.0 | 2.0 | 1382 | $1,180 | $0.85 | 45d | 1 | 0.52mi |
| 2220 S Martin St Little Rock, AR | 2.0 | 1.0 | 1143 | $900 | $0.79 | 25d | 1 | 0.52mi |
| 4721 W 16th St Little Rock, AR | 4.0 | 1.0 | 1100 | $1,195 | $1.09 | 25d | 1 | 0.53mi |
| 1820 Johnson St Little Rock, AR | 4.0 | 2.0 | 1223 | $1,550 | $1.27 | 20d | 1 | 0.56mi |
| 3423 Maryland Ave Little Rock, AR | 4.0 | 2.0 | 1223 | $1,595 | $1.30 | 45d | 1 | 0.58mi |
| 1822 Booker St Little Rock, AR | 3.0 | 2.0 | 1076 | $1,195 | $1.11 | 25d | 1 | 0.62mi |
| 3109 W 11th St Little Rock, AR | 3.0 | 2.0 | 1055 | $1,295 | $1.23 | 45d | 1 | 0.63mi |
| 2701 Abigail St Little Rock, AR | 3.0 | 1.0 | 1098 | $1,195 | $1.09 | 25d | 1 | 0.67mi |
| 3204 Maryland Ave Little Rock, AR | 3.0 | 1.0 | 921 | $1,095 | $1.19 | 45d | 1 | 0.69mi |
| 2900 W 15th St Little Rock, AR | 3.0 | 1.0 | 1337 | $950 | $0.71 | 45d | 1 | 0.69mi |
| 2803 W Daisy L Gatson Bates Dr Little Rock, AR | 4.0 | 2.0 | 1138 | $1,495 | $1.31 | 45d | 1 | 0.76mi |
| 1914 S Van Buren St Little Rock, AR | 3.0 | 1.5 | 1318 | $995 | $0.75 | 25d | 1 | 0.80mi |
| 3615 W Capitol Ave Little Rock, AR | 4.0 | 2.0 | 1410 | $1,550 | $1.10 | 25d | 1 | 0.82mi |
| 1701 Fair Park Blvd Little Rock, AR | 2.0 | 1.0 | 1170 | $1,050 | $0.90 | 45d | 1 | 0.94mi |
| 901 S Harrison St Little Rock, AR | 2.0 | 1.0 | 1000 | $980 | $0.98 | 20d | 1 | 0.95mi |
| 4816 W 30th St Little Rock, AR | 2.0 | 1.0 | 1217 | $1,150 | $0.94 | 20d | 1 | 0.97mi |
| 1123 Thayer St Little Rock, AR | 4.0 | 2.0 | 1223 | $1,595 | $1.30 | 25d | 1 | 1.01mi |
| 408 Booker St Little Rock, AR | 2.0 | 2.0 | 936 | $1,350 | $1.44 | 45d | 1 | 1.04mi |
| 2324 W Daisy L Gatson Bates Dr Unit 1 Little Rock, AR | 2.0 | 1.0 | 881 | $1,095 | $1.24 | 45d | 1 | 1.04mi |
| 2324 W Daisy L Gatson Bates Dr Unit 2 Little Rock, AR | 2.0 | 1.0 | 881 | $1,050 | $1.19 | 25d | 1 | 1.04mi |
| 3825 W Markham St Little Rock, AR | 2.0 | 1.0 | 950 | $1,095 | $1.15 | 45d | 1 | 1.05mi |
| 2609 S Tyler St Little Rock, AR | 3.0 | 2.0 | 1200 | $1,040 | $0.87 | 45d | 1 | 1.07mi |
| 3800 W Markham St Little Rock, AR | 2.0 | 1.0 | 1196 | $1,250 | $1.05 | 45d | 1 | 1.08mi |
| 100 Linwood Ct Little Rock, AR | 2.0 | 1.0 | 1475 | $1,475 | $1.00 | 16d | 1 | 1.08mi |
| 100 Linwood Ct Unit NA Little Rock, AR | 2.0 | 1.0 | 1475 | $1,475 | $1.00 | 20d | 1 | 1.08mi |
Listing history 18 events
-
2026-06-21days on market $15,000 Active 268 DOM
-
2026-06-18days on market $15,000 Active 265 DOM
-
2026-06-17days on market $15,000 Active 264 DOM
-
2026-06-16days on market $15,000 Active 263 DOM
-
2026-06-15days on market $15,000 Active 262 DOM
-
2026-06-14days on market $15,000 Active 260 DOM
-
2026-06-13days on market $15,000 Active 259 DOM
-
2026-06-10days on market $15,000 Active 257 DOM
-
2026-06-09days on market $15,000 Active 256 DOM
-
2026-06-08days on market $15,000 Active 255 DOM
-
2026-06-05days on market $15,000 Active 251 DOM
-
2026-06-03days on market $15,000 Active 250 DOM
-
2026-06-02days on market $15,000 Active 249 DOM
-
2026-06-01days on market $15,000 Active 248 DOM
-
2026-05-31days on market $15,000 Active 247 DOM
-
2026-05-31days on market $15,000 Active 246 DOM
-
2025-10-09price $15,000 308-char remark
Show marketing remark (308 chars)
This house has been officially condemned by the city of Little Rock. Do not attempt to enter the house. However, this residential lot is available in an up-and-coming neighborhood. Ideal for building your dream home or as an investment opportunity. Don't wait! Bring you offer today! SEE AGENT'S REMARKS!!!
-
2025-09-26$20,000 New Listing 308-char remark
Show marketing remark (308 chars)
This house has been officially condemned by the city of Little Rock. Do not attempt to enter the house. However, this residential lot is available in an up-and-coming neighborhood. Ideal for building your dream home or as an investment opportunity. Don't wait! Bring you offer today! SEE AGENT'S REMARKS!!!
ⓘ Source: listings_history table (triggers on properties + properties_extension) + one-shot
backfill from property_details.listing_events for pre-trigger history.
Climate risk First Street
- Flood 1/10 Low FEMA zone X (unshaded) · 0% chance over 30 yrs
- Wildfire 3/10 Moderate
- Heat 7/10 Severe 7 d/yr ≥110°F today · 18 d/yr by 30 yrs out
- Wind 4/10 Moderate 10% chance of damaging wind over 30 yrs
- Air quality 2/10 Low 1 unhealthy d/yr today · 1 by 30 yrs out
Nearby sold comps map
Loading sold comps map…
Walkable amenities ~0.75 mi
Loading nearby amenities…
Taxation est. · year 1
- Rental income
- $15,408
- − Mortgage interest
- −$840
- − Property taxes
- −$225
- − Insurance
- −$75
- − Repairs & maintenance
- −$1,233
- − Management
- −$1,233
- − Depreciation
- −$436
- Taxable income
- $11,366
- Est. tax owed @ 24.0%
- −$2,728
- After-tax cash flow
- $8,200/yr
For passive investors: Depreciation is non-cash, so a rental often shows a tax loss while cash-flowing — sheltering income. Rental losses are passive: they offset passive income freely, and up to $25,000/yr can offset ordinary (W-2) income if you actively participate and your MAGI is under $100k (phasing out to $0 by $150k); unused losses carry forward. On sale, claimed depreciation is recaptured at up to 25%, and gains may owe capital-gains tax (a 1031 exchange can defer both). Figures are a year-1 estimate at your 24.0% rate — not tax advice; consult a CPA.
Schools (NCES district)
- District
- Little Rock School District
- NCES district ID
- 0509000
- Math proficiency
- 23% ▼ -12.00%
- Reading proficiency
- 26% ▼ -8.00%
- Median HH income
- $43,346
- Composite
- 21.0/100
- National rank
- #8457
- State rank
- #183 of 238 in AR
Livability — Little Rock
- Score
- 73/100
- State rank
- #22
- US rank
- #5295
Category grades
Schools grade is shown separately in the Schools card above.
Census & demographics
- Census place
- Little Rock, AR
- County
- Pulaski County · 372,764 people
- City population
- 218,896
- Metro
- Little Rock-North Little Rock-Conway, AR
- Population (ZIP)
- 30,525
- Household income
- $40,882
- Rent vs Own
- Severe rent burden
- 1553.0
Population outlook (Pulaski County) Hauer SSP2
- Today (2025)
- 415,378 people
- By 2030
- 423,720 · +2.0%
- By 2040
- 435,182 · +4.8%
- By 2050
- 440,904 · +6.1%
- By 2075
- 445,521 · +7.3%
- By 2100
- 419,173 · +0.9%
Race, ethnicity, and origin ACS 2023
- Neighborhood character
- Predominantly Black (66%)
- Race & ethnicity
- Black 66% White 18% Hispanic / Latino 12% Two or more races 6%
- Hispanic origin (detail)
- Mexican 9%
- Common ancestry
- Slovak 1%
- Foreign-born
- 7% · Canada, Vietnam
- Languages at home
- 89% English-only · Spanish 9% Vietnamese 1%
Political lean MEDSL · Pulaski
- 2024 margin
- Strong D (+22.1) · D 59.8% · R 37.7% · Other 2.5%
- 2008→2024 swing
- +10.6pp toward D · 2008: 11.6pp · 2024: 22.1pp
- All cycles
- 2024: D+22.1 2020: D+22.5 2016: D+17.9 2012: D+11.4 2008: D+11.6
Not yet ingested
- Civics
- —
Market trends
- HPI YoY
- ▼ -47.17%
- Current HPI
- 172.3977
- Rent YoY
- ▲ 4.91%
- Metro
- Little Rock-North Little Rock-Conway, AR
- State GDP YoY
- ▲ 3.80%
- F500 in state
- 10
Industry mix (Fortune 500 HQ in AR)
| Industry | F500 HQs | Revenue |
|---|---|---|
| Retail | 1 | $681B |
|
||
| Food / Agriculture | 1 | $53B |
|
||
| Retail / Energy | 1 | $22B |
|
||
| Transportation / Logistics | 1 | $12B |
|
||
| Energy | 1 | $4B |
|
||
Price history
-25.0% since first listed2 events — show timeline
- 2025-10-09 Price Changed $15,000 CARMLS
- 2025-09-26 Listed $20,000 CARMLS
Property tax history
+11.9%/yrLatest (2025): $1,933 · +359.5% YoY. Source: county tax records.
Cash-flow waterfall
monthlySold comps — $/sqft
last 12 mo · ≤1 miLoading sold comps…