437 Golden Isles Dr Unit 9B-C · Hallandale Beach, FL
Flood risk 9/10 · Severe
- FEMA flood zone
- AE
- Chance of flooding over 30 yrs
- 0.99%
- Est. flood insurance / yr
- $1,737 – $8,500
Fire risk 1/10 · Minimal
- Est. fire insurance / yr
- $947 – $1,759
Heat risk 10/10 · Severe
- Hot days now (above 103°F)
- 7 days/yr
- Hot days in 30 yrs
- 26 days/yr
Wind risk 10/10 · Severe
- Chance of severe wind over 30 yrs
- 99.0%
Air-quality risk 2/10 · Minimal
- Unhealthy air days now
- 1 days/yr
- Unhealthy air days in 30 yrs
- 2 days/yr
Risk factors via First Street. Map © Google.
Why this score? — see what drove the D grade
The composite is a weighted blend of 9 inputs, each scored 0–100. Each bar is that input's sub-score; the figure is the points it added to the 100-point composite (weight × sub-score).
- Cash flow +12.0/30.0
- ARV discount +7.5/15.0
- 1% rule +6.1/10.0
- Schools +4.1/10.0
- Livability +4.0/5.0
- DSCR +3.6/10.0
- Rent growth +2.6/5.0
- Condition / age +2.5/5.0
- Appreciation +0.0/10.0
$495,000
🖨 Deal sheet (PDF) 📄 Offer letter ✓ Due diligence
Listing remarks
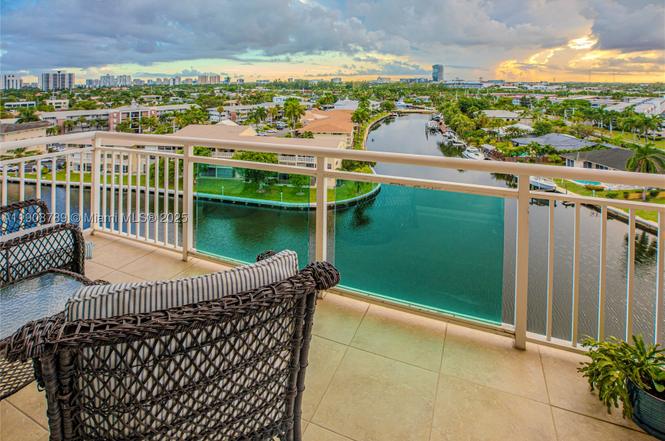
Discover the largest residence in the Golden Horn Condo — a rare double unit offering over 2,150 sq ft of thoughtfully designed living space. This expansive 4-bedroom, 2.5-bath home is truly one of a kind, featuring open living and hobby areas, custom built-in storage, and tile flooring throughout. Enjoy two private balconies, impact windows and sliders, two AC units, and even a dedicated mudroom — a unique convenience rarely found in condo living. Perfectly situated near the beach, Aventura Mall, Gulfstream Park, and just minutes from Fort Lauderdale Airport, the Golden Horn offers effortless access to the best of coastal living. Relish horizon beach views and the convenience o
Key facts
- Horizon beach views
- Dedicated mudroom
- $1,033 HOA
Tags
Property features AI
Finance
- Financial info: Pets not allowed
- HOA & community: Monthly association fee; Association amenities include clubhouse, community kitchen, fitness center, laundry, pool, trash service, elevators; Association fee covers amenities, common areas, laundry, maintenance (structure), parking, pool(s), recreation facilities, trash
Exterior
- Parking: Covered parking; 2 parking spaces; 2-car garage
- Security: Closed-circuit camera(s); Intercom; Lobby secured; Phone entry
- Utilities: Association pool (heated); Waterfront: Canal front
- Home design: Condo/Attached property; Entry on level 9; 15-story building
- Construction: Block construction; Resale property
- Exterior features: Balcony; Open balcony/patio
Interior
- Kitchen: Dishwasher; Electric range; Garbage disposal; Refrigerator
- Flooring: Tile
- Bathrooms: 2 full bathrooms; 1 half bathroom
- Heating & cooling: Central heating; Central air conditioning
- Interior features: Built-in features; Walk-in closet(s)
- Laundry & utility: Common area laundry
Neighborhood map
What this means for you Summary
Snapshot
- This is a 4-bed/2.5-bath condo listed at $495k.
Deal economics
- At list price, monthly cash flow is $-540 ($-6k/yr) — negative.
- To cash-flow at today's rent, offer at most $417k (15.8% below list).
- Meets the 1% rule at list price ($5k rent vs $495k).
- Recommended offer: $417k (15.8% below list) — sets the bar for cash-flow.
Location & tenants
- Location reads 81/100 on livability (#86 in FL, #1,400 nationally) — a professional / high-income tenant draw. Strengths: commute A+, health & safety A+, crime B+; Watch: schools C-, employment D-.
- Broward (suburban): math 42% / reading 53% proficiency, ranked #46 of 73 in FL (top 63%) — families likely to look elsewhere, expect single-tenant / working-renter base with shorter leases.
- Market conditions: Rents flat; 1380 active listings in the ZIP; 40 comparable units currently listed for rent nearby; rentals at typical pace (median 26d on market — plan ~3-4 weeks tenant-placement turnaround); 2,111 units permitted in Broward County in 2024 (1,265 in 5+ unit buildings).
- At $5,494/mo this rent would consume 127% of the median local household income ($52k/yr) (locally 3293% of renters already pay >50% of income on rent) — very limited rent-growth headroom before tenants either downsize or default.
Forward outlook
- Local home prices are declining (-3.0%/yr); year-one equity from $3k of loan paydown is wiped out by about $15k of value loss. Plan a longer hold.
- Broward County population projected at +34% by 2050 — long-run rental-demand tailwind backs the buy-and-hold thesis.
Negotiation context
- It's been on market 227 days — a 12% lower offer ($436k) is reasonable based on typical stale-listing flexibility.
- 5 sale attempts since 2y ago; this cycle's ask has dropped $35k (7%) from the opening price — seller is motivated, your offer sets the floor, not the list.
Risks & watch-outs
- Watch-outs: flood insurance adds $427/mo.
- Climate carrying-cost: in FEMA flood zone AE (mandatory federal flood insurance); severe wind risk, 99% chance of damaging wind over 30y; extreme-heat days projected 7→26/yr by 2055 (HVAC capex compounding) — expect insurance premiums to compound above CPI over the hold.
Questions for the listing agent
- What do current leases actually rent for vs. the listed asking? Can we see a recent rent roll and the last 12 months of T-12 income?
- It's been on market 227 days. Have you received any prior offers? Is the seller open to a 16% concession, seller financing, or rate buy-down credit?
- Built in 1970 — when were the roof, HVAC, electrical panel, plumbing, and water heater last replaced?
- What's the actual annual flood-insurance premium (NFIP or private), and is the property in a SFHA with mandatory coverage?
- What does the HOA fee cover, when was the last increase, and are there any pending special assessments or reserve-fund shortfalls?
- Any open or pending special assessments — roof, HVAC, plumbing, elevator, façade? What's the per-unit balance and payoff schedule, and is the seller paying it off at close or rolling it to the buyer?
- Why hasn't it sold? Are there any deal-killer items the seller is aware of (foundation, flood, title, zoning, code violations)?
- Is there a deadline driving the sale (1031 exchange, divorce, estate, relocation)? That informs how much negotiation room exists.
- The area grade is low — what's the realistic commute time and amenity access for the typical tenant pool here? Any planned neighborhood developments (good or bad) we should know about?
- What's the average days-on-market for RENTAL listings here right now (not sales)? A rising rental-DOM trend means longer vacancies and softer asking-rent achievability than the comps imply.
- What's the recent tenant-quality profile in this submarket — average credit score on applications, eviction rate, late-payment / NSF rate, and stable-employment percentage? A property-management company in the area should have these aggregated.
- How much new apartment / multifamily construction is in the pipeline within 1–3 miles? Heavy new supply (>2% of stock underway) typically softens rents 12–24 months out; light construction supports rent growth.
Investment metrics
- 1% rule
- 1.11% ✓
- Cap rate
- 6.02%
- Cash-on-cash
- -0.98%
- DSCR
- 0.96
- GRM
- 7.5
CMA / ARV
No comps found within radius.
Projected returns pro-forma
-3.0% appreciation · 0.43% rent growth · sell at horizon
- IRR
- -28.4%
- Equity multiple
- 0.08×
- Total profit
- $-127,465
- Equity at exit
- $73,806
- IRR
- -51.4%
- Equity multiple
- -0.48×
- Total profit
- $-205,276
- Equity at exit
- $42,799
Cash invested: $138,600 (down + closing). Projections, not guarantees.
Landlord ↔ Tenant lean methodology
- Overall (STATE)
- 87 Strongly Landlord-Friendly
- State Florida
- 87 Strongly Landlord-Friendly · R+3
- County
- — inherits STATE
- City
- — inherits STATE
ZIP-level market 33009
- Rents YoY
- 0.4%
- Active inventory
- 1380
- Price-to-rent
- 7.5×
Monthly cashflow live
- Estimated rent
- $5,494 high interval (Pro) →
- Mortgage (P&I)
- −$2,596
- Tax est. 1.5%
- −$619 /mo · $7,425/yr
- Insurance
- −$206
- Flood insurance flood zone
- −$427 /mo · $5,118/yr
- HOA
- −$1,033
- Vacancy / Maint / Mgmt
- −$1,154
- Net cashflow
- $-540
Break-even live
Sensitivity live
| Price | -10% $-198 | -5% $-369 | +0% $-540 | +5% $-711 | +10% $-882 |
|---|---|---|---|---|---|
| Rent | -10% $-974 | -5% $-757 | +0% $-540 | +5% $-323 | +10% $-106 |
| Rate | -1.0pp $-291 | -0.5pp $-414 | base $-540 | +0.5pp $-668 | +1.0pp $-799 |
UW: 25.0% down · 7.5% · 30yr · 1.5% tax · 5.0% vac · 8.0% maint · 8.0% mgmt
Financing live
Cash to close
- Down payment
- $123,750
- Closing costs
- $14,850
- Reserves months
- —
- Total cash needed
- —
Loan-product check · same deal, 3 products live
Conventional
25% down · 7.5% · 30yr
- Down + closing
- —
- Monthly P&I
- —
- Monthly cashflow
- —
- DSCR
- —
- Eligible?
- —
Personal DTI + credit; lowest rate.
DSCR
20% down · 8.5% · 30yr
- Down + closing
- —
- Monthly P&I
- —
- Monthly cashflow
- —
- DSCR
- —
- Eligible?
- —
No personal income docs; deal must DSCR.
Hard money
10% down · 12.0% · 12mo
- Down + closing
- —
- Monthly P&I
- —
- Monthly cashflow
- —
- DSCR
- —
- Eligible?
- —
Short-term bridge; refi at stabilization.
Rent comps 40 comps
| Address | Beds | Baths | Sqft | Rent | $/sqft | DOM | Units | Dist |
|---|---|---|---|---|---|---|---|---|
| 468 Golden Isles Dr Unit 202 Hallandale Beach, FL | 3.0 | 2.5 | 2300 | $5,800 | $2.52 | 25d | 1 | 0.09mi |
| 1745 E Hallandale Beach Blvd Unit 2302W Hallandale Beach, FL | 3.0 | 2.0 | 1481 | $3,900 | $2.63 | 25d | 1 | 0.33mi |
| 1745 E Hallandale Beach Blvd Unit 2302W Hallandale Beach, FL | 3.0 | 2.0 | 1481 | $3,900 | $2.63 | 16d | 1 | 0.33mi |
| 1745 E Hallandale Beach Blvd Unit 802W Hallandale Beach, FL | 3.0 | 2.0 | 1481 | $3,600 | $2.43 | 25d | 1 | 0.33mi |
| 1745 E Hallandale Beach Blvd Ph 05W Hallandale Beach, FL | 3.0 | 3.0 | 1715 | $5,000 | $2.92 | 4d | 1 | 0.37mi |
| 2600 E Hallandale Beach Blvd Unit T2002 SEASONAL Hallandale Beach, FL | 3.0 | 3.0 | 1577 | $7,500 | $4.76 | 25d | 1 | 0.44mi |
| 636 Hibiscus Dr Hallandale Beach, FL | 4.0 | 3.5 | 2753 | $15,000 | $5.45 | 25d | 1 | 0.45mi |
| 1985 S Ocean Dr Unit 22E Hallandale Beach, FL | 3.0 | 2.5 | 1780 | $5,900 | $3.31 | 25d | 1 | 0.53mi |
| 1985 S Ocean Dr Unit 22E Hallandale Beach, FL | 3.0 | 2.5 | 1780 | $5,900 | $3.31 | 9d | 1 | 0.53mi |
| 1945 S Ocean Dr Hallandale Beach, FL | 2.0–3.0 | 2.0–3.0 | 1542 | $4,800 | $3.11 | 16d | 3 | 0.54mi |
| 1945 S Ocean Dr Hallandale Beach, FL | 2.0–3.0 | 2.0–3.0 | 1542 | $4,800 | $3.11 | 9d | 2 | 0.54mi |
| 1945 S Ocean Dr Hallandale Beach, FL | 2.0–3.0 | 2.0–2.5 | 1522 | $4,500 | $2.96 | 20d | 3 | 0.54mi |
| 1945 S Ocean Dr Hallandale Beach, FL | 2.0–3.0 | 2.0–3.0 | 1542 | $4,800 | $3.11 | 14d | 2 | 0.54mi |
| 2723 E Hallandale Beach Blvd Unit 1049813P Hollywood, FL | 3.0 | 2.0 | 1496 | $6,498 | $4.34 | 4d | 1 | 0.60mi |
| 2069 S Ocean Dr Unit TH12 Hallandale Beach, FL | 3.0 | 3.0 | 1500 | $4,800 | $3.20 | 12d | 1 | 0.60mi |
| 2069 S Ocean Dr Unit TH12 Hallandale Beach, FL | 3.0 | 3.0 | 1500 | $4,800 | $3.20 | 25d | 1 | 0.60mi |
| 2069 S Ocean Dr Unit TH16 Hallandale Beach, FL | 3.0 | 3.0 | 1614 | $4,500 | $2.79 | 4d | 1 | 0.60mi |
| 2069 S Ocean Dr Unit TH16 Hallandale Beach, FL | 3.0 | 3.0 | 1614 | $4,500 | $2.79 | 25d | 1 | 0.60mi |
| 1880 N Ocean Dr Unit TS601 Hallandale Beach, FL | 3.0 | 3.0 | 1940 | $7,000 | $3.61 | 25d | 1 | 0.60mi |
| 4010 S Ocean Dr Unit 1227249P Hollywood, FL | 1.0–3.0 | 1.5–2.5 | 1140 | $7,469 | $6.55 | 0d | 3 | 0.61mi |
| 1980 S Ocean Dr Unit 15Q Hallandale Beach, FL | 3.0 | 2.5 | 1740 | $4,250 | $2.44 | 25d | 1 | 0.65mi |
| 1950 S Ocean Dr Unit LE Hallandale Beach, FL | 3.0 | 2.5 | 1780 | $4,500 | $2.53 | 25d | 1 | 0.66mi |
| 1950 S Ocean Dr Unit 19E Hallandale Beach, FL | 3.0 | 2.5 | 1780 | $4,000 | $2.25 | 9d | 1 | 0.66mi |
| 1950 S Ocean Dr Unit 19E Hallandale Beach, FL | 3.0 | 2.5 | 1780 | $4,000 | $2.25 | 25d | 1 | 0.66mi |
| 1850 S Ocean Dr #4202 Hallandale Beach, FL | 3.0 | 3.0 | 1841 | $7,600 | $4.13 | 25d | 1 | 0.66mi |
| 1850 S Ocean Dr #3308 Hallandale Beach, FL | 3.0 | 3.0 | 1571 | $6,500 | $4.14 | 25d | 1 | 0.66mi |
| 1850 S Ocean Dr #1907 Hallandale Beach, FL | 3.0 | 3.0 | 1571 | $5,800 | $3.69 | 9d | 1 | 0.66mi |
| 1850 S Ocean Dr #3107 Hallandale Beach, FL | 3.0 | 3.0 | 1571 | $7,500 | $4.77 | 25d | 1 | 0.66mi |
| 1890 S Ocean Dr #4 Hallandale Beach, FL | 3.0 | 3.0 | 1920 | $6,800 | $3.54 | 3d | 1 | 0.66mi |
| 1800 S Ocean Dr Hallandale Beach, FL | 3.0 | 3.0 | 1841 | $6,500 | $3.53 | 0d | 1 | 0.67mi |
| 1830 S Ocean Dr #2503 Hallandale Beach, FL | 3.0 | 3.0 | 1733 | $5,500 | $3.17 | 25d | 1 | 0.68mi |
| 1830 S Ocean Dr #5103 Hallandale Beach, FL | 3.0 | 4.0 | 2566 | $20,000 | $7.79 | 16d | 1 | 0.68mi |
| 1830 S Ocean Dr Unit 1227465P Hallandale Beach, FL | 3.0 | 3.0 | 1991 | $6,209 | $3.12 | 16d | 1 | 0.68mi |
| 1830 S Ocean Dr #4904 Hallandale Beach, FL | 3.0 | 3.0 | 1675 | $8,500 | $5.07 | 25d | 1 | 0.68mi |
| 1830 S Ocean Dr #1501 Hallandale Beach, FL | 3.0 | 3.0 | 2065 | $18,500 | $8.96 | 25d | 1 | 0.68mi |
| 1830 S Ocean Dr #3111 Hallandale Beach, FL | 3.0 | 2.0 | 1554 | $6,700 | $4.31 | 25d | 1 | 0.68mi |
| 1830 S Ocean Dr #4503 Hallandale Beach, FL | 3.0 | 2.5 | 1733 | $8,500 | $4.90 | 25d | 1 | 0.68mi |
| 1830 S Ocean Dr #4004 Hallandale Beach, FL | 3.0 | 3.0 | 1675 | $7,000 | $4.18 | 16d | 1 | 0.68mi |
| 1830 S Ocean Dr #3203 Hallandale Beach, FL | 3.0 | 3.0 | 1733 | $6,900 | $3.98 | 25d | 1 | 0.68mi |
| 1830 S Ocean Dr #2204 Hallandale Beach, FL | 3.0 | 3.0 | 1675 | $7,000 | $4.18 | 25d | 1 | 0.68mi |
HOA detail condo
- Monthly dues
- $1,033 · $12,396/yr
- Assessments
- None detected in remarks — confirm with the listing agent.
Listing history 24 events
-
2026-06-21days on market $495,000 Active 227 DOM
-
2026-06-18days on market $495,000 Active 224 DOM
-
2026-06-17days on market $495,000 Active 223 DOM
-
2026-06-16days on market $495,000 Active 222 DOM
-
2026-06-15days on market $495,000 Active 221 DOM
-
2026-06-13days on market $495,000 Active 219 DOM
-
2026-06-09days on market $495,000 Active 215 DOM
-
2026-06-07days on market $495,000 Active 213 DOM
-
2026-06-04days on market $495,000 Active 210 DOM
-
2026-06-03days on market $495,000 Active 209 DOM
-
2026-06-02days on market $495,000 Active 208 DOM
-
2026-06-01days on market $495,000 Active 207 DOM
-
2026-05-31days on market $495,000 Active 206 DOM
-
2026-03-24status Active
-
2026-03-23historical
-
2026-01-12price $495,000
-
2025-11-05$530,000 Active
-
2025-07-09historical
-
2025-04-02$540,000 Active
-
2025-02-19historical
-
2024-10-21$550,000 Active
-
2024-10-10historical
-
2024-08-13price $585,000
-
2024-01-17$649,000 Active
ⓘ Source: listings_history table (triggers on properties + properties_extension) + one-shot
backfill from property_details.listing_events for pre-trigger history.
Climate risk First Street
- Flood 9/10 Extreme FEMA zone AE · 99% chance over 30 yrs
- Wildfire 1/10 Low
- Heat 10/10 Extreme 7 d/yr ≥103°F today · 26 d/yr by 30 yrs out
- Wind 10/10 Extreme 99% chance of damaging wind over 30 yrs
- Air quality 2/10 Low 1 unhealthy d/yr today · 2 by 30 yrs out
Nearby sold comps map
Loading sold comps map…
Walkable amenities ~0.75 mi
Loading nearby amenities…
Taxation est. · year 1
- Rental income
- $65,933
- − Mortgage interest
- −$27,728
- − Property taxes
- −$7,425
- − Insurance
- −$7,594
- − Repairs & maintenance
- −$5,275
- − Management
- −$5,275
- − HOA
- −$12,396
- − Depreciation
- −$14,400
- Taxable loss
- −$14,159
- Est. tax savings @ 24.0%
- +$3,398
- After-tax cash flow
- $-3,080/yr
For passive investors: Depreciation is non-cash, so a rental often shows a tax loss while cash-flowing — sheltering income. Rental losses are passive: they offset passive income freely, and up to $25,000/yr can offset ordinary (W-2) income if you actively participate and your MAGI is under $100k (phasing out to $0 by $150k); unused losses carry forward. On sale, claimed depreciation is recaptured at up to 25%, and gains may owe capital-gains tax (a 1031 exchange can defer both). Figures are a year-1 estimate at your 24.0% rate — not tax advice; consult a CPA.
Schools (NCES district)
- District
- Broward
- NCES district ID
- 1200180
- Math proficiency
- 42% ▼ -18.00%
- Reading proficiency
- 53% ▼ -5.00%
- Median HH income
- $52,139
- Composite
- 40.88/100
- National rank
- #3621
- State rank
- #46 of 73 in FL
Livability — Hallandale Beach
- Score
- 81/100
- State rank
- #86
- US rank
- #1400
Category grades
Schools grade is shown separately in the Schools card above.
Census & demographics
- Census place
- Hallandale Beach, FL
- County
- Broward County · 1,963,430 people
- City population
- 44,021
- Metro
- Miami-Fort Lauderdale-Pompano Beach, FL
- Population (ZIP)
- 44,502
- Household income
- $52,079
- Rent vs Own
- Severe rent burden
- 3293.0
Population outlook (Broward County) Hauer SSP2
- Today (2025)
- 2,207,033 people
- By 2030
- 2,360,704 · +7.0%
- By 2040
- 2,661,208 · +20.6%
- By 2050
- 2,946,698 · +33.5%
- By 2075
- 3,602,273 · +63.2%
- By 2100
- 3,970,984 · +79.9%
Race, ethnicity, and origin ACS 2023
- Neighborhood character
- Diverse neighborhood (Simpson 0.67)
- Race & ethnicity
- Hispanic / Latino 39% White 39% Two or more races 24% Black 17% Asian 1%
- Hispanic origin (detail)
- Mexican 2% Puerto Rican 3% Cuban 9% Dominican 3% Salvadoran 2%
- Common ancestry
- Scotch-Irish 5% Hispanic 5% Subsaharan African 3%
- Foreign-born
- 51% · Canada, Jamaica, Dominican Republic
- Languages at home
- 38% English-only · Spanish 36% Russian/Polish/Slavic 12% French/Haitian/Cajun 7%
Political lean MEDSL · Broward
- 2024 margin
- D (+17.0) · D 58.0% · R 41.0%
- 2008→2024 swing
- -17.8pp toward R · 2008: 34.7pp · 2024: 17.0pp
- All cycles
- 2024: D+17.0 2020: D+29.8 2016: D+35.0 2012: D+34.9 2008: D+34.7
Not yet ingested
- Civics
- —
Market trends
- HPI YoY
- ▼ -299.13%
- Current HPI
- 329.9081
- Rent YoY
- ▲ 0.43%
- Metro
- Miami-Fort Lauderdale-Pompano Beach, FL
- State GDP YoY
- ▲ 3.28%
- F500 in state
- 36
Industry mix (Fortune 500 HQ in FL)
| Industry | F500 HQs | Revenue |
|---|---|---|
| Industrial Technology | 2 | $29B |
|
||
| Insurance | 2 | $17B |
|
||
| Retail | 1 | $60B |
|
||
| Technology Distribution | 1 | $58B |
|
||
| Homebuilding | 1 | $35B |
|
||
| Technology Manufacturing | 1 | $35B |
|
||
Price history
-23.7% since first listed11 events — show timeline
- 2026-03-24 Relisted — MARMLS
- 2026-03-23 Listing Removed — MARMLS
- 2026-01-12 Price Changed $495,000 MARMLS
- 2025-11-05 Listed $530,000 MARMLS
- 2025-07-09 Listing Removed — MARMLS
- 2025-04-02 Listed $540,000 MARMLS
- 2025-02-19 Listing Removed — MARMLS
- 2024-10-21 Listed $550,000 MARMLS
- 2024-10-10 Listing Removed — MARMLS
- 2024-08-13 Price Changed $585,000 MARMLS
- 2024-01-17 Listed $649,000 MARMLS
Cash-flow waterfall
monthlySold comps — $/sqft
last 12 mo · ≤1 miLoading sold comps…