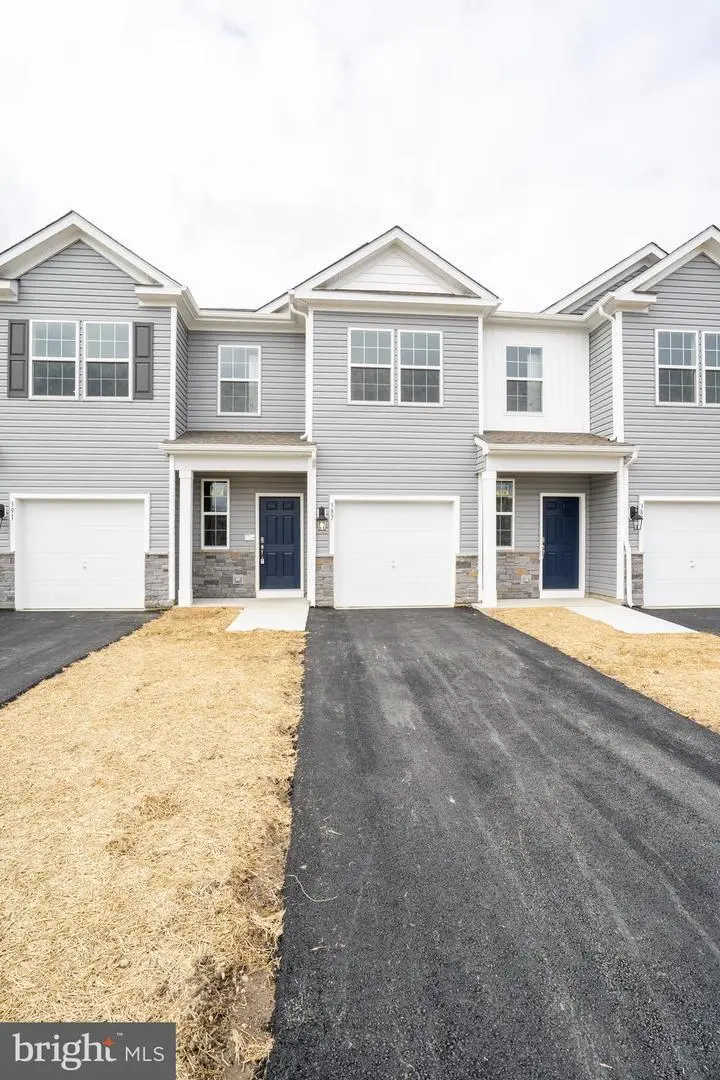
387 Mazzeo Dr · Glassboro, NJ
Flood risk No data
- FEMA flood zone
- —
- Chance of flooding over 30 yrs
- —
- Est. flood insurance / yr
- —
Fire risk No data
- Est. fire insurance / yr
- —
Heat risk No data
- Hot days now (above threshold)
- —
- Hot days in 30 yrs
- —
Wind risk No data
- Chance of severe wind over 30 yrs
- —
Air-quality risk No data
- Unhealthy air days now
- —
- Unhealthy air days in 30 yrs
- —
Risk factors via First Street. Map © Google.
Why this score? — see what drove the D- grade
The composite is a weighted blend of 9 inputs, each scored 0–100. Each bar is that input's sub-score; the figure is the points it added to the 100-point composite (weight × sub-score).
- Cash flow +11.5/30.0
- ARV discount +7.5/15.0
- Livability +4.0/5.0
- Condition / age +4.0/5.0
- Rent growth +3.7/5.0
- DSCR +3.4/10.0
- 1% rule +2.9/10.0
- Schools +2.0/10.0
- Appreciation +0.0/10.0
$355,000
🖨 Deal sheet 📄 Offer letter ✓ Due diligence
Listing remarks
Newer luxury townhome located in the desirable High Street Estates development in Glassboro. Fully equipped kitchen with Quartz Countertops, Stainless Steel Appliances, Upgraded Flooring, Recessed Lighting and Upgraded Cabinetry. Home comes with smart home package to simplify your life with features like remote keyless entry, Skybell video doorbell and so much more. Home has 3 spacious bedrooms with closets in each room. Unit has a long driveway that can hold 1 or more cars in addition to an attached garage. Convenient location, very close to Rowan University, shopping, eateries, major Highways with EZ access toPhiladelphia and SJ Shore points. Tax abated-contact Twp for details.
Key facts
- Quartz countertops
- Upgraded flooring
- Upgraded cabinetry
Tags
Property features AI
Finance
- HOA & community: Monthly HOA fee of $147; HOA covers common area maintenance
Exterior
- Parking: Attached garage with inside access and garage door opener (1 garage space); Driveway parking (1 space); Two total garage/parking spaces
- Utilities: Public water; Public sewer; Underground utilities
- Home design: Interior townhouse/rowhouse; Fee simple ownership; Very good condition
- Construction: Vinyl siding; Slab foundation; Above-grade and below-grade structures
- Exterior features: Two or more access exits
Interior
- Kitchen: Dishwasher; Microwave; Refrigerator; Gas oven/range
- Bedrooms: Three bedrooms on the upper level
- Flooring: Carpet; Engineered wood
- Bathrooms: Two full bathrooms on the upper level; One half bathroom on the main level
- Heating & cooling: 90% forced air heating (natural gas); Central air conditioning (electric)
- Interior features: Combination dining/living
- Laundry & utility: Washer; Dryer; Electric hot water
Neighborhood map
What this means for you Summary
Snapshot
- This is a 3-bed/2.5-bath townhouse listed at $355k. Condition is rated good.
Deal economics
- At list price, monthly cash flow is $-116 ($-1k/yr) — negative.
- To cash-flow at today's rent, offer at most $334k (5.8% below list).
- To meet the 1% rule (rent ≥ 1% of price), the offer needs to be $280k (21.0% below list).
- Recommended offer: $280k (21.0% below list) — sets the bar for 1% rule.
- Cap rate 5.9% vs local median 4.5% in Glassboro — top-decile yield for the area; either an underpriced asset or a hidden risk that comps aren't pricing in. Stress-test before assuming the spread holds.
Location & tenants
- Location reads 81/100 on livability (#57 in NJ, #1,498 nationally) — a professional / high-income tenant draw. Strengths: commute A+, housing A+, health & safety A+; Watch: schools D+, cost of living D-.
- Glassboro School District (suburban): math 10% / reading 33% proficiency, ranked #412 of 472 in NJ (top 87%) — low school quality limits family demand, transient renter base, plan for 1-2y turnover.
- Market conditions: Rents rising fast (+4.6%/yr); 75 active listings in the ZIP; 16 comparable units currently listed for rent nearby; rentals at typical pace (median 17d on market — plan ~3-4 weeks tenant-placement turnaround); solid renter incomes; 1,047 units permitted in Gloucester County in 2024 (183 in 5+ unit buildings).
- This rent runs 38% of the median local income ($89k/yr) — at the standard rent-burdened threshold; future hikes will face affordability resistance.
Forward outlook
- Local home prices are declining (-3.0%/yr); year-one equity from $2k of loan paydown is wiped out by about $11k of value loss. Plan a longer hold.
- Gloucester County population projected to shrink 5% by 2050 — rents likely to lag national; underwrite the cash flow, not the appreciation.
Negotiation context
- Only 10 days on market — expect competitive offers; lowballing is unlikely to land.
Questions for the listing agent
- What do current leases actually rent for vs. the listed asking? Can we see a recent rent roll and the last 12 months of T-12 income?
- What does the HOA fee cover, when was the last increase, and are there any pending special assessments or reserve-fund shortfalls?
- Is there a deadline driving the sale (1031 exchange, divorce, estate, relocation)? That informs how much negotiation room exists.
- Schools are D-rated, which usually means shorter tenancies and higher turnover. Who's the typical renter profile here, and what's been the actual vacancy rate?
- The area grade is low — what's the realistic commute time and amenity access for the typical tenant pool here? Any planned neighborhood developments (good or bad) we should know about?
- What's the average days-on-market for RENTAL listings here right now (not sales)? A rising rental-DOM trend means longer vacancies and softer asking-rent achievability than the comps imply.
- What's the recent tenant-quality profile in this submarket — average credit score on applications, eviction rate, late-payment / NSF rate, and stable-employment percentage? A property-management company in the area should have these aggregated.
- How much new for-sale + rental construction is in the pipeline within 1–3 miles? Heavy new supply typically softens prices + rents 12–24 months out; constrained supply supports both.
Investment metrics
- 1% rule
- 0.79% ✗
- Cap rate
- 5.90%
- Cash-on-cash
- -1.41%
- DSCR
- 0.94
- GRM
- 10.5
CMA / ARV
- ARV (on-the-fly)
- $354,676
- Comps found
- 10
Show comp detail 10 sales within ~0.75 mi
| Address | Dist | Beds/Ba | Sqft | Sold | Price | $/sf | Match |
|---|---|---|---|---|---|---|---|
| 70 Arlotta St | 0.15mi | 3/2.5 | 1,484 (0%) | 6mo | $340,000 | $229 | 88 |
| 25 Arlotta St | 0.04mi | 3/2.5 | 1,484 (0%) | 14mo | $355,000 | $239 | 86 |
| 78 Arlotta St | 0.10mi | 3/2.5 | 1,500 (+1%) | 9mo | $342,000 | $228 | 86 |
| 395 Mazzeo Dr | 0.01mi | 3/2.5 | 1,484 (0%) | 17mo | $357,000 | $241 | 85 |
| 30 Arlotta St | 0.08mi | 3/2.5 | 1,500 (+1%) | 14mo | $360,000 | $240 | 83 |
| 109 Mazzeo Dr | 0.18mi | 3/2.5 | 1,484 (0%) | 12mo | $347,500 | $234 | 82 |
| 225 Mazzeo Dr | 0.14mi | 3/2.5 | 1,500 (+1%) | 15mo | $358,000 | $239 | 79 |
| 9 Arlotta St | 0.15mi | 3/2.5 | 1,484 (0%) | 20mo | $355,000 | $239 | 76 |
| 321 Mazzeo Dr | 0.09mi | 3/2.5 | 1,500 (+1%) | 23mo | $356,775 | $238 | 75 |
| 62 Arlotta St | 0.15mi | 3/2.5 | 1,500 (+1%) | 23mo | $356,500 | $238 | 72 |
Match score weights: distance 35% · size 25% · config 20% · recency 20%. Top-matched comps best support the ARV.
Projected returns pro-forma
-3.0% appreciation · 4.64% rent growth · sell at horizon
- IRR
- -16.9%
- Equity multiple
- 0.39×
- Total profit
- $-60,270
- Equity at exit
- $52,932
- IRR
- -6.2%
- Equity multiple
- 0.58×
- Total profit
- $-42,203
- Equity at exit
- $30,694
Cash invested: $99,400 (down + closing). Projections, not guarantees.
Landlord ↔ Tenant lean methodology
- Overall (STATE)
- 21 Tenant-Leaning
- State New Jersey
- 21 Tenant-Leaning · D+6
- County
- — inherits STATE
- City
- — inherits STATE
ZIP-level market 08028
- Home prices YoY
- -21.2%
- Rents YoY
- 4.6%
- Active inventory
- 75
- Price-to-rent
- 10.5×
Monthly cashflow live
- Estimated rent
- $2,805 high interval (Pro) →
- Mortgage (P&I)
- −$1,862
- Tax from tax record
- −$176 /mo · $2,109/yr
- Insurance
- −$148
- HOA
- −$147
- Vacancy / Maint / Mgmt
- −$589
- Net cashflow
- $-116
Break-even live
UW: 25.0% down · 7.5% · 30yr · 1.5% tax · 5.0% vac · 8.0% maint · 8.0% mgmt
Financing live
Cash to close
- Down payment
- $88,750
- Closing costs
- $10,650
- Reserves months
- —
- Total cash needed
- —
Loan-product check · same deal, 3 products live
Conventional
25% down · 7.5% · 30yr
- Down + closing
- —
- Monthly P&I
- —
- Monthly cashflow
- —
- DSCR
- —
- Eligible?
- —
Personal DTI + credit; lowest rate.
DSCR
20% down · 8.5% · 30yr
- Down + closing
- —
- Monthly P&I
- —
- Monthly cashflow
- —
- DSCR
- —
- Eligible?
- —
No personal income docs; deal must DSCR.
Hard money
10% down · 12.0% · 12mo
- Down + closing
- —
- Monthly P&I
- —
- Monthly cashflow
- —
- DSCR
- —
- Eligible?
- —
Short-term bridge; refi at stabilization.
Rent comps 16 comps
| Address | Beds | Baths | Sqft | Rent | $/sqft | DOM | Units | Dist |
|---|---|---|---|---|---|---|---|---|
| 92 Arlotta St Glassboro, NJ | 3.0 | 2.5 | 1500 | $2,650 | $1.77 | 2d | 1 | 0.11mi |
| 173 Mazzeo Dr Glassboro, NJ | 3.0 | 2.5 | 1484 | $2,750 | $1.85 | 1d | 1 | 0.12mi |
| 173 Mazzeo Dr Unit 1 Glassboro, NJ | 3.0 | 2.5 | 1484 | $2,850 | $1.92 | 16d | 1 | 0.12mi |
| 121 Mazzeo Dr Glassboro, NJ | 3.0 | 2.5 | 1484 | $2,750 | $1.85 | 16d | 1 | 0.15mi |
| 275 High St E Glassboro, NJ | 1.0–2.0 | 1.0 | 800 | $1,995 | $2.49 | 1d | 1 | 0.20mi |
| 228 High St E Unit 2ND FL Glassboro, NJ | 2.0 | 1.0 | 1000 | $1,700 | $1.70 | 24d | 1 | 0.39mi |
| 15 Williams St Glassboro, NJ | 3.0 | 1.0 | 1216 | $2,200 | $1.81 | 15d | 1 | 0.69mi |
| 15 S Academy St Glassboro, NJ | 3.0 | 2.5 | 1618 | $2,850 | $1.76 | 24d | 1 | 0.82mi |
| 220 Rowan Blvd Glassboro, NJ | 2.0 | 2.0 | 1093 | $2,300 | $2.10 | 1d | 4 | 1.02mi |
| 65 Campus Ter Unit J Glassboro, NJ | 2.0 | 1.0 | 1000 | $2,200 | $2.20 | 18d | 1 | 1.10mi |
| 6 Andrew Ct Glassboro, NJ | 2.0 | 2.5 | 1792 | $2,400 | $1.34 | 20d | 1 | 1.12mi |
| 128-130 Wilmer St Glassboro, NJ | 3.0 | 1.0 | 1140 | $2,100 | $1.84 | 18d | 1 | 1.12mi |
| 303 Ellis St Glassboro, NJ | 4.0 | 2.0 | 1440 | $2,500 | $1.74 | 18d | 1 | 1.24mi |
| 310 Ellis St Glassboro, NJ | 4.0 | 2.0 | 1424 | $2,550 | $1.79 | 2d | 1 | 1.25mi |
| 339 Georgia Ct Sewell, NJ | 2.0 | 2.0 | 1488 | $2,600 | $1.75 | 13d | 1 | 1.32mi |
| 656 Covington Ct Sewell, NJ | 2.0 | 2.0 | 1086 | $2,200 | $2.03 | 13d | 1 | 1.46mi |
HOA detail
- Monthly dues
- $147 · $1,764/yr
Listing history 8 events
-
2026-06-18days on market $355,000 Active 10 DOM
-
2026-06-17days on market $355,000 Active 9 DOM
-
2026-06-16days on market $355,000 Active 8 DOM
-
2026-06-15days on market $355,000 Active 7 DOM
-
2026-06-13days on market $355,000 Active 5 DOM
-
2026-06-13days on market $355,000 Active 4 DOM
-
2026-06-09remarks 688-char remark
-
2026-06-09$355,000 Active 1 DOM
ⓘ Source: listings_history table (triggers on properties + properties_extension) + one-shot
backfill from property_details.listing_events for pre-trigger history.
Tax reassessment forecast NJ · Partial reset (capped growth)
- Current annual tax
- $2,109 · $176/mo
- Projected year-2 tax
- $5,474 · $456/mo
- Expected delta
- +$3,365/yr (+$280/mo · 159.5%)
ⓘ Screening estimate from a state-policy table — verify with the county assessor before closing.
Nearby sold comps map
Loading sold comps map…
Walkable amenities ~0.75 mi
Loading nearby amenities…
Taxation est. · year 1
- Rental income
- $33,659
- − Mortgage interest
- −$19,886
- − Property taxes
- −$2,109
- − Insurance
- −$1,775
- − Repairs & maintenance
- −$2,693
- − Management
- −$2,693
- − HOA
- −$1,764
- − Depreciation
- −$10,327
- Taxable loss
- −$7,587
- Est. tax savings @ 24.0%
- +$1,821
- After-tax cash flow
- $424/yr
For passive investors: Depreciation is non-cash, so a rental often shows a tax loss while cash-flowing — sheltering income. Rental losses are passive: they offset passive income freely, and up to $25,000/yr can offset ordinary (W-2) income if you actively participate and your MAGI is under $100k (phasing out to $0 by $150k); unused losses carry forward. On sale, claimed depreciation is recaptured at up to 25%, and gains may owe capital-gains tax (a 1031 exchange can defer both). Figures are a year-1 estimate at your 24.0% rate — not tax advice; consult a CPA.
Condition & rehab AI · 12 photos
This newer townhouse in Glassboro is in good condition with no visible repairs needed. It has a good curb appeal and is move-in ready.
Value-add opportunities
- Resale Paint interior walls — Fresh paint can make a home more appealing
- Both Install smart home package — Enhances home's features and convenience
- Both Add smart locks — Enhances security and convenience
- Both Add smart thermostat — Saves energy and money
Renovation cost estimate screening
Value-add ROI direction
- Resale Paint interior walls — Fresh paint can make a home more appealing ↑
- Both Install smart home package — Enhances home's features and convenience ↑
- Both Add smart locks — Enhances security and convenience ↑
- Both Add smart thermostat — Saves energy and money ↑
ⓘ Cost ranges are severity-bucket heuristics (US national rule-of-thumb). Get contractor quotes + a written scope before underwriting a rehab budget.
Schools (NCES district)
- District
- Glassboro School District
- NCES district ID
- 3405880
- Math proficiency
- 10% ▼ -20.00%
- Reading proficiency
- 33% ▼ -3.00%
- Median HH income
- $61,819
- Composite
- 20.19/100
- National rank
- #8631
- State rank
- #412 of 472 in NJ
Livability — Glassboro
- Score
- 81/100
- State rank
- #57
- US rank
- #1498
Category grades
Schools grade is shown separately in the Schools card above.
Census & demographics
- Census place
- Glassboro, NJ
- County
- Gloucester County · 160,422 people
- City population
- 25,098
- Metro
- Philadelphia-Camden-Wilmington, PA-NJ-DE-MD
- Population (ZIP)
- 25,098
- Household income
- $89,130
- Rent vs Own
- Severe rent burden
- 775.0
Population outlook (Gloucester County) Hauer SSP2
- Today (2025)
- 298,895 people
- By 2030
- 299,031 · +0.0%
- By 2040
- 294,020 · -1.6%
- By 2050
- 284,188 · -4.9%
- By 2075
- 260,720 · -12.8%
- By 2100
- 229,565 · -23.2%
Race, ethnicity, and origin ACS 2023
- Neighborhood character
- Diverse neighborhood (Simpson 0.58)
- Race & ethnicity
- White 61% Black 18% Hispanic / Latino 10% Asian 7% Two or more races 6%
- Hispanic origin (detail)
- Mexican 1% Puerto Rican 6%
- Common ancestry
- Romanian 3% Italian 1% Slovak 1%
- Foreign-born
- 9% · Canada, Jamaica, China
- Languages at home
- 85% English-only · Spanish 7% Other Indo-European 3% Other Asian/Pacific 1%
Political lean MEDSL · Gloucester
- 2024 margin
- Toss-up / Even · D 47.8% · R 50.6% · Other 1.6%
- 2008→2024 swing
- -15.0pp toward R · 2008: 12.2pp · 2024: -2.8pp
- All cycles
- 2024: R+2.8 2020: D+1.9 2016: R+0.4 2012: D+10.5 2008: D+12.2
Not yet ingested
- Civics
- —
Market trends
- HPI YoY
- ▼ -79.06%
- Current HPI
- 293.7251
- Rent YoY
- ▲ 4.64%
- Metro
- Philadelphia-Camden-Wilmington, PA-NJ-DE-MD
- State GDP YoY
- ▲ 2.05%
- F500 in state
- 34
Industry mix (Fortune 500 HQ in NJ)
| Industry | F500 HQs | Revenue |
|---|---|---|
| Consumer Goods | 3 | $31B |
|
||
| Pharmaceuticals | 2 | $153B |
|
||
| Technology | 2 | $21B |
|
||
| Insurance | 2 | $20B |
|
||
| Healthcare | 2 | $19B |
|
||
| Financial Services | 1 | $70B |
|
||
Price history
1 event — show timeline
- 2026-06-08 Listed $355,000 BRIGHT MLS
Property tax history
+36.4%/yrLatest (2025): $2,109 · +3.3% YoY. Source: county tax records.
Cash-flow waterfall
monthlySold comps — $/sqft
last 12 mo · ≤1 miLoading sold comps…