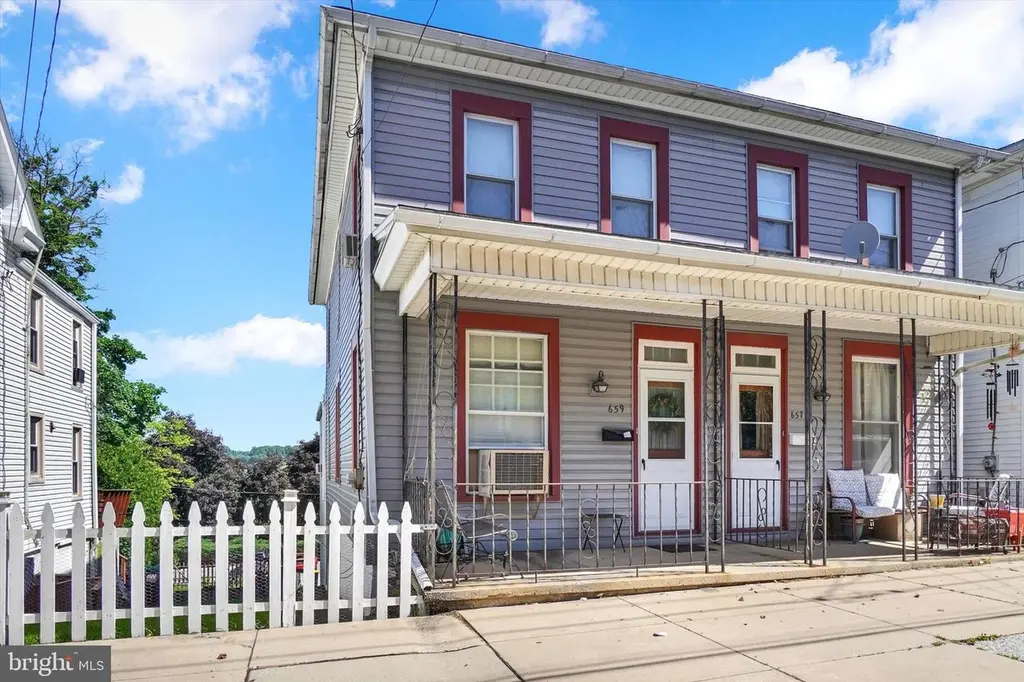
659 W Broadway · Red Lion, PA
Flood risk 1/10 · Minimal
- FEMA flood zone
- X (unshaded)
- Chance of flooding over 30 yrs
- 0.0%
- Est. flood insurance / yr
- $473 – $860
Fire risk 1/10 · Minimal
- Est. fire insurance / yr
- $511 – $949
Heat risk 5/10 · Moderate
- Hot days now (above 100°F)
- 7 days/yr
- Hot days in 30 yrs
- 15 days/yr
Wind risk 4/10 · Minor
- Chance of severe wind over 30 yrs
- 12.0%
Air-quality risk 3/10 · Minor
- Unhealthy air days now
- 2 days/yr
- Unhealthy air days in 30 yrs
- 5 days/yr
Risk factors via First Street. Map © Google.
Why this score? — see what drove the B- grade
The composite is a weighted blend of 9 inputs, each scored 0–100. Each bar is that input's sub-score; the figure is the points it added to the 100-point composite (weight × sub-score).
- Cash flow +25.0/30.0
- ARV discount +15.0/15.0
- DSCR +8.1/10.0
- 1% rule +6.8/10.0
- Livability +3.9/5.0
- Schools +3.8/10.0
- Rent growth +2.5/5.0
- Condition / age +2.5/5.0
- Appreciation +0.0/10.0
$149,900
🖨 Deal sheet (PDF) 📄 Offer letter ✓ Due diligence
Listing remarks
CASH BUYERS / INVESTORS ONLY! Opportunity awaits with this spacious 3BR, 2BA semi-detached in Red Lion Boro. Located within minutes to schools, recreation, restaurants, shopping, everyday conveniences, and the new Franklin Street Social, this property offers the chance to create value in a highly walkable location. While the interior requires renovation, some exterior and mechanical improvements have already been completed including a NEW boiler, water heater, family room baseboard heater; shingled roof and siding replaced; and windows replaced—providing a good starting point for your vision. Inside, the home offers a living room/dining room combination, kitchen space, and a family r
Key facts
- New boiler
- New siding
- New water heater
Tags
Property features AI
Finance
- Other: Ground rent paid annually
Exterior
- Parking: Attached garage with oversized bay, rear entry and inside access; Garage includes additional storage area and garage door opener; One garage space plus three driveway spaces (total of four parking spaces); On-street parking available
- Utilities: Public water; Public sewer; Electric service (100 amp); Natural gas available; Cable TV available; Phone service available
- Home design: Semi-detached home; Fee simple ownership; Major rehabilitation needed; Year built per assessor (year not specified); Not in a federal flood zone
- Construction: Vinyl siding; Architectural shingle and rubber roof; Permanent foundation; Replacement windows; Building not winterized
- Exterior features: Porch(es) with roof; Exterior lighting; Sidewalks; Paved driveway; Alley access; Lot dimensions approximately 15 x 149
Interior
- Kitchen: Kitchen (appliances not specified)
- Bedrooms: Three bedrooms on the upper level
- Flooring: Concrete; Partial carpet; Vinyl; Wood floors
- Bathrooms: Two full bathrooms (one on main level, one on upper level)
- Heating & cooling: Hot water baseboard heating; Natural gas heating and hot water
- Interior features: Attic; Combination dining and living area; Dining area; Family room off the kitchen; Bathroom with walk-in shower; Tub/shower; Carpeted areas; Wood floors; Paneled and plaster walls; Storm door(s)
- Laundry & utility: Laundry in the basement; Water heater
Neighborhood map
What this means for you Summary
Snapshot
- This is a 3-bed/2.5-bath townhouse listed at $150k.
Deal economics
- At list price, monthly cash flow is $325 ($4k/yr) — positive.
- The deal already cash-flows at list — no discount required.
- Meets the 1% rule at list price ($2k rent vs $150k).
- Recommended offer: $148k (1.5% below list) — sets the bar for market timing.
- Cap rate 8.9% vs local median 4.5% in Red Lion — top-decile yield for the area; either an underpriced asset or a hidden risk that comps aren't pricing in. Stress-test before assuming the spread holds.
Location & tenants
- Location reads 77/100 on livability (#349 in PA, #3,056 nationally) — a middle-class / working-renter tenant base. Strengths: cost of living A+, housing A+, health & safety A+; Watch: amenities D, commute F.
- Red Lion Area SD (suburban): math 36% / reading 50% proficiency, ranked #282 of 539 in PA (top 52%) — families likely to look elsewhere, expect single-tenant / working-renter base with shorter leases.
- Zoned schools: Mazie Gable El Sch (math 23% / reading 39%, grade F, #1,116 of 1,518 statewide, top 74%, 523 students, 73% FRL); Red Lion Area Jhs (math 23% / reading 49%, grade F, #313 of 512 statewide, top 62%, 813 students, 50% FRL); Red Lion Area Shs (math 63% / reading 24%, grade F, #211 of 437 statewide, top 48%, 1,432 students, 44% FRL) — zoned schools average 56% FRL vs 28% district-wide (27 pts higher); higher-poverty schools than district average — tighter screening recommended.
- Market conditions: 147 active listings in the ZIP; 7 comparable units currently listed for rent nearby; rentals at typical pace (median 23d on market — plan ~3-4 weeks tenant-placement turnaround); solid renter incomes; 1,328 units permitted in York County in 2024 (338 in 5+ unit buildings).
Forward outlook
- Local home prices are declining (-3.0%/yr); year-one equity from $1k of loan paydown is wiped out by about $4k of value loss. Plan a longer hold.
Negotiation context
- It's been on market 16 days — a 2% lower offer ($148k) is reasonable based on typical stale-listing flexibility.
- Current owner paid $50k; list at $150k implies a 199% gain — meaningful room to come down on a strong offer.
Risks & watch-outs
- Watch-outs: built in 1920 — expect roof / HVAC / electrical / plumbing capex.
- Climate carrying-cost: extreme-heat days projected 7→15/yr by 2055 (HVAC capex compounding) — expect insurance premiums to compound above CPI over the hold.
Questions for the listing agent
- Built in 1920 — when were the roof, HVAC, electrical panel, plumbing, and water heater last replaced?
- Is there a deadline driving the sale (1031 exchange, divorce, estate, relocation)? That informs how much negotiation room exists.
- What's the average days-on-market for RENTAL listings here right now (not sales)? A rising rental-DOM trend means longer vacancies and softer asking-rent achievability than the comps imply.
- What's the recent tenant-quality profile in this submarket — average credit score on applications, eviction rate, late-payment / NSF rate, and stable-employment percentage? A property-management company in the area should have these aggregated.
- How much new for-sale + rental construction is in the pipeline within 1–3 miles? Heavy new supply typically softens prices + rents 12–24 months out; constrained supply supports both.
Investment metrics
- 1% rule
- 1.18% ✓
- Cap rate
- 8.90%
- Cash-on-cash
- 9.29%
- DSCR
- 1.41
- GRM
- 7.1
CMA / ARV
- ARV (on-the-fly)
- $212,114
- Comps found
- 12
Show comp detail 12 sales within ~0.75 mi
| Address | Dist | Beds/Ba | Sqft | Sold | Price | $/sf | Match |
|---|---|---|---|---|---|---|---|
| 327 1st Ave | 0.18mi | 4/2.0 (+1) | 1,471 (-4%) | 1mo | $205,000 | $139 | 78 |
| 316 W Broadway | 0.31mi | 3/1.0 | 1,478 (-3%) | 3mo | $202,500 | $137 | 72 |
| 116 S Franklin St | 0.23mi | 3/1.5 | 1,632 (+7%) | 5mo | $201,250 | $123 | 70 |
| 217 N Charles St | 0.47mi | 3/2.0 | 1,500 (-2%) | 5mo | $222,500 | $148 | 69 |
| 171 Linden Ave | 0.23mi | 3/1.0 | 1,344 (-12%) | 2mo | $174,000 | $129 | 62 |
| 28 Pleasant Ave | 0.30mi | 3/1.0 | 1,386 (-9%) | 5mo | $160,000 | $115 | 60 |
| 400 Carriage Ln #400 | 0.40mi | 3/1.5 | 1,380 (-10%) | 2mo | $239,000 | $173 | 59 |
| 240 Palomino Way | 0.70mi | 2/2.0 (-1) | 1,520 (-0%) | 3mo | $259,000 | $170 | 57 |
| 337 Winners Cir | 0.68mi | 2/2.0 (-1) | 1,504 (-1%) | 3mo | $290,000 | $193 | 56 |
| 121 Furlong Way #121 | 0.68mi | 2/2.0 (-1) | 1,504 (-1%) | 4mo | $265,000 | $176 | 55 |
| 11 E Lancaster St | 0.71mi | 4/1.5 (+1) | 1,523 (-0%) | 4mo | $192,500 | $126 | 55 |
| 270 N Main St | 0.65mi | 4/1.0 (+1) | 1,340 (-12%) | 6mo | $185,000 | $138 | 34 |
Match score weights: distance 35% · size 25% · config 20% · recency 20%. Top-matched comps best support the ARV.
Projected returns pro-forma
-3.0% appreciation · 3.0% rent growth · sell at horizon
- IRR
- -2.2%
- Equity multiple
- 0.92×
- Total profit
- $-3,540
- Equity at exit
- $22,351
- IRR
- 7.5%
- Equity multiple
- 1.57×
- Total profit
- $23,766
- Equity at exit
- $12,961
Cash invested: $41,972 (down + closing). Projections, not guarantees.
Landlord ↔ Tenant lean methodology
- Overall (STATE)
- 62 Landlord-Friendly
- State Pennsylvania
- 62 Landlord-Friendly · EVEN
- County
- — inherits STATE
- City
- — inherits STATE
ZIP-level market 17356
- Home prices YoY
- -21.0%
- Active inventory
- 147
- Price-to-rent
- 7.1×
Monthly cashflow live
- Estimated rent
- $1,764 high interval (Pro) →
- Mortgage (P&I)
- −$786
- Tax from tax record
- −$220 /mo · $2,639/yr
- Insurance
- −$62
- HOA
- −$0
- Vacancy / Maint / Mgmt
- −$370
- Net cashflow
- $325
Break-even live
Sensitivity live
| Price | -10% $410 | -5% $367 | +0% $325 | +5% $283 | +10% $240 |
|---|---|---|---|---|---|
| Rent | -10% $186 | -5% $255 | +0% $325 | +5% $395 | +10% $464 |
| Rate | -1.0pp $401 | -0.5pp $363 | base $325 | +0.5pp $286 | +1.0pp $247 |
UW: 25.0% down · 7.5% · 30yr · 1.5% tax · 5.0% vac · 8.0% maint · 8.0% mgmt
Financing live
Cash to close
- Down payment
- $37,475
- Closing costs
- $4,497
- Reserves months
- —
- Total cash needed
- —
Loan-product check · same deal, 3 products live
Conventional
25% down · 7.5% · 30yr
- Down + closing
- —
- Monthly P&I
- —
- Monthly cashflow
- —
- DSCR
- —
- Eligible?
- —
Personal DTI + credit; lowest rate.
DSCR
20% down · 8.5% · 30yr
- Down + closing
- —
- Monthly P&I
- —
- Monthly cashflow
- —
- DSCR
- —
- Eligible?
- —
No personal income docs; deal must DSCR.
Hard money
10% down · 12.0% · 12mo
- Down + closing
- —
- Monthly P&I
- —
- Monthly cashflow
- —
- DSCR
- —
- Eligible?
- —
Short-term bridge; refi at stabilization.
Rent comps 7 comps
| Address | Beds | Baths | Sqft | Rent | $/sqft | DOM | Units | Dist |
|---|---|---|---|---|---|---|---|---|
| 705 Country Club Rd Red Lion, PA | 3.0 | 2.5 | 1660 | $1,695 | $1.02 | 45d | 1 | 0.14mi |
| 703 Country Club Rd Red Lion, PA | 3.0 | 2.5 | 1540 | $1,795 | $1.17 | 45d | 1 | 0.14mi |
| 16 W High St Red Lion, PA | 3.0 | 1.0 | 1075 | $1,075 | $1.00 | 23d | 1 | 0.47mi |
| 201 Burrows Rd Red Lion, PA | 3.0 | 2.5 | 1485 | $1,924 | $1.30 | 15d | 1 | 0.59mi |
| 520 S Pine St Red Lion, PA | 4.0 | 3.0 | 2088 | $2,295 | $1.10 | 15d | 1 | 0.73mi |
| 571 S Main St Red Lion, PA | 2.0 | 1.0 | 2152 | $1,500 | $0.70 | 23d | 1 | 0.88mi |
| 306 Orchard Ct Red Lion, PA | 2.0 | 1.5 | 1300 | $1,495 | $1.15 | 23d | 1 | 1.46mi |
Listing history 12 events
-
2026-06-21days on market $149,900 Active 16 DOM
-
2026-06-18days on market $149,900 Active 13 DOM
-
2026-06-17days on market $149,900 Active 12 DOM
-
2026-06-16days on market $149,900 Active 11 DOM
-
2026-06-15days on market $149,900 Active 10 DOM
-
2026-06-14days on market $149,900 Active 8 DOM
-
2026-06-13days on market $149,900 Active 7 DOM
-
2026-06-10days on market $149,900 Active 5 DOM
-
2026-06-09days on market $149,900 Active 4 DOM
-
2026-06-08days on market $149,900 Active 3 DOM
-
2026-06-07remarks 693-char remark
-
2026-06-07$149,900 Active 2 DOM
ⓘ Source: listings_history table (triggers on properties + properties_extension) + one-shot
backfill from property_details.listing_events for pre-trigger history.
Tax reassessment forecast PA · Partial reset (capped growth)
- Current annual tax
- $2,639 · $220/mo
- Projected year-2 tax
- $2,639 · $220/mo
- Expected delta
- $0/yr ($0/mo · 0.0%)
ⓘ Screening estimate from a state-policy table — verify with the county assessor before closing.
Climate risk First Street
- Flood 1/10 Low FEMA zone X (unshaded) · 0% chance over 30 yrs
- Wildfire 1/10 Low
- Heat 5/10 Major 7 d/yr ≥100°F today · 15 d/yr by 30 yrs out
- Wind 4/10 Moderate 12% chance of damaging wind over 30 yrs
- Air quality 3/10 Moderate 2 unhealthy d/yr today · 5 by 30 yrs out
Nearby sold comps map
Loading sold comps map…
Walkable amenities ~0.75 mi
Loading nearby amenities…
Taxation est. · year 1
- Rental income
- $21,168
- − Mortgage interest
- −$8,397
- − Property taxes
- −$2,639
- − Insurance
- −$750
- − Repairs & maintenance
- −$1,693
- − Management
- −$1,693
- − Depreciation
- −$4,361
- Taxable income
- $1,635
- Est. tax owed @ 24.0%
- −$392
- After-tax cash flow
- $3,508/yr
For passive investors: Depreciation is non-cash, so a rental often shows a tax loss while cash-flowing — sheltering income. Rental losses are passive: they offset passive income freely, and up to $25,000/yr can offset ordinary (W-2) income if you actively participate and your MAGI is under $100k (phasing out to $0 by $150k); unused losses carry forward. On sale, claimed depreciation is recaptured at up to 25%, and gains may owe capital-gains tax (a 1031 exchange can defer both). Figures are a year-1 estimate at your 24.0% rate — not tax advice; consult a CPA.
Schools (NCES district)
- District
- Red Lion Area SD
- NCES district ID
- 4220100
- Math proficiency
- 36% ▼ -10.00%
- Reading proficiency
- 50% ▼ -10.00%
- Median HH income
- $60,225
- Composite
- 37.91/100
- National rank
- #4313
- State rank
- #282 of 539 in PA
Livability — Red Lion
- Score
- 77/100
- State rank
- #349
- US rank
- #3056
Category grades
Schools grade is shown separately in the Schools card above.
Census & demographics
- Census place
- Red Lion, PA
- County
- York County · 278,806 people
- City population
- 22,869
- Metro
- York-Hanover, PA
- Population (ZIP)
- 22,869
- Household income
- $86,561
- Rent vs Own
- Severe rent burden
- 559.0
Population outlook (York County) Hauer SSP2
- Today (2025)
- 454,205 people
- By 2030
- 457,407 · +0.7%
- By 2040
- 457,529 · +0.7%
- By 2050
- 448,261 · -1.3%
- By 2075
- 427,388 · -5.9%
- By 2100
- 384,218 · -15.4%
Race, ethnicity, and origin ACS 2023
- Neighborhood character
- Predominantly White (89%)
- Race & ethnicity
- White 89% Black 4% Two or more races 4% Asian 2% Hispanic / Latino 2%
- Common ancestry
- Romanian 3% Slovak 3% Serbian 2%
- Foreign-born
- 4% · China
- Languages at home
- 95% English-only · Russian/Polish/Slavic 1% Chinese 1% Other Indo-European 1%
Political lean MEDSL · York
- 2024 margin
- Strong R (+25.3) · D 36.9% · R 62.1%
- 2008→2024 swing
- -11.7pp toward R · 2008: -13.6pp · 2024: -25.3pp
- All cycles
- 2024: R+25.3 2020: R+24.6 2016: R+29.3 2012: R+21.2 2008: R+13.6
Not yet ingested
- Civics
- —
Market trends
- HPI YoY
- ▼ -69.16%
- Current HPI
- 259.7294
- Rent YoY
- —
- Metro
- York-Hanover, PA
- State GDP YoY
- ▲ 1.68%
- F500 in state
- 34
Industry mix (Fortune 500 HQ in PA)
| Industry | F500 HQs | Revenue |
|---|---|---|
| Healthcare | 2 | $309B |
|
||
| Insurance | 2 | $27B |
|
||
| Telecommunications / Media | 1 | $124B |
|
||
| Industrial Distribution | 1 | $22B |
|
||
| Financial Services | 1 | $20B |
|
||
| Chemicals / Materials | 1 | $18B |
|
||
Price history
+198.6% since first listed2 events — show timeline
- 2026-06-05 Listed $149,900 BRIGHT MLS
- 1992-09-15 Sold (Public Records) $50,200 Public Records
Property tax history
+0.9%/yrLatest (2025): $2,639 · +3.0% YoY. Source: county tax records.
Cash-flow waterfall
monthlySold comps — $/sqft
last 12 mo · ≤1 miLoading sold comps…