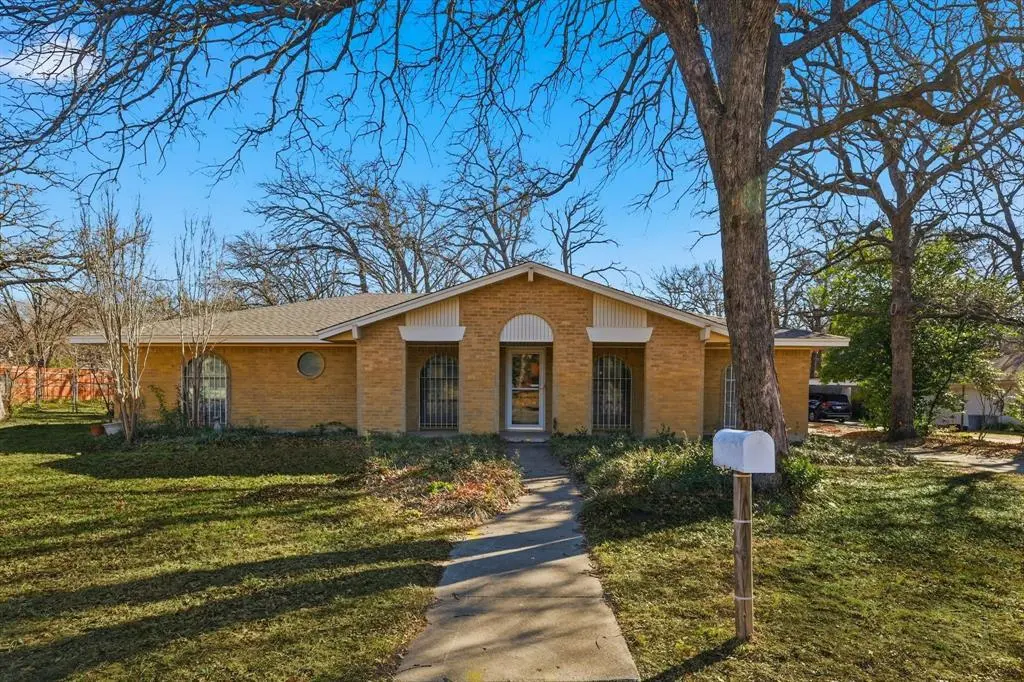
620 Cimarron Trl · Southlake, TX
Flood risk 1/10 · Minimal
- FEMA flood zone
- X (unshaded)
- Chance of flooding over 30 yrs
- 0.0%
- Est. flood insurance / yr
- $507 – $1,088
Fire risk 4/10 · Minor
- Est. fire insurance / yr
- $1,222 – $2,270
Heat risk 7/10 · Major
- Hot days now (above 109°F)
- 6 days/yr
- Hot days in 30 yrs
- 19 days/yr
Wind risk 4/10 · Minor
- Chance of severe wind over 30 yrs
- 24.0%
Air-quality risk 3/10 · Minor
- Unhealthy air days now
- 3 days/yr
- Unhealthy air days in 30 yrs
- 4 days/yr
Risk factors via First Street. Map © Google.
Why this score? — see what drove the B- grade
The composite is a weighted blend of 9 inputs, each scored 0–100. Each bar is that input's sub-score; the figure is the points it added to the 100-point composite (weight × sub-score).
- Cash flow +25.4/30.0
- ARV discount +15.0/15.0
- DSCR +8.4/10.0
- 1% rule +6.5/10.0
- Schools +4.8/10.0
- Livability +3.8/5.0
- Rent growth +2.5/5.0
- Condition / age +2.5/5.0
- Appreciation +0.0/10.0
$504,900
🖨 Deal sheet 📄 Offer letter ✓ Due diligence
Listing remarks
Welcome to this 3-bedroom, 2-bath home in highly sought-after Southlake, offering a rare opportunity to customize and make it your own. Nestled on a spacious, tree-filled lot, the property features a private well for irrigation—adding both value and efficiency. Inside, you’ll find a functional floor plan with generous living areas and a convenient Jack-and-Jill bathroom layout. While the home is ready for updates, it provides an excellent foundation to create your ideal living space. Located in a quiet, established neighborhood just minutes from shopping, dining, and everyday conveniences. Zoned for Keller ISD with potential eligibility for Southlake Carroll ISD. A unique opport
Key facts
- Zoned for keller isd
- 0.49 acre lot
- 2 garage spots
Tags
Neighborhood map
What this means for you Summary
Snapshot
- This is a 3-bed/2.0-bath single-family listed at $505k.
Deal economics
- At list price, monthly cash flow is $1k ($14k/yr) — positive.
- The deal already cash-flows at list — no discount required.
- Meets the 1% rule at list price ($6k rent vs $505k).
- Cap rate 9.0% vs local median 1.5% in Southlake — top-decile yield for the area; either an underpriced asset or a hidden risk that comps aren't pricing in. Stress-test before assuming the spread holds.
Location & tenants
- Location reads 76/100 on livability (#107 in TX, #3,547 nationally) — a middle-class / working-renter tenant base. Strengths: crime A+, employment A+, housing A+; Watch: amenities F, commute F, cost of living F.
- Keller ISD (urban): math 50% / reading 54% proficiency, ranked #91 of 826 in TX (top 11%) — acceptable for families but not a draw, mixed tenant base, ~2y average lease; only 19% free/reduced lunch — higher-income household profile.
- Zoned schools: Florence El (math 57% / reading 67%, grade B, #321 of 4,322 statewide, top 8%, 489 students, 11% FRL).
- Market conditions: 283 active listings in the ZIP; 3 comparable units currently listed for rent nearby; rentals leasing fast (median 3d on market — plan ~1-2 weeks tenant-placement turnaround); high-income renter base; 18,938 units permitted in Tarrant County in 2024 (8,336 in 5+ unit buildings).
Forward outlook
- Local home prices are declining (-3.0%/yr); year-one equity from $3k of loan paydown is wiped out by about $15k of value loss. Plan a longer hold.
- Tarrant County population projected at +41% by 2050 — long-run rental-demand tailwind backs the buy-and-hold thesis.
Negotiation context
- Only 12 days on market — expect competitive offers; lowballing is unlikely to land.
- 2 sale attempts with the ask held roughly flat each time — persistent listings suggest the price (not the market) is what's stuck; bring a comps-based counter.
Risks & watch-outs
- Climate carrying-cost: extreme-heat days projected 6→19/yr by 2055 (HVAC capex compounding) — expect insurance premiums to compound above CPI over the hold.
Questions for the listing agent
- Built in 1974 — when were the roof, HVAC, electrical panel, plumbing, and water heater last replaced?
- Is there a deadline driving the sale (1031 exchange, divorce, estate, relocation)? That informs how much negotiation room exists.
- Schools are A-rated — typically a magnet for longer-tenancy family renters. What's the average tenant stay here, and is there a school-zone premium baked into asking?
- What's the average days-on-market for RENTAL listings here right now (not sales)? A rising rental-DOM trend means longer vacancies and softer asking-rent achievability than the comps imply.
- What's the recent tenant-quality profile in this submarket — average credit score on applications, eviction rate, late-payment / NSF rate, and stable-employment percentage? A property-management company in the area should have these aggregated.
- How much new for-sale + rental construction is in the pipeline within 1–3 miles? Heavy new supply typically softens prices + rents 12–24 months out; constrained supply supports both.
Investment metrics
- 1% rule
- 1.15% ✓
- Cap rate
- 9.05%
- Cash-on-cash
- 9.83%
- DSCR
- 1.44
- GRM
- 7.3
CMA / ARV
- ARV (on-the-fly)
- $662,244
- Comps found
- 8
Show comp detail 8 sales within ~0.75 mi
| Address | Dist | Beds/Ba | Sqft | Sold | Price | $/sf | Match |
|---|---|---|---|---|---|---|---|
| 620 Cimarron Trl | 0.00mi | 3/2.0 | 1,914 (0%) | 1mo | $504,900 | $264 | 99 |
| 629 Cimarron Trl | 0.06mi | 3/2.0 | 1,858 (-3%) | 1mo | $644,000 | $347 | 91 |
| 624 Cimarron Trl | 0.03mi | 4/2.0 (+1) | 1,807 (-6%) | 8mo | $625,000 | $346 | 78 |
| 728 Cimarron Trl | 0.23mi | 3/2.0 | 2,068 (+8%) | 2mo | $615,000 | $297 | 74 |
| 1832 Johnson Rd | 0.51mi | 3/2.0 | 1,956 (+2%) | 8mo | $425,000 | $217 | 65 |
| 700 Cimarron Trl | 0.08mi | 3/2.0 | 1,728 (-10%) | 18mo | $599,999 | $347 | 65 |
| 2655 Johnson Rd | 0.46mi | 3/2.0 | 1,710 (-11%) | 5mo | $1,898,000 | $1,110 | 57 |
| 2000 Vista Ln | 0.51mi | 4/3.0 (+1) | 2,055 (+7%) | 12mo | $675,000 | $328 | 45 |
Match score weights: distance 35% · size 25% · config 20% · recency 20%. Top-matched comps best support the ARV.
Projected returns pro-forma
-3.0% appreciation · 3.0% rent growth · sell at horizon
- IRR
- -1.5%
- Equity multiple
- 0.94×
- Total profit
- $-8,009
- Equity at exit
- $75,282
- IRR
- 8.2%
- Equity multiple
- 1.62×
- Total profit
- $88,200
- Equity at exit
- $43,655
Cash invested: $141,372 (down + closing). Projections, not guarantees.
Landlord ↔ Tenant lean methodology
- Overall (STATE)
- 87 Strongly Landlord-Friendly
- State Texas
- 87 Strongly Landlord-Friendly · R+5
- County
- — inherits STATE
- City
- — inherits STATE
ZIP-level market 76092
- Home prices YoY
- -34.0%
- Active inventory
- 283
- Price-to-rent
- 7.3×
Monthly cashflow live
- Estimated rent
- $5,803 medium interval (Pro) →
- Mortgage (P&I)
- −$2,648
- Tax from tax record
- −$568 /mo · $6,818/yr
- Insurance
- −$210
- HOA
- −$0
- Vacancy / Maint / Mgmt
- −$1,219
- Net cashflow
- $1,158
Break-even live
UW: 25.0% down · 7.5% · 30yr · 1.5% tax · 5.0% vac · 8.0% maint · 8.0% mgmt
Financing live
Cash to close
- Down payment
- $126,225
- Closing costs
- $15,147
- Reserves months
- —
- Total cash needed
- —
Loan-product check · same deal, 3 products live
Conventional
25% down · 7.5% · 30yr
- Down + closing
- —
- Monthly P&I
- —
- Monthly cashflow
- —
- DSCR
- —
- Eligible?
- —
Personal DTI + credit; lowest rate.
DSCR
20% down · 8.5% · 30yr
- Down + closing
- —
- Monthly P&I
- —
- Monthly cashflow
- —
- DSCR
- —
- Eligible?
- —
No personal income docs; deal must DSCR.
Hard money
10% down · 12.0% · 12mo
- Down + closing
- —
- Monthly P&I
- —
- Monthly cashflow
- —
- DSCR
- —
- Eligible?
- —
Short-term bridge; refi at stabilization.
Rent comps 3 comps
| Address | Beds | Baths | Sqft | Rent | $/sqft | DOM | Units | Dist |
|---|---|---|---|---|---|---|---|---|
| 613 Overland Trl Southlake, TX | 4.0 | 2.5 | 2299 | $4,200 | $1.83 | 20d | 1 | 0.09mi |
| 301 Watermere Dr #414 Southlake, TX | 2.0 | 2.5 | 1572 | $10,750 | $6.84 | 1d | 1 | 0.96mi |
| 1300 Keller Pkwy Keller, TX | 1.0–2.0 | 1.0–2.0 | 990 | $2,436 | $2.46 | 3d | 15 | 1.50mi |
Listing history 6 events
-
2026-04-07status Pending
-
2026-04-06historical Active Option Contract
-
2026-03-26$504,900 Active
-
2026-03-25historical
-
2026-02-21price $509,900
-
2025-12-18$515,000 Active
ⓘ Source: listings_history table (triggers on properties + properties_extension) + one-shot
backfill from property_details.listing_events for pre-trigger history.
Tax reassessment forecast TX · Resets to sale price
- Current annual tax
- $6,818 · $568/mo
- Projected year-2 tax
- $9,240 · $770/mo
- Expected delta
- +$2,422/yr (+$202/mo · 35.5%)
ⓘ Screening estimate from a state-policy table — verify with the county assessor before closing.
Climate risk First Street
- Flood 1/10 Low FEMA zone X (unshaded) · 0% chance over 30 yrs
- Wildfire 4/10 Moderate
- Heat 7/10 Severe 6 d/yr ≥109°F today · 19 d/yr by 30 yrs out
- Wind 4/10 Moderate 24% chance of damaging wind over 30 yrs
- Air quality 3/10 Moderate 3 unhealthy d/yr today · 4 by 30 yrs out
Nearby sold comps map
Loading sold comps map…
Walkable amenities ~0.75 mi
Loading nearby amenities…
Taxation est. · year 1
- Rental income
- $69,636
- − Mortgage interest
- −$28,282
- − Property taxes
- −$6,818
- − Insurance
- −$2,524
- − Repairs & maintenance
- −$5,571
- − Management
- −$5,571
- − Depreciation
- −$14,688
- Taxable income
- $6,181
- Est. tax owed @ 24.0%
- −$1,484
- After-tax cash flow
- $12,413/yr
For passive investors: Depreciation is non-cash, so a rental often shows a tax loss while cash-flowing — sheltering income. Rental losses are passive: they offset passive income freely, and up to $25,000/yr can offset ordinary (W-2) income if you actively participate and your MAGI is under $100k (phasing out to $0 by $150k); unused losses carry forward. On sale, claimed depreciation is recaptured at up to 25%, and gains may owe capital-gains tax (a 1031 exchange can defer both). Figures are a year-1 estimate at your 24.0% rate — not tax advice; consult a CPA.
Schools (NCES district)
- District
- Keller ISD
- NCES district ID
- 4825260
- Math proficiency
- 50% ▼ -14.00%
- Reading proficiency
- 54% ▼ -9.00%
- Median HH income
- $92,106
- Composite
- 48.46/100
- National rank
- #2131
- State rank
- #91 of 826 in TX
Livability — Southlake
- Score
- 76/100
- State rank
- #107
- US rank
- #3547
Category grades
Schools grade is shown separately in the Schools card above.
Census & demographics
- Census place
- Southlake, TX
- County
- Tarrant County · 2,033,669 people
- City population
- 31,520
- Metro
- Dallas-Fort Worth-Arlington, TX
- Population (ZIP)
- 31,520
- Household income
- $250,001
- Rent vs Own
- Severe rent burden
- 137.0
Population outlook (Tarrant County) Hauer SSP2
- Today (2025)
- 2,380,417 people
- By 2030
- 2,578,900 · +8.3%
- By 2040
- 2,974,995 · +25.0%
- By 2050
- 3,350,489 · +40.8%
- By 2075
- 4,216,909 · +77.2%
- By 2100
- 4,741,527 · +99.2%
Race, ethnicity, and origin ACS 2023
- Neighborhood character
- Predominantly White (69%)
- Race & ethnicity
- White 69% Asian 16% Hispanic / Latino 9% Two or more races 8% Black 2%
- Hispanic origin (detail)
- Mexican 4%
- Common ancestry
- Romanian 3% Slovak 2% Lithuanian 1%
- Foreign-born
- 16% · Canada, China, Vietnam
- Languages at home
- 82% English-only · Spanish 5% Chinese 4% Other Indo-European 3%
Political lean MEDSL · Tarrant
- 2024 margin
- Lean R (+5.1) · D 46.7% · R 51.9% · Other 1.4%
- 2008→2024 swing
- +6.6pp toward D · 2008: -11.7pp · 2024: -5.1pp
- All cycles
- 2024: R+5.1 2020: D+0.2 2016: R+8.7 2012: R+15.7 2008: R+11.7
Not yet ingested
- Civics
- —
Market trends
- HPI YoY
- ▼ -155.85%
- Current HPI
- 302.8677
- Rent YoY
- —
- Metro
- Dallas-Fort Worth-Arlington, TX
- State GDP YoY
- ▲ 3.95%
- F500 in state
- 110
Industry mix (Fortune 500 HQ in TX)
| Industry | F500 HQs | Revenue |
|---|---|---|
| Energy | 16 | $1,198B |
|
||
| Technology | 5 | $198B |
|
||
| Engineering / Construction | 4 | $72B |
|
||
| Energy Services | 3 | $60B |
|
||
| Utilities | 3 | $41B |
|
||
| Healthcare | 2 | $330B |
|
||
Price history
-2.0% since first listed6 events — show timeline
- 2026-04-07 Pending — NTREIS
- 2026-04-06 Contingent — NTREIS
- 2026-03-26 Listed $504,900 NTREIS
- 2026-03-25 Listing Removed — NTREIS
- 2026-02-21 Price Changed $509,900 NTREIS
- 2025-12-18 Listed $515,000 NTREIS
Property tax history
+2.1%/yrLatest (2025): $6,818 · -1.5% YoY. Source: county tax records.
Cash-flow waterfall
monthlySold comps — $/sqft
last 12 mo · ≤1 miLoading sold comps…