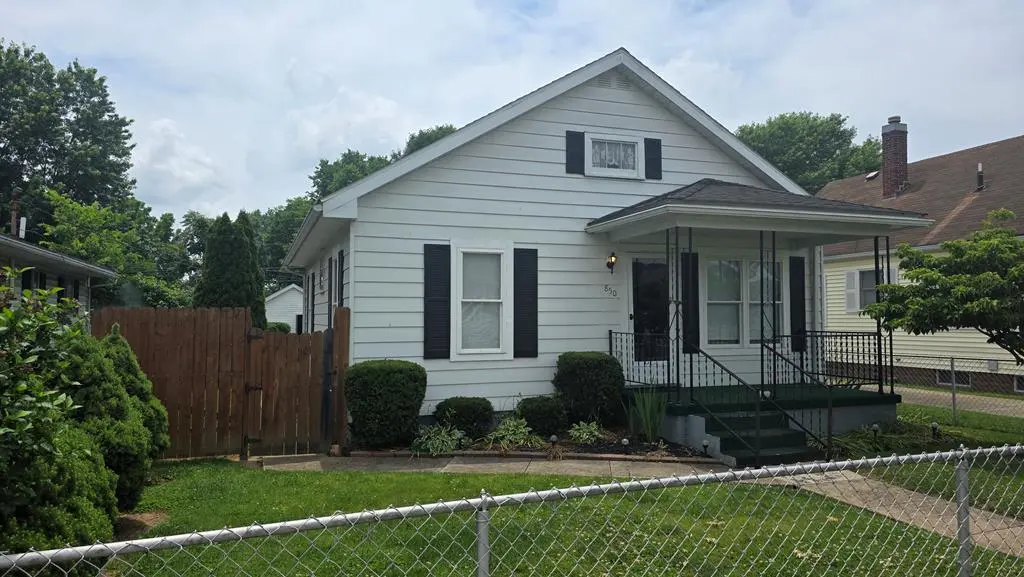
850 Jefferson Ave · Chillicothe, OH
Flood risk 1/10 · Minimal
- FEMA flood zone
- X (unshaded)
- Chance of flooding over 30 yrs
- 0.0%
- Est. flood insurance / yr
- $473 – $860
Fire risk 1/10 · Minimal
- Est. fire insurance / yr
- $713 – $1,323
Heat risk 4/10 · Minor
- Hot days now (above 101°F)
- 7 days/yr
- Hot days in 30 yrs
- 18 days/yr
Wind risk 2/10 · Minimal
- Chance of severe wind over 30 yrs
- 1.0%
Air-quality risk 2/10 · Minimal
- Unhealthy air days now
- 1 days/yr
- Unhealthy air days in 30 yrs
- 2 days/yr
Risk factors via First Street. Map © Google.
Why this score? — see what drove the B+ grade
The composite is a weighted blend of 9 inputs, each scored 0–100. Each bar is that input's sub-score; the figure is the points it added to the 100-point composite (weight × sub-score).
- Cash flow +30.0/30.0
- ARV discount +15.0/15.0
- 1% rule +10.0/10.0
- DSCR +10.0/10.0
- Schools +3.5/10.0
- Livability +3.1/5.0
- Rent growth +2.5/5.0
- Condition / age +2.5/5.0
- Appreciation +0.0/10.0
$59,860
🖨 Deal sheet 📄 Offer letter ✓ Due diligence
Listing remarks
"Kight" Auction - Tues. , July 7th 6 PM - Open House: Mon. , June 29th 5-6 PM - $59,860 Minimum Bid!! - One floor plan home - 2 Bedrooms - Full Updated Bathroom - Large Eat In Kitchen - Very Nice Home with front and back yards with fencing - Detached Garage with Rear Alley Access. Terms: $7,500 down at time of sale cash or check with positive photo ID, Balance due at closing on/before August 7, 2026, Possession upon delivery of deed, Sold in As-Is condition with no warranties or guarantees, No buyers contingencies exist, Real Estate taxes pro-rated to date of closing.
Key facts
- Large eat in kitchen
- Front and back yards
- One floor plan home
Tags
Property features AI
Finance
- Other: Residential property; Located at 850 Jefferson Ave, Chillicothe, OH
- Financial info: No investor or income/expense details provided
- HOA & community: No HOA details provided
Exterior
- Parking: Detached garage; 1 covered parking space (1 total parking space)
- Security: No security details provided
- Utilities: No additional utility details provided
- Home design: Single-family residence; One story
- Construction: No construction material or year built provided
- Exterior features: Asphalt roof; Lot dimensions approximately 40 x 132 (0.1212 acres)
Interior
- Kitchen: No kitchen appliance details provided
- Bedrooms: 2 bedrooms on the main level
- Flooring: Carpet; Linoleum
- Bathrooms: 1 full bathroom
- Heating & cooling: Natural gas heating; Central air conditioning
- Interior features: Gas water heater; Crawl space / partial basement
- Laundry & utility: No laundry details provided
Neighborhood map
What this means for you Summary
Snapshot
- This is a 2-bed/1.0-bath single-family listed at $60k.
Deal economics
- At list price, monthly cash flow is $493 ($6k/yr) — positive.
- The deal already cash-flows at list — no discount required.
- Meets the 1% rule at list price ($1k rent vs $60k).
- Cap rate 16.2% vs local median 4.2% in Chillicothe — top-decile yield for the area; either an underpriced asset or a hidden risk that comps aren't pricing in. Stress-test before assuming the spread holds.
Location & tenants
- Location reads 62/100 on livability (#909 in OH) — a middle-class / working-renter tenant base. Strengths: cost of living A+, housing A+; Watch: employment D, crime D-, amenities F.
- Chillicothe City (town): math 36% / reading 47% proficiency, ranked #535 of 656 in OH (top 82%) — families likely to look elsewhere, expect single-tenant / working-renter base with shorter leases.
- Zoned schools: Chillicothe Primary School (570 students, 0% FRL); Chillicothe Middle School (math 29% / reading 43%, grade F, #541 of 654 statewide, top 83%, 395 students, 0% FRL); Chillicothe High School (math 32% / reading 57%, grade F, #470 of 781 statewide, top 62%, 885 students, 0% FRL) — zoned schools average 0% FRL vs 57% district-wide (57 pts lower); this property's tenant base skews higher-income than the district average.
- Market conditions: 178 active listings in the ZIP; 24 units permitted in Ross County in 2024 (0 in 5+ unit buildings).
Forward outlook
- Local home prices are declining (-3.0%/yr); year-one equity from $414 of loan paydown is wiped out by about $2k of value loss. Plan a longer hold.
- Ross County population projected at -12% by 2050 — secular population decline; favor cash flow + early exit over multi-decade hold.
- At projected returns (-3.0% appreciation + 3.0% rent growth), your $17k cash investment doubles in ~4 years — after that, you're playing with house money.
Negotiation context
- Only 9 days on market — expect competitive offers; lowballing is unlikely to land.
Risks & watch-outs
- Watch-outs: built in 1940 — expect roof / HVAC / electrical / plumbing capex.
Questions for the listing agent
- Built in 1940 — when were the roof, HVAC, electrical panel, plumbing, and water heater last replaced?
- Is there a deadline driving the sale (1031 exchange, divorce, estate, relocation)? That informs how much negotiation room exists.
- Schools are B-rated — typically a magnet for longer-tenancy family renters. What's the average tenant stay here, and is there a school-zone premium baked into asking?
- Crime grade is D in this area — have there been break-ins, vandalism, or insurance claims at this property in the last 3 years? What carrier currently insures it and at what premium?
- What's the average days-on-market for RENTAL listings here right now (not sales)? A rising rental-DOM trend means longer vacancies and softer asking-rent achievability than the comps imply.
- What's the recent tenant-quality profile in this submarket — average credit score on applications, eviction rate, late-payment / NSF rate, and stable-employment percentage? A property-management company in the area should have these aggregated.
- How much new for-sale + rental construction is in the pipeline within 1–3 miles? Heavy new supply typically softens prices + rents 12–24 months out; constrained supply supports both.
Investment metrics
- 1% rule
- 1.83% ✓
- Cap rate
- 16.17%
- Cash-on-cash
- 35.28%
- DSCR
- 2.57
- GRM
- 4.6
CMA / ARV
- ARV (on-the-fly)
- $94,640
- Comps found
- 12
Show comp detail 12 sales within ~0.75 mi
| Address | Dist | Beds/Ba | Sqft | Sold | Price | $/sf | Match |
|---|---|---|---|---|---|---|---|
| 898 Jefferson Ave | 0.03mi | 2/1.0 | 720 (-1%) | 16mo | $70,000 | $97 | 84 |
| 910 Adams Ave | 0.14mi | 2/1.0 | 800 (+10%) | 2mo | $80,000 | $100 | 75 |
| 896 Fleet St | 0.21mi | 2/1.0 | 725 (-0%) | 18mo | $90,900 | $125 | 75 |
| 896 Jefferson Ave | 0.02mi | 1/1.0 (-1) | 701 (-4%) | 17mo | $91,100 | $130 | 74 |
| 964 Dayton St | 0.23mi | 2/1.0 | 688 (-6%) | 11mo | $107,000 | $156 | 71 |
| 87 S Brownell St | 0.37mi | 3/1.0 (+1) | 720 (-1%) | 8mo | $29,900 | $42 | 69 |
| 953 Gilmore St | 0.22mi | 2/1.0 | 650 (-11%) | 10mo | $139,000 | $214 | 63 |
| 1031 Dayton St | 0.35mi | 1/1.0 (-1) | 660 (-9%) | 1mo | $86,000 | $130 | 62 |
| 396 Mckellar St | 0.66mi | 1/1.0 (-1) | 762 (+5%) | 8mo | $43,000 | $56 | 50 |
| 895 Fleet St | 0.22mi | 2/1.0 | 625 (-14%) | 20mo | $109,900 | $176 | 50 |
| 512 Goff St | 0.51mi | 2/1.0 | 832 (+14%) | 14mo | $75,000 | $90 | 41 |
| 339 Massie Ave | 0.69mi | 3/1.0 (+1) | 832 (+14%) | 6mo | $159,000 | $191 | 34 |
Match score weights: distance 35% · size 25% · config 20% · recency 20%. Top-matched comps best support the ARV.
Projected returns pro-forma
-3.0% appreciation · 3.0% rent growth · sell at horizon
- IRR
- 30.9%
- Equity multiple
- 2.29×
- Total profit
- $21,675
- Equity at exit
- $8,925
- IRR
- 38.0%
- Equity multiple
- 4.53×
- Total profit
- $59,248
- Equity at exit
- $5,176
Cash invested: $16,761 (down + closing). Projections, not guarantees.
Landlord ↔ Tenant lean methodology
- Overall (STATE)
- 73 Landlord-Friendly
- State Ohio
- 73 Landlord-Friendly · R+6
- County
- — inherits STATE
- City
- — inherits STATE
ZIP-level market 45601
- Active inventory
- 178
- Price-to-rent
- 4.6×
Monthly cashflow live
- Estimated rent
- $1,094 medium interval (Pro) →
- Mortgage (P&I)
- −$314
- Tax from tax record
- −$32 /mo · $390/yr
- Insurance
- −$25
- HOA
- −$0
- Vacancy / Maint / Mgmt
- −$230
- Net cashflow
- $493
Break-even live
UW: 25.0% down · 7.5% · 30yr · 1.5% tax · 5.0% vac · 8.0% maint · 8.0% mgmt
Financing live
Cash to close
- Down payment
- $14,965
- Closing costs
- $1,796
- Reserves months
- —
- Total cash needed
- —
Loan-product check · same deal, 3 products live
Conventional
25% down · 7.5% · 30yr
- Down + closing
- —
- Monthly P&I
- —
- Monthly cashflow
- —
- DSCR
- —
- Eligible?
- —
Personal DTI + credit; lowest rate.
DSCR
20% down · 8.5% · 30yr
- Down + closing
- —
- Monthly P&I
- —
- Monthly cashflow
- —
- DSCR
- —
- Eligible?
- —
No personal income docs; deal must DSCR.
Hard money
10% down · 12.0% · 12mo
- Down + closing
- —
- Monthly P&I
- —
- Monthly cashflow
- —
- DSCR
- —
- Eligible?
- —
Short-term bridge; refi at stabilization.
Listing history 8 events
-
2026-06-18days on market $59,860 Active 9 DOM
-
2026-06-17days on market $59,860 Active 8 DOM
-
2026-06-16days on market $59,860 Active 7 DOM
-
2026-06-15days on market $59,860 Active 6 DOM
-
2026-06-13days on market $59,860 Active 4 DOM
-
2026-06-12days on market $59,860 Active 3 DOM
-
2026-06-09remarks 574-char remark
-
2026-06-09$59,860 Active 1 DOM
ⓘ Source: listings_history table (triggers on properties + properties_extension) + one-shot
backfill from property_details.listing_events for pre-trigger history.
Tax reassessment forecast OH · Partial reset (capped growth)
- Current annual tax
- $390 · $32/mo
- Projected year-2 tax
- $662 · $55/mo
- Expected delta
- +$272/yr (+$23/mo · 69.8%)
ⓘ Screening estimate from a state-policy table — verify with the county assessor before closing.
Climate risk First Street
- Flood 1/10 Low FEMA zone X (unshaded) · 0% chance over 30 yrs
- Wildfire 1/10 Low
- Heat 4/10 Moderate 7 d/yr ≥101°F today · 18 d/yr by 30 yrs out
- Wind 2/10 Low 100% chance of damaging wind over 30 yrs
- Air quality 2/10 Low 1 unhealthy d/yr today · 2 by 30 yrs out
Nearby sold comps map
Loading sold comps map…
Walkable amenities ~0.75 mi
Loading nearby amenities…
Taxation est. · year 1
- Rental income
- $13,126
- − Mortgage interest
- −$3,353
- − Property taxes
- −$390
- − Insurance
- −$299
- − Repairs & maintenance
- −$1,050
- − Management
- −$1,050
- − Depreciation
- −$1,741
- Taxable income
- $5,242
- Est. tax owed @ 24.0%
- −$1,258
- After-tax cash flow
- $4,655/yr
For passive investors: Depreciation is non-cash, so a rental often shows a tax loss while cash-flowing — sheltering income. Rental losses are passive: they offset passive income freely, and up to $25,000/yr can offset ordinary (W-2) income if you actively participate and your MAGI is under $100k (phasing out to $0 by $150k); unused losses carry forward. On sale, claimed depreciation is recaptured at up to 25%, and gains may owe capital-gains tax (a 1031 exchange can defer both). Figures are a year-1 estimate at your 24.0% rate — not tax advice; consult a CPA.
Schools (NCES district)
- District
- Chillicothe City
- NCES district ID
- 3904374
- Math proficiency
- 36% ▼ -12.00%
- Reading proficiency
- 47% ▼ -11.00%
- Median HH income
- $37,990
- Composite
- 34.55/100
- National rank
- #5174
- State rank
- #535 of 656 in OH
Livability — Chillicothe
- Score
- 62/100
- State rank
- #909
- US rank
- #17195
Category grades
Schools grade is shown separately in the Schools card above.
Census & demographics
- Census place
- Chillicothe, OH
- County
- Ross · 75,517 people
- Population (ZIP)
- 56,453
- Household income
- $57,430
- Rent vs Own
- Severe rent burden
- 10.6
Population outlook (Ross County) Hauer SSP2
- Today (2025)
- 75,482 people
- By 2030
- 74,035 · -1.9%
- By 2040
- 70,702 · -6.3%
- By 2050
- 66,706 · -11.6%
- By 2075
- 55,398 · -26.6%
- By 2100
- 42,197 · -44.1%
Race, ethnicity, and origin ACS 2023
- Neighborhood character
- Predominantly White (86%)
- Race & ethnicity
- White 86% Black 7% Two or more races 4% Hispanic / Latino 2%
- Common ancestry
- Slovak 2% Iranian 1% Italian 1%
- Foreign-born
- 1% · Canada
- Languages at home
- 98% English-only · Spanish 1%
Political lean MEDSL · Ross
- 2024 margin
- Solid R (+39.3) · D 29.9% · R 69.2%
- 2008→2024 swing
- -32.1pp toward R · 2008: -7.2pp · 2024: -39.3pp
- All cycles
- 2024: R+39.3 2020: R+35.2 2016: R+27.4 2012: R+2.4 2008: R+7.2
Not yet ingested
- Civics
- —
Market trends
- HPI YoY
- ▼ -231.40%
- Current HPI
- 205.7051
- Rent YoY
- —
- Metro
- —
- State GDP YoY
- ▲ 1.98%
- F500 in state
- 48
Industry mix (Fortune 500 HQ in OH)
| Industry | F500 HQs | Revenue |
|---|---|---|
| Insurance | 3 | $145B |
|
||
| Industrial Machinery | 3 | $49B |
|
||
| Financial Services | 3 | $24B |
|
||
| Consumer Goods | 2 | $93B |
|
||
| Aerospace / Defense | 2 | $47B |
|
||
| Utilities | 2 | $33B |
|
||
Price history
1 event — show timeline
- 2026-06-09 Listed $59,860 SVAR
Property tax history
-7.6%/yrLatest (2025): $390 · +108.6% YoY. Source: county tax records.
Cash-flow waterfall
monthlySold comps — $/sqft
last 12 mo · ≤1 miLoading sold comps…