 🏷️ Likely Rental
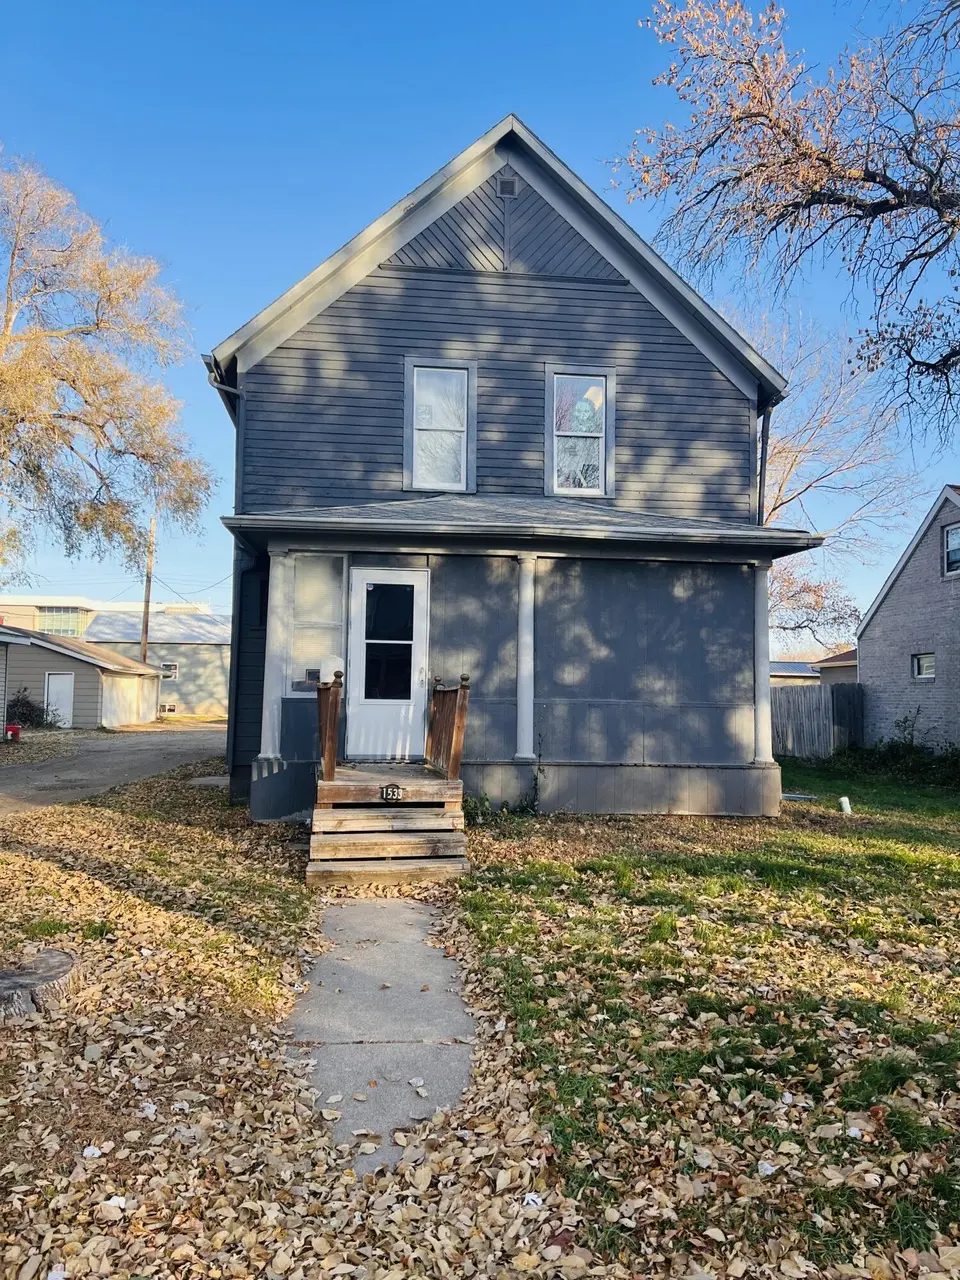
1533 S Grant St · Aberdeen, SD
Flood risk 1/10 · Minimal
- FEMA flood zone
- X (unshaded)
- Chance of flooding over 30 yrs
- 0.0%
- Est. flood insurance / yr
- $473 – $860
Fire risk 4/10 · Minor
- Est. fire insurance / yr
- $1,342 – $2,492
Heat risk 2/10 · Minimal
- Hot days now (above 99°F)
- 7 days/yr
- Hot days in 30 yrs
- 13 days/yr
Wind risk 2/10 · Minimal
- Chance of severe wind over 30 yrs
- —
Air-quality risk 2/10 · Minimal
- Unhealthy air days now
- 1 days/yr
- Unhealthy air days in 30 yrs
- 1 days/yr
Risk factors via First Street. Map © Google.
Why this score? — see what drove the B grade
The composite is a weighted blend of 9 inputs, each scored 0–100. Each bar is that input's sub-score; the figure is the points it added to the 100-point composite (weight × sub-score).
- Cash flow +28.6/30.0
- ARV discount +15.0/15.0
- DSCR +10.0/10.0
- 1% rule +8.0/10.0
- Schools +4.2/10.0
- Livability +4.0/5.0
- Rent growth +2.5/5.0
- Condition / age +2.5/5.0
- Appreciation +0.0/10.0
$118,900
🖨 Deal sheet 📄 Offer letter ✓ Due diligence
Listing remarks MLS
Are you ready for the purchase of a lifetime? Your dream of owning a successful investment property is here!! This 4 BD, 2BA home is a short walk from Melgaard Park, NSU, and the new football stadium! This lot offers off-street parking and a 2-stall garage for winter storage. The back patio is a perfect hang out for those relaxing summer nights. To be sold AS IS. Subject to tenant's rights. Please allow 48 hours for showings.
Key facts
- 6,969 sq ft lot
- 2 garage spots
- Built 1910
Neighborhood map
What this means for you Summary
Snapshot
- This is a 4-bed/2.0-bath single-family listed at $119k.
Deal economics
- At list price, monthly cash flow is $392 ($5k/yr) — positive.
- The deal already cash-flows at list — no discount required.
- Meets the 1% rule at list price ($2k rent vs $119k).
- Recommended offer: $105k (12.0% below list) — sets the bar for market timing.
- Cap rate 10.2% vs local median 2.9% in Aberdeen — top-decile yield for the area; either an underpriced asset or a hidden risk that comps aren't pricing in. Stress-test before assuming the spread holds.
Location & tenants
- Location reads 81/100 on livability (#7 in SD, #1,411 nationally) — a professional / high-income tenant draw. Strengths: cost of living A+, housing A+, health & safety A+; Watch: commute F.
- Aberdeen School District 06-1 (town): math 45% / reading 54% proficiency, ranked #33 of 59 in SD (top 56%) — families likely to look elsewhere, expect single-tenant / working-renter base with shorter leases.
- Market conditions: 174 active listings in the ZIP; 86 units permitted in Brown County in 2024 (0 in 5+ unit buildings).
Forward outlook
- Local home prices are declining (-3.0%/yr); year-one equity from $822 of loan paydown is wiped out by about $4k of value loss. Plan a longer hold.
- Brown County population projected at +37% by 2050 — long-run rental-demand tailwind backs the buy-and-hold thesis.
- At projected returns (-3.0% appreciation + 3.0% rent growth), your $33k cash investment doubles in ~9 years — after that, you're playing with house money.
Negotiation context
- It's been on market 219 days — a 12% lower offer ($105k) is reasonable based on typical stale-listing flexibility.
- 2 sale attempts since 5y ago; this cycle's ask has dropped $13k (10%) from the opening price — seller is motivated, your offer sets the floor, not the list.
Risks & watch-outs
- Watch-outs: built in 1910 — expect roof / HVAC / electrical / plumbing capex.
Questions for the listing agent
- It's been on market 219 days. Have you received any prior offers? Is the seller open to a 12% concession, seller financing, or rate buy-down credit?
- Built in 1910 — when were the roof, HVAC, electrical panel, plumbing, and water heater last replaced?
- Why hasn't it sold? Are there any deal-killer items the seller is aware of (foundation, flood, title, zoning, code violations)?
- Is there a deadline driving the sale (1031 exchange, divorce, estate, relocation)? That informs how much negotiation room exists.
- Schools are B-rated — typically a magnet for longer-tenancy family renters. What's the average tenant stay here, and is there a school-zone premium baked into asking?
- What's the average days-on-market for RENTAL listings here right now (not sales)? A rising rental-DOM trend means longer vacancies and softer asking-rent achievability than the comps imply.
- What's the recent tenant-quality profile in this submarket — average credit score on applications, eviction rate, late-payment / NSF rate, and stable-employment percentage? A property-management company in the area should have these aggregated.
- How much new for-sale + rental construction is in the pipeline within 1–3 miles? Heavy new supply typically softens prices + rents 12–24 months out; constrained supply supports both.
Investment metrics
- 1% rule
- 1.30% ✓
- Cap rate
- 10.24%
- Cash-on-cash
- 14.11%
- DSCR
- 1.63
- GRM
- 6.4
CMA / ARV
- ARV (median comp)
- $210,708
- List price
- $118,900
- Delta
- -43.57%
- Verdict
- UNDERPRICED
- Comps
- 20 within 1.0 mi
Show comp detail 12 sales within ~0.75 mi
| Address | Dist | Beds/Ba | Sqft | Sold | Price | $/sf | Match |
|---|---|---|---|---|---|---|---|
| 1502 S Grant St | 0.08mi | 4/2.0 | 1,485 (+2%) | 2mo | $149,900 | $101 | 92 |
| 1514 S Main St | 0.23mi | 3/2.0 (-1) | 1,547 (+6%) | 2mo | $235,000 | $152 | 72 |
| 118 Church Dr | 0.41mi | 4/3.0 | 1,388 (-5%) | 1mo | $305,000 | $220 | 68 |
| 1404 S 2nd St | 0.39mi | 3/1.0 (-1) | 1,408 (-3%) | 3mo | $179,000 | $127 | 65 |
| 1431 Dick Dr | 0.42mi | 3/2.0 (-1) | 1,378 (-5%) | 3mo | $297,500 | $216 | 64 |
| 17 SW 9th Ave | 0.61mi | 4/3.0 | 1,472 (+1%) | 5mo | $180,000 | $122 | 61 |
| 324 SW 10th Ave | 0.68mi | 4/1.0 | 1,427 (-2%) | 3mo | $165,000 | $116 | 59 |
| 201 SW 8th Ave | 0.71mi | 3/2.0 (-1) | 1,480 (+2%) | 1mo | $95,000 | $64 | 58 |
| 124 SW 13th Ave | 0.43mi | 3/2.0 (-1) | 1,558 (+7%) | 6mo | $220,000 | $141 | 58 |
| 612 S Arch St | 0.75mi | 3/2.0 (-1) | 1,440 (-1%) | 1mo | $145,000 | $101 | 57 |
| 310 SW 9th Ave | 0.73mi | 4/2.0 | 1,364 (-6%) | 5mo | $165,000 | $121 | 51 |
| 516 SE 10th Ave | 0.50mi | 3/2.0 (-1) | 1,640 (+13%) | 3mo | $210,000 | $128 | 48 |
Match score weights: distance 35% · size 25% · config 20% · recency 20%. Top-matched comps best support the ARV.
Projected returns pro-forma
-3.0% appreciation · 3.0% rent growth · sell at horizon
- IRR
- 4.4%
- Equity multiple
- 1.17×
- Total profit
- $5,702
- Equity at exit
- $17,728
- IRR
- 13.9%
- Equity multiple
- 2.12×
- Total profit
- $37,201
- Equity at exit
- $10,280
Cash invested: $33,292 (down + closing). Projections, not guarantees.
Landlord ↔ Tenant lean methodology
- Overall (STATE)
- 83 Strongly Landlord-Friendly
- State South Dakota
- 83 Strongly Landlord-Friendly · R+16
- County
- — inherits STATE
- City
- — inherits STATE
ZIP-level market 57401
- Active inventory
- 174
- Price-to-rent
- 6.4×
Monthly cashflow live
- Estimated rent
- $1,550 medium interval (Pro) →
- Mortgage (P&I)
- −$624
- Tax from tax record
- −$160 /mo · $1,921/yr
- Insurance
- −$50
- HOA
- −$0
- Vacancy / Maint / Mgmt
- −$326
- Net cashflow
- $392
Break-even live
UW: 25.0% down · 7.5% · 30yr · 1.5% tax · 5.0% vac · 8.0% maint · 8.0% mgmt
Financing live
Cash to close
- Down payment
- $29,725
- Closing costs
- $3,567
- Reserves months
- —
- Total cash needed
- —
Loan-product check · same deal, 3 products live
Conventional
25% down · 7.5% · 30yr
- Down + closing
- —
- Monthly P&I
- —
- Monthly cashflow
- —
- DSCR
- —
- Eligible?
- —
Personal DTI + credit; lowest rate.
DSCR
20% down · 8.5% · 30yr
- Down + closing
- —
- Monthly P&I
- —
- Monthly cashflow
- —
- DSCR
- —
- Eligible?
- —
No personal income docs; deal must DSCR.
Hard money
10% down · 12.0% · 12mo
- Down + closing
- —
- Monthly P&I
- —
- Monthly cashflow
- —
- DSCR
- —
- Eligible?
- —
Short-term bridge; refi at stabilization.
Listing history 22 events
-
2026-06-19days on market $118,900 Active 219 DOM
-
2026-06-18days on market $118,900 Active 218 DOM
-
2026-06-17days on market $118,900 Active 217 DOM
-
2026-06-16days on market $118,900 Active 216 DOM
-
2026-06-15days on market $118,900 Active 215 DOM
-
2026-06-14days on market $118,900 Active 213 DOM
-
2026-06-12days on market $118,900 Active 212 DOM
-
2026-06-09days on market $118,900 Active 209 DOM
-
2026-06-08days on market $118,900 Active 208 DOM
-
2026-06-07days on market $118,900 Active 207 DOM
-
2026-06-05days on market $118,900 Active 204 DOM
-
2026-06-03days on market $118,900 Active 203 DOM
-
2026-06-02days on market $118,900 Active 202 DOM
-
2026-06-01days on market $118,900 Active 201 DOM
-
2026-05-31days on market $118,900 Active 200 DOM
-
2026-05-30days on market $118,900 Active 199 DOM
-
2026-01-30price $118,900
-
2025-12-04price $121,900
-
2025-11-12$131,900 Active
-
2022-02-25soldstatus $123,000 429-char remark
Show marketing remark (429 chars)
Are you ready for the purchase of a lifetime? Your dream of owning a successful investment property is here!! This 4 BD, 2BA home is a short walk from Melgaard Park, NSU, and the new football stadium! This lot offers off-street parking and a 2-stall garage for winter storage. The back patio is a perfect hang out for those relaxing summer nights. To be sold AS IS. Subject to tenant's rights. Please allow 48 hours for showings.
-
2021-11-20$130,000 429-char remark
Show marketing remark (429 chars)
Are you ready for the purchase of a lifetime? Your dream of owning a successful investment property is here!! This 4 BD, 2BA home is a short walk from Melgaard Park, NSU, and the new football stadium! This lot offers off-street parking and a 2-stall garage for winter storage. The back patio is a perfect hang out for those relaxing summer nights. To be sold AS IS. Subject to tenant's rights. Please allow 48 hours for showings.
-
2000-07-28soldstatus $41,900
ⓘ Source: listings_history table (triggers on properties + properties_extension) + one-shot
backfill from property_details.listing_events for pre-trigger history.
Tax reassessment forecast SD · Resets to sale price
- Current annual tax
- $1,921 · $160/mo
- Projected year-2 tax
- $1,921 · $160/mo
- Expected delta
- $0/yr ($0/mo · 0.0%)
ⓘ Screening estimate from a state-policy table — verify with the county assessor before closing.
Climate risk First Street
- Flood 1/10 Low FEMA zone X (unshaded) · 0% chance over 30 yrs
- Wildfire 4/10 Moderate
- Heat 2/10 Low 7 d/yr ≥99°F today · 13 d/yr by 30 yrs out
- Wind 2/10 Low
- Air quality 2/10 Low 1 unhealthy d/yr today · 1 by 30 yrs out
Nearby sold comps map
Loading sold comps map…
Walkable amenities ~0.75 mi
Loading nearby amenities…
Taxation est. · year 1
- Rental income
- $18,603
- − Mortgage interest
- −$6,660
- − Property taxes
- −$1,921
- − Insurance
- −$594
- − Repairs & maintenance
- −$1,488
- − Management
- −$1,488
- − Depreciation
- −$3,459
- Taxable income
- $2,992
- Est. tax owed @ 24.0%
- −$718
- After-tax cash flow
- $3,981/yr
For passive investors: Depreciation is non-cash, so a rental often shows a tax loss while cash-flowing — sheltering income. Rental losses are passive: they offset passive income freely, and up to $25,000/yr can offset ordinary (W-2) income if you actively participate and your MAGI is under $100k (phasing out to $0 by $150k); unused losses carry forward. On sale, claimed depreciation is recaptured at up to 25%, and gains may owe capital-gains tax (a 1031 exchange can defer both). Figures are a year-1 estimate at your 24.0% rate — not tax advice; consult a CPA.
Schools (NCES district)
- District
- Aberdeen School District 06-1
- NCES district ID
- 4602070
- Math proficiency
- 45% ▼ -5.00%
- Reading proficiency
- 54% ▼ -4.00%
- Median HH income
- $49,230
- Composite
- 42.27/100
- National rank
- #3273
- State rank
- #33 of 59 in SD
Livability — Aberdeen
- Score
- 81/100
- State rank
- #7
- US rank
- #1411
Category grades
Schools grade is shown separately in the Schools card above.
Census & demographics
- Census place
- Aberdeen, SD
- County
- Brown County · 31,939 people
- City population
- 31,939
- Metro
- Aberdeen, SD
- Population (ZIP)
- 31,939
- Household income
- $68,835
- Rent vs Own
- Severe rent burden
- 1220.0
Population outlook (Brown County) Hauer SSP2
- Today (2025)
- 43,830 people
- By 2030
- 46,663 · +6.5%
- By 2040
- 52,852 · +20.6%
- By 2050
- 59,898 · +36.7%
- By 2075
- 82,750 · +88.8%
- By 2100
- 112,639 · +157.0%
Race, ethnicity, and origin ACS 2023
- Neighborhood character
- Predominantly White (83%)
- Race & ethnicity
- White 83% Two or more races 6% Native American 5% Hispanic / Latino 5% Asian 3%
- Common ancestry
- Portuguese 12% Scotch-Irish 3% Lithuanian 2%
- Foreign-born
- 4% · Canada, South Korea, Philippines
- Languages at home
- 93% English-only · Spanish 3% Other Asian/Pacific 1% German/W. Germanic 1%
Political lean MEDSL · Brown
- 2024 margin
- Strong R (+26.8) · D 35.6% · R 62.5% · Other 1.9%
- 2008→2024 swing
- -32.4pp toward R · 2008: 5.6pp · 2024: -26.8pp
- All cycles
- 2024: R+26.8 2020: R+23.0 2016: R+25.8 2012: R+6.7 2008: D+5.6
Not yet ingested
- Civics
- —
Market trends
- HPI YoY
- ▼ -224.77%
- Current HPI
- 185.713
- Rent YoY
- —
- Metro
- Aberdeen, SD
- State GDP YoY
- ▲ 0.70%
- F500 in state
- 2
Industry mix (Fortune 500 HQ in SD)
| Industry | F500 HQs | Revenue |
|---|---|---|
| Utilities | 1 | $1B |
|
||
Price history
+183.8% since first listed6 events — show timeline
- 2026-01-30 Price Changed $118,900 ABOR
- 2025-12-04 Price Changed $121,900 ABOR
- 2025-11-12 Listed $131,900 ABOR
- 2022-02-25 Sold (MLS) $123,000 ABOR
- 2021-11-20 Listed $130,000 ABOR
- 2000-07-28 Sold (MLS) $41,900 ABOR
Property tax history
+2.8%/yrLatest (2025): $1,921 · +8.2% YoY. Source: county tax records.
Cash-flow waterfall
monthlySold comps — $/sqft
last 12 mo · ≤1 miLoading sold comps…