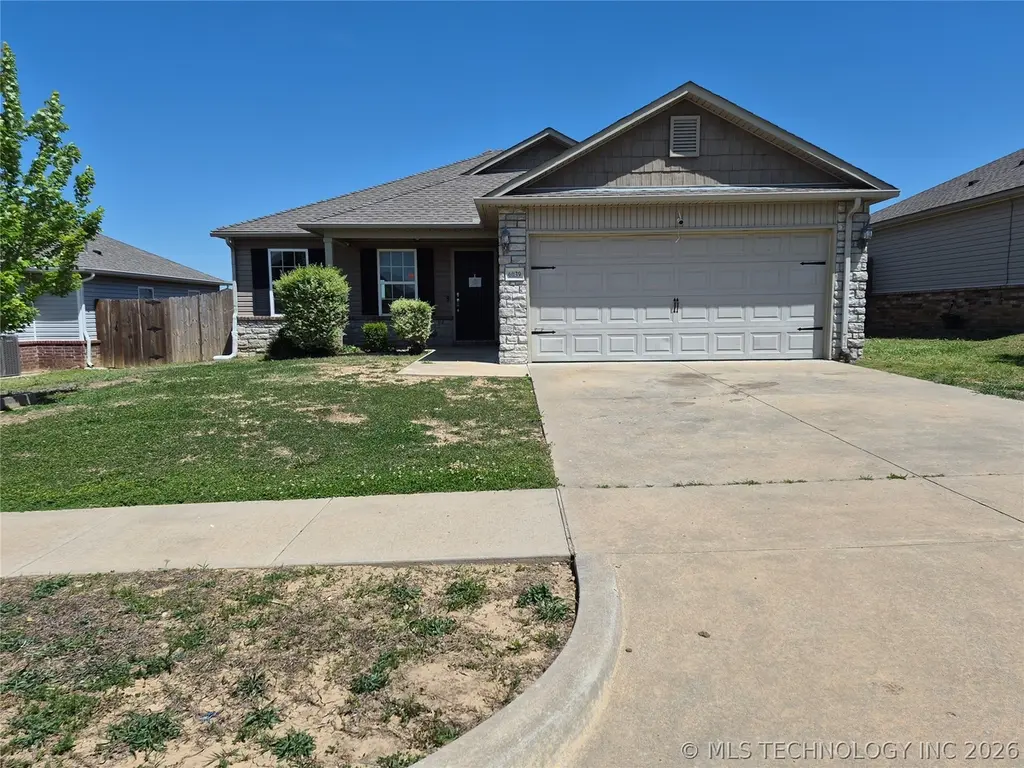
6039 E 147th Pl S · Bixby, OK
Flood risk 1/10 · Minimal
- FEMA flood zone
- X (unshaded)
- Chance of flooding over 30 yrs
- 0.0%
- Est. flood insurance / yr
- $473 – $860
Fire risk 4/10 · Minor
- Est. fire insurance / yr
- $2,463 – $4,575
Heat risk 7/10 · Major
- Hot days now (above 112°F)
- 7 days/yr
- Hot days in 30 yrs
- 18 days/yr
Wind risk 3/10 · Minor
- Chance of severe wind over 30 yrs
- 5.0%
Air-quality risk 2/10 · Minimal
- Unhealthy air days now
- 0 days/yr
- Unhealthy air days in 30 yrs
- 1 days/yr
Risk factors via First Street. Map © Google.
Why this score? — see what drove the C- grade
The composite is a weighted blend of 9 inputs, each scored 0–100. Each bar is that input's sub-score; the figure is the points it added to the 100-point composite (weight × sub-score).
- Cash flow +17.7/30.0
- ARV discount +13.0/15.0
- DSCR +5.6/10.0
- 1% rule +5.2/10.0
- Livability +3.6/5.0
- Schools +3.5/10.0
- Rent growth +3.3/5.0
- Condition / age +2.5/5.0
- Appreciation +0.0/10.0
$200,000
🖨 Deal sheet 📄 Offer letter ✓ Due diligence
Listing remarks MLS
NEW CONSTRUCTION!! Perfect floor plan in the Perfect neighborhood! Morgan Floor Plan, Will feature a breakfast bar large enough for entertaining. Should be complete by December.
Key facts
- 6,182 sq ft lot
- 2 garage spots
- Built 2017
Property features AI
Finance
- Financial info: Pets allowed
- HOA & community: Homeowners association with annual fee; Annual association fee of $259; Community amenities include a park
Exterior
- Parking: Attached garage; 2-car garage
- Security: Smoke detector(s); No safety shelter
- Utilities: Electricity available; Natural gas available; Public water; Public sewer
- Home design: Single-story home; Faces north; Slab foundation
- Construction: Built with brick, vinyl siding, and wood frame; Asphalt/fiberglass roof
- Exterior features: Covered patio and porch; Porch; Patio; Rain gutters; Privacy fencing
Interior
- Kitchen: Eat-in kitchen; Dishwasher; Oven; Range; Plumbed for ice maker; Disposal
- Bedrooms: Master bedroom with private bath and walk-in closet (First level); Additional bedrooms without baths (First level)
- Flooring: Vinyl flooring
- Bathrooms: Two full bathrooms (both on the first level); Master bath with bathtub; Hall bathroom with bathtub
- Heating & cooling: Central heating (gas) with zoned control; Central air conditioning with zoned control
- Interior features: High ceilings; High-speed internet; Laminate counters; Wired for data; Ceiling fan(s); Gas range and gas oven connections; Programmable thermostat; Insulated windows; Insulated doors; Vinyl windows
- Laundry & utility: Inside utility room (First level); Washer hookup; Electric dryer hookup
Neighborhood map
What this means for you Summary
Snapshot
- This is a 3-bed/2.0-bath single-family listed at $200k.
Deal economics
- At list price, monthly cash flow is $163 ($2k/yr) — positive.
- The deal already cash-flows at list — no discount required.
- Meets the 1% rule at list price ($2k rent vs $200k).
- Recommended offer: $194k (3.0% below list) — sets the bar for market timing.
- Cap rate 7.3% vs local median 3.6% in Bixby — top-decile yield for the area; either an underpriced asset or a hidden risk that comps aren't pricing in. Stress-test before assuming the spread holds.
Location & tenants
- Location reads 72/100 on livability (#24 in OK) — a middle-class / working-renter tenant base. Strengths: crime A+, employment A+, housing A+; Watch: amenities F, commute F, health & safety F.
- Bixby (suburban): math 39% / reading 36% proficiency, ranked #15 of 270 in OK (top 6%) — families likely to look elsewhere, expect single-tenant / working-renter base with shorter leases; only 19% free/reduced lunch — higher-income household profile.
- Market conditions: Rents rising (+3.3%/yr); 789 active listings in the ZIP; 4 comparable units currently listed for rent nearby; rentals leasing fast (median 2d on market — plan ~1-2 weeks tenant-placement turnaround); solid renter incomes; 2,818 units permitted in Tulsa County in 2024 (518 in 5+ unit buildings).
Forward outlook
- Local home prices are declining (-3.0%/yr); year-one equity from $1k of loan paydown is wiped out by about $6k of value loss. Plan a longer hold.
- Tulsa County population projected at +30% by 2050 — long-run rental-demand tailwind backs the buy-and-hold thesis.
Negotiation context
- It's been on market 43 days — a 3% lower offer ($194k) is reasonable based on typical stale-listing flexibility.
- 3 sale attempts since 10y ago; this cycle's ask has dropped $12k (6%) from the opening price — seller is motivated, your offer sets the floor, not the list.
Risks & watch-outs
- Climate carrying-cost: extreme-heat days projected 7→18/yr by 2055 (HVAC capex compounding) — expect insurance premiums to compound above CPI over the hold.
Questions for the listing agent
- It's been on market 43 days. Have you received any prior offers? Is the seller open to a 3% concession, seller financing, or rate buy-down credit?
- What does the HOA fee cover, when was the last increase, and are there any pending special assessments or reserve-fund shortfalls?
- Is there a deadline driving the sale (1031 exchange, divorce, estate, relocation)? That informs how much negotiation room exists.
- Schools are B-rated — typically a magnet for longer-tenancy family renters. What's the average tenant stay here, and is there a school-zone premium baked into asking?
- What's the average days-on-market for RENTAL listings here right now (not sales)? A rising rental-DOM trend means longer vacancies and softer asking-rent achievability than the comps imply.
- What's the recent tenant-quality profile in this submarket — average credit score on applications, eviction rate, late-payment / NSF rate, and stable-employment percentage? A property-management company in the area should have these aggregated.
- How much new for-sale + rental construction is in the pipeline within 1–3 miles? Heavy new supply typically softens prices + rents 12–24 months out; constrained supply supports both.
Investment metrics
- 1% rule
- 1.02% ✓
- Cap rate
- 7.27%
- Cash-on-cash
- 3.48%
- DSCR
- 1.16
- GRM
- 8.1
CMA / ARV
- ARV (on-the-fly)
- $227,640
- Comps found
- 12
Show comp detail 12 sales within ~0.75 mi
| Address | Dist | Beds/Ba | Sqft | Sold | Price | $/sf | Match |
|---|---|---|---|---|---|---|---|
| 6037 E 147th St S | 0.05mi | 3/2.0 | 1,370 (+1%) | 8mo | $244,900 | $179 | 89 |
| 5919 E 148th St | 0.08mi | 3/2.0 | 1,410 (+4%) | 3mo | $247,000 | $175 | 87 |
| 5976 E 147th St S | 0.04mi | 3/2.0 | 1,340 (-1%) | 11mo | $225,000 | $168 | 87 |
| 5770 E 146th Pl S | 0.15mi | 3/2.0 | 1,396 (+3%) | 2mo | $235,000 | $168 | 87 |
| 5922 E 148th Pl S | 0.14mi | 3/2.0 | 1,321 (-2%) | 11mo | $222,500 | $168 | 80 |
| 5721 E 146th St S | 0.22mi | 3/2.0 | 1,370 (+1%) | 11mo | $250,000 | $182 | 79 |
| 5756 E 148th St S | 0.16mi | 3/2.0 | 1,504 (+11%) | 1mo | $229,000 | $152 | 73 |
| 5921 E 148th Pl S | 0.12mi | 3/2.0 | 1,523 (+12%) | 2mo | $253,000 | $166 | 72 |
| 5864 E 146th St S | 0.15mi | 3/2.0 | 1,540 (+14%) | 0mo | $242,000 | $157 | 70 |
| 5736 E 148th St S | 0.17mi | 3/2.0 | 1,467 (+8%) | 10mo | $245,000 | $167 | 70 |
| 5752 E 147th St S | 0.14mi | 3/2.0 | 1,545 (+14%) | 4mo | $235,000 | $152 | 67 |
| 5741 E 146th St S | 0.21mi | 3/2.0 | 1,547 (+14%) | 2mo | $251,000 | $162 | 65 |
Match score weights: distance 35% · size 25% · config 20% · recency 20%. Top-matched comps best support the ARV.
Projected returns pro-forma
-3.0% appreciation · 3.34% rent growth · sell at horizon
- IRR
- -10.4%
- Equity multiple
- 0.62×
- Total profit
- $-21,271
- Equity at exit
- $29,821
- IRR
- -0.5%
- Equity multiple
- 0.96×
- Total profit
- $-1,968
- Equity at exit
- $17,292
Cash invested: $56,000 (down + closing). Projections, not guarantees.
Landlord ↔ Tenant lean methodology
- Overall (STATE)
- 83 Strongly Landlord-Friendly
- State Oklahoma
- 83 Strongly Landlord-Friendly · R+20
- County
- — inherits STATE
- City
- — inherits STATE
ZIP-level market 74008
- Rents YoY
- 3.3%
- Active inventory
- 789
- Price-to-rent
- 8.1×
Monthly cashflow live
- Estimated rent
- $2,050 medium interval (Pro) →
- Mortgage (P&I)
- −$1,049
- Tax from tax record
- −$303 /mo · $3,631/yr
- Insurance
- −$83
- HOA
- −$22
- Vacancy / Maint / Mgmt
- −$430
- Net cashflow
- $163
Break-even live
UW: 25.0% down · 7.5% · 30yr · 1.5% tax · 5.0% vac · 8.0% maint · 8.0% mgmt
Financing live
Cash to close
- Down payment
- $50,000
- Closing costs
- $6,000
- Reserves months
- —
- Total cash needed
- —
Loan-product check · same deal, 3 products live
Conventional
25% down · 7.5% · 30yr
- Down + closing
- —
- Monthly P&I
- —
- Monthly cashflow
- —
- DSCR
- —
- Eligible?
- —
Personal DTI + credit; lowest rate.
DSCR
20% down · 8.5% · 30yr
- Down + closing
- —
- Monthly P&I
- —
- Monthly cashflow
- —
- DSCR
- —
- Eligible?
- —
No personal income docs; deal must DSCR.
Hard money
10% down · 12.0% · 12mo
- Down + closing
- —
- Monthly P&I
- —
- Monthly cashflow
- —
- DSCR
- —
- Eligible?
- —
Short-term bridge; refi at stabilization.
Rent comps 4 comps
| Address | Beds | Baths | Sqft | Rent | $/sqft | DOM | Units | Dist |
|---|---|---|---|---|---|---|---|---|
| 5839 E 148th Pl S Bixby, OK | 3.0 | 2.0 | 1256 | $1,850 | $1.47 | 1d | 1 | 0.13mi |
| 6316 E 146th St S Bixby, OK | 4.0 | 2.0 | 1785 | $2,100 | $1.18 | 23d | 1 | 0.24mi |
| 14681 S 82nd East Ave Bixby, OK | 1.0–3.0 | 1.0–2.0 | 975 | $1,810 | $1.86 | 1d | 11 | 1.42mi |
| 7532 E 158th St S Bixby, OK | 3.0 | 2.0 | 1486 | $1,600 | $1.08 | 1d | 1 | 1.43mi |
HOA detail
- Monthly dues
- $22 · $264/yr
Listing history 19 events
-
2026-06-16statusdays on market $200,000 Pending 43 DOM
-
2026-06-15days on market $200,000 Active 42 DOM
-
2026-06-13days on market $200,000 Active 40 DOM
-
2026-06-13days on market $200,000 Active 39 DOM
-
2026-06-10days on market $200,000 Active 37 DOM
-
2026-06-09days on market $200,000 Active 36 DOM
-
2026-06-08days on market $200,000 Active 35 DOM
-
2026-06-07remarks 401-char remark
-
2026-06-07pricedays on market $200,000 Active 34 DOM
-
2026-06-03days on market $212,025 Active 30 DOM
-
2026-06-02days on market $212,025 Active 29 DOM
-
2026-06-01days on market $212,025 Active 28 DOM
-
2026-05-31days on market $212,025 Active 27 DOM
-
2026-05-04$212,025 Active
-
2024-06-28soldstatus $235,000
-
2017-02-28soldstatus $157,650 Closed 177-char remark
Show marketing remark (177 chars)
NEW CONSTRUCTION!! Perfect floor plan in the Perfect neighborhood! Morgan Floor Plan, Will feature a breakfast bar large enough for entertaining. Should be complete by December.
-
2017-01-11status Active 177-char remark
Show marketing remark (177 chars)
NEW CONSTRUCTION!! Perfect floor plan in the Perfect neighborhood! Morgan Floor Plan, Will feature a breakfast bar large enough for entertaining. Should be complete by December.
-
2016-10-19status Pending 177-char remark
Show marketing remark (177 chars)
NEW CONSTRUCTION!! Perfect floor plan in the Perfect neighborhood! Morgan Floor Plan, Will feature a breakfast bar large enough for entertaining. Should be complete by December.
-
2016-09-27$157,650 Active 177-char remark
Show marketing remark (177 chars)
NEW CONSTRUCTION!! Perfect floor plan in the Perfect neighborhood! Morgan Floor Plan, Will feature a breakfast bar large enough for entertaining. Should be complete by December.
ⓘ Source: listings_history table (triggers on properties + properties_extension) + one-shot
backfill from property_details.listing_events for pre-trigger history.
Tax reassessment forecast OK · Resets to sale price
- Current annual tax
- $3,631 · $303/mo
- Projected year-2 tax
- $3,631 · $303/mo
- Expected delta
- $0/yr ($0/mo · 0.0%)
ⓘ Screening estimate from a state-policy table — verify with the county assessor before closing.
Climate risk First Street
- Flood 1/10 Low FEMA zone X (unshaded) · 0% chance over 30 yrs
- Wildfire 4/10 Moderate
- Heat 7/10 Severe 7 d/yr ≥112°F today · 18 d/yr by 30 yrs out
- Wind 3/10 Moderate 5% chance of damaging wind over 30 yrs
- Air quality 2/10 Low 0 unhealthy d/yr today · 1 by 30 yrs out
Nearby sold comps map
Loading sold comps map…
Walkable amenities ~0.75 mi
Loading nearby amenities…
Taxation est. · year 1
- Rental income
- $24,598
- − Mortgage interest
- −$11,203
- − Property taxes
- −$3,631
- − Insurance
- −$1,000
- − Repairs & maintenance
- −$1,968
- − Management
- −$1,968
- − HOA
- −$264
- − Depreciation
- −$5,818
- Taxable loss
- −$1,254
- Est. tax savings @ 24.0%
- +$301
- After-tax cash flow
- $2,252/yr
For passive investors: Depreciation is non-cash, so a rental often shows a tax loss while cash-flowing — sheltering income. Rental losses are passive: they offset passive income freely, and up to $25,000/yr can offset ordinary (W-2) income if you actively participate and your MAGI is under $100k (phasing out to $0 by $150k); unused losses carry forward. On sale, claimed depreciation is recaptured at up to 25%, and gains may owe capital-gains tax (a 1031 exchange can defer both). Figures are a year-1 estimate at your 24.0% rate — not tax advice; consult a CPA.
Schools (NCES district)
- District
- Bixby
- NCES district ID
- 4004500
- Math proficiency
- 39% ▼ -13.00%
- Reading proficiency
- 36% ▼ -14.00%
- Median HH income
- $75,727
- Composite
- 34.9/100
- National rank
- #5081
- State rank
- #15 of 270 in OK
Livability — Bixby
- Score
- 72/100
- State rank
- #24
- US rank
- #6029
Category grades
Schools grade is shown separately in the Schools card above.
Census & demographics
- Census place
- Bixby, OK
- County
- Tulsa County · 640,811 people
- City population
- 34,006
- Metro
- Tulsa, OK
- Population (ZIP)
- 34,006
- Household income
- $104,000
- Rent vs Own
- Severe rent burden
- 525.0
Population outlook (Tulsa County) Hauer SSP2
- Today (2025)
- 723,846 people
- By 2030
- 766,033 · +5.8%
- By 2040
- 851,386 · +17.6%
- By 2050
- 938,389 · +29.6%
- By 2075
- 1,166,011 · +61.1%
- By 2100
- 1,350,277 · +86.5%
Race, ethnicity, and origin ACS 2023
- Neighborhood character
- Predominantly White (73%)
- Race & ethnicity
- White 73% Two or more races 15% Hispanic / Latino 9% Native American 5% Asian 2% Black 2%
- Hispanic origin (detail)
- Mexican 5%
- Common ancestry
- Italian 4% Slovak 2% Lithuanian 2%
- Foreign-born
- 5% · Canada
- Languages at home
- 92% English-only · Spanish 5% Other Indo-European 1%
Political lean MEDSL · Tulsa
- 2024 margin
- R (+15.2) · D 41.3% · R 56.5% · Other 2.2%
- 2008→2024 swing
- +9.2pp toward D · 2008: -24.5pp · 2024: -15.2pp
- All cycles
- 2024: R+15.2 2020: R+15.6 2016: R+22.9 2012: R+27.4 2008: R+24.5
Not yet ingested
- Civics
- —
Market trends
- HPI YoY
- ▼ -127.20%
- Current HPI
- 195.2538
- Rent YoY
- ▲ 3.34%
- Metro
- Tulsa, OK
- State GDP YoY
- ▲ 1.55%
- F500 in state
- 6
Industry mix (Fortune 500 HQ in OK)
| Industry | F500 HQs | Revenue |
|---|---|---|
| Energy | 3 | $48B |
|
||
Price history
+34.5% since first listed6 events — show timeline
- 2026-05-04 Listed $212,025 MLS Technology, Inc.
- 2024-06-28 Sold (Public Records) $235,000 Public Records
- 2017-02-28 Sold (MLS) $157,650 MLS Technology, Inc.
- 2017-01-11 Relisted — MLS Technology, Inc.
- 2016-10-19 Pending — MLS Technology, Inc.
- 2016-09-27 Listed $157,650 MLS Technology, Inc.
Property tax history
+15.8%/yrLatest (2025): $3,631 · +48.2% YoY. Source: county tax records.
Cash-flow waterfall
monthlySold comps — $/sqft
last 12 mo · ≤1 miLoading sold comps…