1525 Serpentine Dr · Jacinto City, TX
Flood risk 5/10 · Moderate
- FEMA flood zone
- X (shaded)
- Chance of flooding over 30 yrs
- 0.24%
- Est. flood insurance / yr
- $507 – $1,088
Fire risk 3/10 · Minor
- Est. fire insurance / yr
- $1,222 – $2,270
Heat risk 9/10 · Severe
- Hot days now (above 109°F)
- 7 days/yr
- Hot days in 30 yrs
- 24 days/yr
Wind risk 9/10 · Severe
- Chance of severe wind over 30 yrs
- 99.0%
Air-quality risk 2/10 · Minimal
- Unhealthy air days now
- 2 days/yr
- Unhealthy air days in 30 yrs
- 2 days/yr
Risk factors via First Street. Map © Google.
Why this score? — see what drove the B- grade
The composite is a weighted blend of 9 inputs, each scored 0–100. Each bar is that input's sub-score; the figure is the points it added to the 100-point composite (weight × sub-score).
- Cash flow +17.3/30.0
- ARV discount +15.0/15.0
- Appreciation +10.0/10.0
- 1% rule +6.2/10.0
- DSCR +5.4/10.0
- Livability +3.5/5.0
- Schools +2.8/10.0
- Rent growth +2.5/5.0
- Condition / age +2.5/5.0
$145,000
🖨 Deal sheet 📄 Offer letter ✓ Due diligence
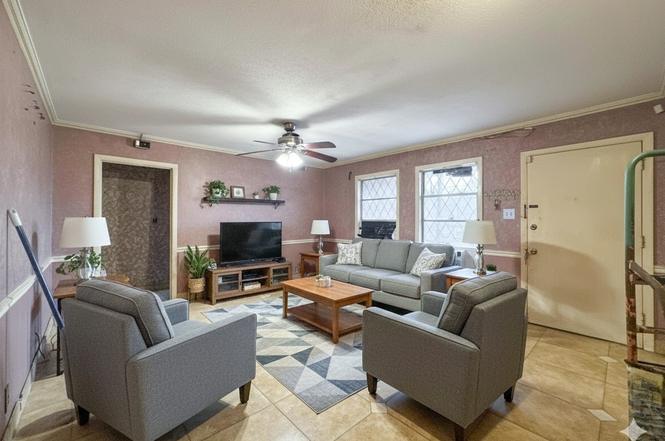
Listing remarks
UNLOCK THE POTENTIAL AND MAKE IT YOUR OWN! This for-sale opportunity is all about space, possibilities, and value, highlighted by a generously sized backyard that offers endless room for expansion, outdoor living, or future enhancements. The home presents a solid canvas for buyers with vision—ready for updates that allow you to personalize and add instant equity. Being sold as is, it’s an ideal option for investors, renovators, or homeowners looking to create a space tailored to their style. Set in an established Houston area with convenient access to everyday essentials, this property combines location, lot size, and opportunity in one compelling package. If you’re search
Key facts
- Convenient access
- 7,183 sq ft lot
- Garage
Tags
Neighborhood map
What this means for you Summary
Snapshot
- This is a 4-bed/1.5-bath single-family listed at $145k.
Deal economics
- At list price, monthly cash flow is $105 ($1k/yr) — positive.
- The deal already cash-flows at list — no discount required.
- Meets the 1% rule at list price ($2k rent vs $145k).
- Recommended offer: $132k (9.0% below list) — sets the bar for market timing.
Location & tenants
- Location reads 70/100 on livability (#384 in TX) — a middle-class / working-renter tenant base. Strengths: cost of living A+, housing A+, health & safety A-; Watch: amenities F, commute F, employment F.
- Galena Park ISD (suburban): math 32% / reading 33% proficiency, ranked #578 of 826 in TX (top 70%) — families likely to look elsewhere, expect single-tenant / working-renter base with shorter leases; 74% free/reduced lunch — lower-income household profile, screen leases tightly.
- Zoned schools: Woodland Acres Middle (math 35% / reading 34%, grade F, #858 of 1,662 statewide, top 54%, 603 students, 85% FRL); Galena Park H S (math 37% / reading 36%, grade F, #924 of 1,632 statewide, top 57%, 1,914 students, 87% FRL).
- Market conditions: 153 active listings in the ZIP; 4 comparable units currently listed for rent nearby; rentals at typical pace (median 19d on market — plan ~3-4 weeks tenant-placement turnaround); 29,883 units permitted in Harris County in 2024 (8,621 in 5+ unit buildings).
Forward outlook
- In year one you build about $16k of equity ($1k loan paydown + $14k appreciation (10.0% local appreciation)).
- Harris County population projected at +47% by 2050 — long-run rental-demand tailwind backs the buy-and-hold thesis.
- At projected returns (10.0% appreciation + 3.0% rent growth), your $41k cash investment doubles in ~3 years — after that, you're playing with house money.
- By year 3, paydown + projected appreciation supports a ~$39k cash-out refi (75% LTV) — recoverable capital for the next deal without selling this one.
Negotiation context
- It's been on market 105 days — a 9% lower offer ($132k) is reasonable based on typical stale-listing flexibility.
- 3 sale attempts with the ask held roughly flat each time — persistent listings suggest the price (not the market) is what's stuck; bring a comps-based counter.
- Current owner paid $52k; list at $145k implies a 176% gain — meaningful room to come down on a strong offer.
Risks & watch-outs
- Watch-outs: property tax is 3.0% of price; built in 1955 — expect roof / HVAC / electrical / plumbing capex.
- Climate carrying-cost: moderate flood risk; severe wind risk, 99% chance of damaging wind over 30y; extreme-heat days projected 7→24/yr by 2055 (HVAC capex compounding) — expect insurance premiums to compound above CPI over the hold.
Questions for the listing agent
- It's been on market 105 days. Have you received any prior offers? Is the seller open to a 9% concession, seller financing, or rate buy-down credit?
- Built in 1955 — when were the roof, HVAC, electrical panel, plumbing, and water heater last replaced?
- Property tax is high relative to price — has the assessment been appealed recently, and will the sale trigger a re-assessment?
- Why hasn't it sold? Are there any deal-killer items the seller is aware of (foundation, flood, title, zoning, code violations)?
- Is there a deadline driving the sale (1031 exchange, divorce, estate, relocation)? That informs how much negotiation room exists.
- Schools are F-rated, which usually means shorter tenancies and higher turnover. Who's the typical renter profile here, and what's been the actual vacancy rate?
- What's the average days-on-market for RENTAL listings here right now (not sales)? A rising rental-DOM trend means longer vacancies and softer asking-rent achievability than the comps imply.
- What's the recent tenant-quality profile in this submarket — average credit score on applications, eviction rate, late-payment / NSF rate, and stable-employment percentage? A property-management company in the area should have these aggregated.
- How much new for-sale + rental construction is in the pipeline within 1–3 miles? Heavy new supply typically softens prices + rents 12–24 months out; constrained supply supports both.
Investment metrics
- 1% rule
- 1.12% ✓
- Cap rate
- 7.16%
- Cash-on-cash
- 3.11%
- DSCR
- 1.14
- GRM
- 7.4
CMA / ARV
- ARV (on-the-fly)
- $183,890
- Comps found
- 12
Show comp detail 12 sales within ~0.75 mi
| Address | Dist | Beds/Ba | Sqft | Sold | Price | $/sf | Match |
|---|---|---|---|---|---|---|---|
| 11518 Munn St | 0.12mi | 3/1.0 (-1) | 1,288 (-0%) | 7mo | $205,000 | $159 | 80 |
| 11514 Oglesby St | 0.25mi | 3/1.0 (-1) | 1,234 (-5%) | 1mo | $199,000 | $161 | 73 |
| 11510 Tilia St | 0.16mi | 3/1.0 (-1) | 1,404 (+8%) | 7mo | $90,000 | $64 | 66 |
| 12358 Mylla St | 0.48mi | 4/2.0 | 1,234 (-5%) | 3mo | $199,000 | $161 | 66 |
| 12170 Coulson Cir | 0.27mi | 4/1.5 | 1,425 (+10%) | 10mo | $194,900 | $137 | 62 |
| 1615 Hiller St | 0.46mi | 3/2.0 (-1) | 1,407 (+9%) | 1mo | $185,000 | $131 | 56 |
| 11020 Munn St | 0.54mi | 3/1.5 (-1) | 1,373 (+6%) | 5mo | $310,000 | $226 | 55 |
| 12153 Coulson Cir | 0.32mi | 3/1.0 (-1) | 1,164 (-10%) | 8mo | $165,000 | $142 | 55 |
| 1647 Watkin Way | 0.70mi | 3/3.0 (-1) | 1,274 (-2%) | 3mo | $178,800 | $140 | 51 |
| 1622 Jennifer Ln | 0.28mi | 3/1.0 (-1) | 1,121 (-13%) | 8mo | $163,000 | $145 | 50 |
| 12457 Parkey Ln | 0.74mi | 3/1.0 (-1) | 1,121 (-13%) | 5mo | $135,000 | $120 | 32 |
| 12466 Birdie Ln | 0.74mi | 3/2.0 (-1) | 1,466 (+13%) | 10mo | $155,000 | $106 | 28 |
Match score weights: distance 35% · size 25% · config 20% · recency 20%. Top-matched comps best support the ARV.
Projected returns pro-forma
10.0% appreciation · 3.0% rent growth · sell at horizon
- IRR
- 26.6%
- Equity multiple
- 3.11×
- Total profit
- $85,799
- Equity at exit
- $130,627
- IRR
- 23.3%
- Equity multiple
- 7.10×
- Total profit
- $247,662
- Equity at exit
- $281,703
Cash invested: $40,600 (down + closing). Projections, not guarantees.
Landlord ↔ Tenant lean methodology
- Overall (STATE)
- 87 Strongly Landlord-Friendly
- State Texas
- 87 Strongly Landlord-Friendly · R+5
- County
- — inherits STATE
- City
- — inherits STATE
ZIP-level market 77029
- Home prices YoY
- 7.2%
- Active inventory
- 153
- Price-to-rent
- 7.4×
Monthly cashflow live
- Estimated rent
- $1,624 medium interval (Pro) →
- Mortgage (P&I)
- −$760
- Tax from tax record
- −$357 /mo · $4,283/yr
- Insurance
- −$60
- HOA
- −$0
- Vacancy / Maint / Mgmt
- −$341
- Net cashflow
- $105
Break-even live
UW: 25.0% down · 7.5% · 30yr · 1.5% tax · 5.0% vac · 8.0% maint · 8.0% mgmt
Financing live
Cash to close
- Down payment
- $36,250
- Closing costs
- $4,350
- Reserves months
- —
- Total cash needed
- —
Loan-product check · same deal, 3 products live
Conventional
25% down · 7.5% · 30yr
- Down + closing
- —
- Monthly P&I
- —
- Monthly cashflow
- —
- DSCR
- —
- Eligible?
- —
Personal DTI + credit; lowest rate.
DSCR
20% down · 8.5% · 30yr
- Down + closing
- —
- Monthly P&I
- —
- Monthly cashflow
- —
- DSCR
- —
- Eligible?
- —
No personal income docs; deal must DSCR.
Hard money
10% down · 12.0% · 12mo
- Down + closing
- —
- Monthly P&I
- —
- Monthly cashflow
- —
- DSCR
- —
- Eligible?
- —
Short-term bridge; refi at stabilization.
Rent comps 4 comps
| Address | Beds | Baths | Sqft | Rent | $/sqft | DOM | Units | Dist |
|---|---|---|---|---|---|---|---|---|
| 12200 Fleming Dr Houston, TX | 1.0–3.0 | 1.0–2.0 | 842 | $1,265 | $1.50 | 1d | 25 | 0.72mi |
| 12221 Fleming Dr Houston, TX | 1.0–3.0 | 1.0–1.5 | 827 | $1,089 | $1.32 | 18d | 19 | 0.95mi |
| 670 Maxey Rd Houston, TX | 1.0–3.0 | 1.0–2.0 | 936 | $1,380 | $1.47 | 7d | 15 | 1.04mi |
| 518 Westshire Dr Houston, TX | 3.0 | 2.0 | 1696 | $2,000 | $1.18 | 43d | 1 | 1.44mi |
Listing history 11 events
-
2026-04-26status Pending
-
2026-04-20status Pending
-
2026-03-10status Active
-
2026-03-07status Pending
-
2026-02-24status Pending
-
2026-02-13status Active
-
2026-02-13status Pending
-
2026-02-13price $145,000
-
2026-01-06$150,000 Active
-
1998-06-26soldstatus
-
1998-06-01soldstatus $52,500
ⓘ Source: listings_history table (triggers on properties + properties_extension) + one-shot
backfill from property_details.listing_events for pre-trigger history.
Tax reassessment forecast TX · Resets to sale price
- Current annual tax
- $4,283 · $357/mo
- Projected year-2 tax
- $4,283 · $357/mo
- Expected delta
- $0/yr ($0/mo · 0.0%)
ⓘ Screening estimate from a state-policy table — verify with the county assessor before closing.
Climate risk First Street
- Flood 5/10 Major FEMA zone X (shaded) · 24% chance over 30 yrs
- Wildfire 3/10 Moderate
- Heat 9/10 Extreme 7 d/yr ≥109°F today · 24 d/yr by 30 yrs out
- Wind 9/10 Extreme 99% chance of damaging wind over 30 yrs
- Air quality 2/10 Low 2 unhealthy d/yr today · 2 by 30 yrs out
Nearby sold comps map
Loading sold comps map…
Walkable amenities ~0.75 mi
Loading nearby amenities…
Taxation est. · year 1
- Rental income
- $19,486
- − Mortgage interest
- −$8,122
- − Property taxes
- −$4,283
- − Insurance
- −$725
- − Repairs & maintenance
- −$1,559
- − Management
- −$1,559
- − Depreciation
- −$4,218
- Taxable loss
- −$980
- Est. tax savings @ 24.0%
- +$235
- After-tax cash flow
- $1,497/yr
For passive investors: Depreciation is non-cash, so a rental often shows a tax loss while cash-flowing — sheltering income. Rental losses are passive: they offset passive income freely, and up to $25,000/yr can offset ordinary (W-2) income if you actively participate and your MAGI is under $100k (phasing out to $0 by $150k); unused losses carry forward. On sale, claimed depreciation is recaptured at up to 25%, and gains may owe capital-gains tax (a 1031 exchange can defer both). Figures are a year-1 estimate at your 24.0% rate — not tax advice; consult a CPA.
Schools (NCES district)
- District
- Galena Park ISD
- NCES district ID
- 4820250
- Math proficiency
- 32% ▼ -20.00%
- Reading proficiency
- 33% ▼ -7.00%
- Median HH income
- $43,158
- Composite
- 27.62/100
- National rank
- #6927
- State rank
- #578 of 826 in TX
Livability — Jacinto City
- Score
- 70/100
- State rank
- #384
- US rank
- #8027
Category grades
Schools grade is shown separately in the Schools card above.
Census & demographics
- Census place
- Jacinto City, TX
- County
- Harris County · 4,702,590 people
- City population
- 16,154
- Metro
- Houston-The Woodlands-Sugar Land, TX
- Population (ZIP)
- 16,154
- Household income
- $48,279
- Rent vs Own
- Severe rent burden
- 457.0
Population outlook (Harris County) Hauer SSP2
- Today (2025)
- 5,571,493 people
- By 2030
- 6,089,821 · +9.3%
- By 2040
- 7,142,806 · +28.2%
- By 2050
- 8,185,864 · +46.9%
- By 2075
- 10,574,329 · +89.8%
- By 2100
- 12,109,958 · +117.4%
Race, ethnicity, and origin ACS 2023
- Neighborhood character
- Predominantly Hispanic (72%)
- Race & ethnicity
- Hispanic / Latino 72% Two or more races 32% Black 22% White 5%
- Hispanic origin (detail)
- Mexican 66%
- Foreign-born
- 31% · Canada
- Languages at home
- 39% English-only · Spanish 61%
Political lean MEDSL · Harris
- 2024 margin
- Lean D (+5.5) · D 52.0% · R 46.4% · Other 1.6%
- 2008→2024 swing
- +3.9pp toward D · 2008: 1.6pp · 2024: 5.5pp
- All cycles
- 2024: D+5.5 2020: D+13.3 2016: D+12.4 2012: D+0.1 2008: D+1.6
Not yet ingested
- Civics
- —
Market trends
- HPI YoY
- ▲ 18.53%
- Current HPI
- 276.1811
- Rent YoY
- —
- Metro
- Houston-The Woodlands-Sugar Land, TX
- State GDP YoY
- ▲ 3.95%
- F500 in state
- 110
Industry mix (Fortune 500 HQ in TX)
| Industry | F500 HQs | Revenue |
|---|---|---|
| Energy | 16 | $1,198B |
|
||
| Technology | 5 | $198B |
|
||
| Engineering / Construction | 4 | $72B |
|
||
| Energy Services | 3 | $60B |
|
||
| Utilities | 3 | $41B |
|
||
| Healthcare | 2 | $330B |
|
||
Price history
+176.2% since first listed11 events — show timeline
- 2026-04-26 Pending — HARMLS
- 2026-04-20 Pending — HARMLS
- 2026-03-10 Relisted — HARMLS
- 2026-03-07 Pending — HARMLS
- 2026-02-24 Pending — HARMLS
- 2026-02-13 Relisted — HARMLS
- 2026-02-13 Pending — HARMLS
- 2026-02-13 Price Changed $145,000 HARMLS
- 2026-01-06 Listed $150,000 HARMLS
- 1998-06-26 Sold (Public Records) — Public Records
- 1998-06-01 Sold (Public Records) $52,500 Public Records
Property tax history
+3.1%/yrLatest (2025): $4,283 · +14.2% YoY. Source: county tax records.
Cash-flow waterfall
monthlySold comps — $/sqft
last 12 mo · ≤1 miLoading sold comps…