209 Marisma Way · Cathedral City, CA
Flood risk 1/10 · Minimal
- FEMA flood zone
- X
- Chance of flooding over 30 yrs
- 0.0%
- Est. flood insurance / yr
- $507 – $1,088
Fire risk 4/10 · Minor
- Est. fire insurance / yr
- $659 – $1,223
Heat risk 9/10 · Severe
- Hot days now (above 113°F)
- 7 days/yr
- Hot days in 30 yrs
- 20 days/yr
Wind risk 1/10 · Minimal
- Chance of severe wind over 30 yrs
- —
Air-quality risk 5/10 · Moderate
- Unhealthy air days now
- 6 days/yr
- Unhealthy air days in 30 yrs
- 8 days/yr
Risk factors via First Street. Map © Google.
Why this score? — see what drove the C+ grade
The composite is a weighted blend of 9 inputs, each scored 0–100. Each bar is that input's sub-score; the figure is the points it added to the 100-point composite (weight × sub-score).
- Cash flow +30.0/30.0
- 1% rule +10.0/10.0
- DSCR +10.0/10.0
- Rent growth +3.3/5.0
- Livability +3.3/5.0
- Schools +2.7/10.0
- Condition / age +2.5/5.0
- ARV discount +0.0/15.0
- Appreciation +0.0/10.0
$125,000
🖨 Deal sheet (PDF) 📄 Offer letter ✓ Due diligence
Listing remarks
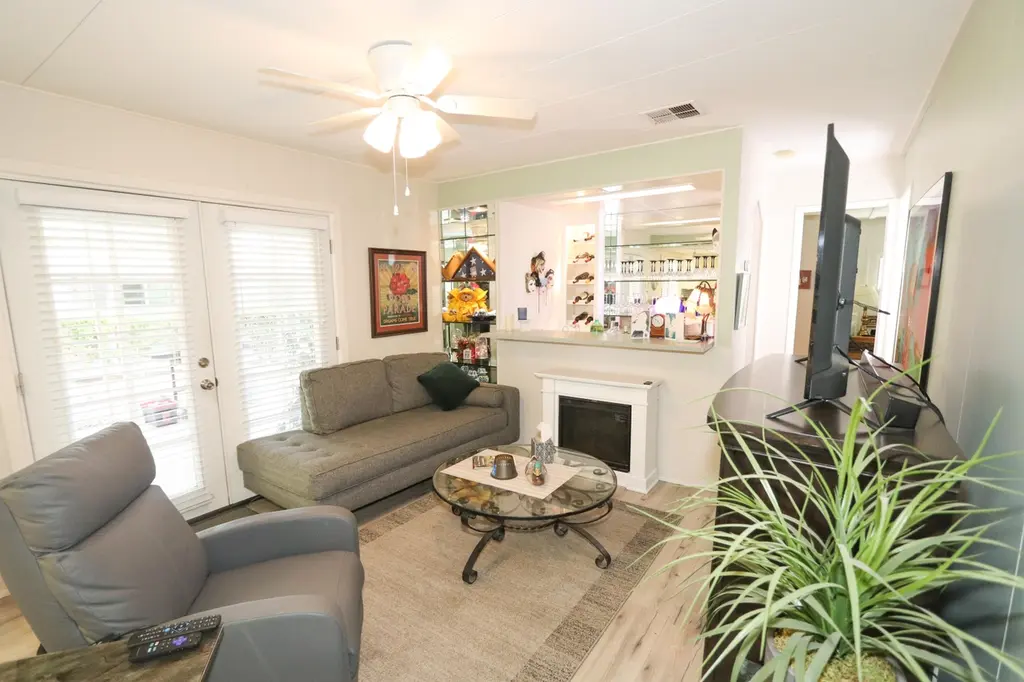
Welcome to your oasis at Date Palm Country Club! This meticulously maintained home offers the best value in the area and is priced to sell. Enjoy the serene ambiance of this golf club community, boasting a guarded entry, tranquil lakes, charming ponds, and delightful ducks. Step onto the wrap-around patio of this elevated lot and feel the cool breeze from the course gently brushing against your skin. Mature trees provide natural shade, creating the perfect spot to relax and unwind. The open circular patio exudes a mid-century charm, complemented by modern upgrades such as dual pane windows, new roof glazing, and a custom backsplash. Inside, the kitchen delights with its upgraded features in
Key facts
- Guarded entry
- Wrap-around patio
- Charming ponds
Tags
Property features AI
Finance
- Other: CC&R disclosures and HOA-related disclosures present; Short-term rentals not allowed; Will not consider lease
- Financial info: Land is leasehold with annual land lease amount of $15,540
- HOA & community: HOA dues collected annually; Association fee approximately $10 (frequency: annually); Additional monthly association fee listed as $1; Community amenities include clubhouse, pet rules, golf course, and other courts; Senior community
Exterior
- Parking: 4 total parking spaces; 2 covered spaces; 2 carport spaces; Covered parking
- Security: Gated community
- Utilities: Sewer connected and paid; PUD: No
- Home design: Detached property; One level; Double wide mobile home; Year built per assessor
- Construction: Gunite pool construction
- Exterior features: Street lights; Community pool and spa (gunite construction); Has views of the golf course and mountains; Security features (other)
Interior
- Flooring: Mixed flooring
- Bathrooms: 2 full bathrooms
- Heating & cooling: Central heating; Central air conditioning
- Interior features: Unfurnished; Family room; Living room; No fireplace
Neighborhood map
What this means for you Summary
Snapshot
- This is a 2-bed/2.0-bath manufactured listed at $125k.
Deal economics
- At list price, monthly cash flow is $1k ($17k/yr) — positive.
- The deal already cash-flows at list — no discount required.
- Meets the 1% rule at list price ($3k rent vs $125k).
- Recommended offer: $123k (1.5% below list) — sets the bar for market timing.
- Cap rate 19.7% vs local median 5.1% in Cathedral City — top-decile yield for the area; either an underpriced asset or a hidden risk that comps aren't pricing in. Stress-test before assuming the spread holds.
Location & tenants
- Location reads 66/100 on livability (#344 in CA) — a middle-class / working-renter tenant base. Strengths: commute A+, housing B+; Watch: employment D+, schools F, amenities D-.
- Palm Springs Unified (suburban): math 21% / reading 42% proficiency, ranked #328 of 517 in CA (top 63%) — families likely to look elsewhere, expect single-tenant / working-renter base with shorter leases; 73% free/reduced lunch — lower-income household profile, screen leases tightly.
- Market conditions: Rents rising (+3.2%/yr); 530 active listings in the ZIP; 40 comparable units currently listed for rent nearby; rentals at typical pace (median 25d on market — plan ~3-4 weeks tenant-placement turnaround); 48% of comp listings sitting > 30 days — soft ceiling on asking rent; 9,195 units permitted in Riverside County in 2024 (1,512 in 5+ unit buildings).
- This rent runs 44% of the median local income ($74k/yr) — at the standard rent-burdened threshold; future hikes will face affordability resistance.
Forward outlook
- Local home prices are declining (-3.0%/yr); year-one equity from $864 of loan paydown is wiped out by about $4k of value loss. Plan a longer hold.
- Riverside County population projected at +22% by 2050 — long-run rental-demand tailwind backs the buy-and-hold thesis.
- At projected returns (-3.0% appreciation + 3.2% rent growth), your $35k cash investment doubles in ~3 years — after that, you're playing with house money.
Negotiation context
- It's been on market 17 days — a 2% lower offer ($123k) is reasonable based on typical stale-listing flexibility.
- 12 sale attempts since 6y ago; this cycle's ask is 5852% above the opening price — seller raised mid-cycle; expect resistance to lowballs.
- Current owner paid $57k; list at $125k implies a 119% gain — meaningful room to come down on a strong offer.
Risks & watch-outs
- Climate carrying-cost: extreme-heat days projected 7→20/yr by 2055 (HVAC capex compounding) — expect insurance premiums to compound above CPI over the hold.
Questions for the listing agent
- Built in 1971 — when were the roof, HVAC, electrical panel, plumbing, and water heater last replaced?
- What does the HOA fee cover, when was the last increase, and are there any pending special assessments or reserve-fund shortfalls?
- Is there a deadline driving the sale (1031 exchange, divorce, estate, relocation)? That informs how much negotiation room exists.
- Schools are F-rated, which usually means shorter tenancies and higher turnover. Who's the typical renter profile here, and what's been the actual vacancy rate?
- What's the average days-on-market for RENTAL listings here right now (not sales)? A rising rental-DOM trend means longer vacancies and softer asking-rent achievability than the comps imply.
- What's the recent tenant-quality profile in this submarket — average credit score on applications, eviction rate, late-payment / NSF rate, and stable-employment percentage? A property-management company in the area should have these aggregated.
- How much new for-sale + rental construction is in the pipeline within 1–3 miles? Heavy new supply typically softens prices + rents 12–24 months out; constrained supply supports both.
Investment metrics
- 1% rule
- 2.17% ✓
- Cap rate
- 19.70%
- Cash-on-cash
- 47.89%
- DSCR
- 3.13
- GRM
- 3.8
CMA / ARV
- ARV (median comp)
- $87,000
- List price
- $125,000
- Delta
- 43.68%
- Verdict
- OVERPRICED
- Comps
- 20 within 1.0 mi
Show comp detail 12 sales within ~0.75 mi
| Address | Dist | Beds/Ba | Sqft | Sold | Price | $/sf | Match |
|---|---|---|---|---|---|---|---|
| 229 Calle Leandro | 0.02mi | 2/2.0 | 1,440 (0%) | 3mo | $90,000 | $63 | 97 |
| 67 Paseo Laredo North | 0.17mi | 2/2.0 | 1,440 (0%) | 1mo | $55,000 | $38 | 91 |
| 153 Estrada Way | 0.24mi | 2/2.0 | 1,440 (0%) | 1mo | $46,500 | $32 | 88 |
| 126 Via Valverde | 0.23mi | 2/2.0 | 1,440 (0%) | 2mo | $179,500 | $125 | 87 |
| 35 N Paseo Laredo | 0.23mi | 2/2.0 | 1,440 (0%) | 4mo | $157,000 | $109 | 86 |
| 12 Via Valverde | 0.29mi | 3/2.0 (+1) | 1,440 (0%) | 5mo | $120,000 | $83 | 78 |
| 443 Paseo Perdido | 0.56mi | 2/2.0 | 1,440 (0%) | 0mo | $65,000 | $45 | 73 |
| 464 Cerritos Way | 0.56mi | 2/2.0 | 1,440 (0%) | 2mo | $95,000 | $66 | 72 |
| 409 S Paseo Laredo | 0.57mi | 2/2.0 | 1,440 (0%) | 2mo | $58,000 | $40 | 72 |
| 447 Paseo Perdido | 0.58mi | 2/2.0 | 1,590 (+10%) | 1mo | $55,000 | $35 | 55 |
| 337 Via Don Benito | 0.65mi | 2/2.0 | 1,608 (+12%) | 0mo | $77,000 | $48 | 50 |
| 379 Avenida Andorra | 0.70mi | 2/2.0 | 1,640 (+14%) | 6mo | $120,000 | $73 | 39 |
Match score weights: distance 35% · size 25% · config 20% · recency 20%. Top-matched comps best support the ARV.
Projected returns pro-forma
-3.0% appreciation · 3.22% rent growth · sell at horizon
- IRR
- 45.6%
- Equity multiple
- 2.98×
- Total profit
- $69,270
- Equity at exit
- $18,638
- IRR
- 51.5%
- Equity multiple
- 6.06×
- Total profit
- $177,208
- Equity at exit
- $10,808
Cash invested: $35,000 (down + closing). Projections, not guarantees.
Landlord ↔ Tenant lean methodology
- Overall (STATE)
- 18 Strongly Tenant-Friendly
- State California
- 18 Strongly Tenant-Friendly · D+13
- County
- — inherits STATE
- City
- — inherits STATE
ZIP-level market 92234
- Home prices YoY
- -27.7%
- Rents YoY
- 3.2%
- Active inventory
- 530
- Price-to-rent
- 3.8×
Monthly cashflow live
- Estimated rent
- $2,709 high interval (Pro) →
- Mortgage (P&I)
- −$656
- Tax from tax record
- −$35 /mo · $418/yr
- Insurance
- −$52
- HOA
- −$1
- Vacancy / Maint / Mgmt
- −$569
- Net cashflow
- $1,397
Break-even live
Sensitivity live
| Price | -10% $1,467 | -5% $1,432 | +0% $1,397 | +5% $1,361 | +10% $1,326 |
|---|---|---|---|---|---|
| Rent | -10% $1,183 | -5% $1,290 | +0% $1,397 | +5% $1,504 | +10% $1,611 |
| Rate | -1.0pp $1,460 | -0.5pp $1,429 | base $1,397 | +0.5pp $1,364 | +1.0pp $1,331 |
UW: 25.0% down · 7.5% · 30yr · 1.5% tax · 5.0% vac · 8.0% maint · 8.0% mgmt
Financing live
Cash to close
- Down payment
- $31,250
- Closing costs
- $3,750
- Reserves months
- —
- Total cash needed
- —
Loan-product check · same deal, 3 products live
Conventional
25% down · 7.5% · 30yr
- Down + closing
- —
- Monthly P&I
- —
- Monthly cashflow
- —
- DSCR
- —
- Eligible?
- —
Personal DTI + credit; lowest rate.
DSCR
20% down · 8.5% · 30yr
- Down + closing
- —
- Monthly P&I
- —
- Monthly cashflow
- —
- DSCR
- —
- Eligible?
- —
No personal income docs; deal must DSCR.
Hard money
10% down · 12.0% · 12mo
- Down + closing
- —
- Monthly P&I
- —
- Monthly cashflow
- —
- DSCR
- —
- Eligible?
- —
Short-term bridge; refi at stabilization.
Rent comps 40 comps
| Address | Beds | Baths | Sqft | Rent | $/sqft | DOM | Units | Dist |
|---|---|---|---|---|---|---|---|---|
| 159 Estrada Way Cathedral City, CA | 3.0 | 2.0 | 1800 | $2,850 | $1.58 | 44d | 1 | 0.20mi |
| 152 Estrada Way #152 Cathedral City, CA | 2.0 | 2.0 | 1500 | $2,200 | $1.47 | 44d | 1 | 0.22mi |
| 36040 Avenida de las Montanas Unit E Cathedral City, CA | 2.0 | 2.0 | 1220 | $3,200 | $2.62 | 44d | 1 | 0.35mi |
| 250 S Paseo Laredo Cathedral City, CA | 2.0 | 2.0 | 1600 | $1,800 | $1.12 | 13d | 1 | 0.38mi |
| 251 S Paseo Laredo Unit 251 Cathedral City, CA | 1.0 | 2.0 | 1440 | $2,550 | $1.77 | 25d | 1 | 0.39mi |
| 251 S Paseo Laredo Cathedral City, CA | 2.0 | 2.0 | 1440 | $2,400 | $1.67 | 44d | 1 | 0.39mi |
| 35615 Paseo Circulo E Cathedral City, CA | 1.0 | 2.0 | 1029 | $2,250 | $2.19 | 44d | 1 | 0.51mi |
| 68882 Calle Mula Cathedral City, CA | 2.0 | 2.0 | 1714 | $2,500 | $1.46 | 21d | 1 | 0.53mi |
| 69200 Nilda Dr Cathedral City, CA | 3.0 | 2.0 | 1330 | $2,495 | $1.88 | 22d | 1 | 0.69mi |
| 68859 Paseo Real Cathedral City, CA | 2.0 | 2.0 | 1406 | $3,960 | $2.82 | 16d | 1 | 0.70mi |
| 68859 Paseo Real Cathedral City, CA | 2.0 | 2.0 | 1406 | $3,960 | $2.82 | 44d | 1 | 0.70mi |
| 68695 F St Cathedral City, CA | 3.0 | 2.5 | 896 | $2,500 | $2.79 | 44d | 1 | 0.75mi |
| 35200 Cathedral Canyon Dr Unit H64 Cathedral City, CA | 2.0 | 2.0 | 1375 | $2,500 | $1.82 | 44d | 1 | 0.86mi |
| 34750 Marcia Rd Unit 02 Cathedral City, CA | 3.0 | 2.0 | 1325 | $2,000 | $1.51 | 19d | 1 | 0.87mi |
| 35200 Cathedral Canyon Dr Unit B10 Cathedral City, CA | 2.0 | 2.0 | 1384 | $2,600 | $1.88 | 44d | 1 | 0.93mi |
| 70170 Sun Valley Dr Rancho Mirage, CA | 2.0 | 2.0 | 1368 | $3,800 | $2.78 | 5d | 1 | 1.03mi |
| 37800 Da Vall Dr #12 Rancho Mirage, CA | 2.0 | 2.0 | 1387 | $2,400 | $1.73 | 44d | 1 | 1.03mi |
| 69180 Victoria Dr #8 Cathedral City, CA | 3.0 | 2.0 | 1230 | $1,995 | $1.62 | 4d | 1 | 1.06mi |
| 8 Mission Ct Rancho Mirage, CA | 2.0 | 2.0 | 1540 | $2,500 | $1.62 | 19d | 1 | 1.12mi |
| 69646 Antonia Way Rancho Mirage, CA | 2.0 | 2.0 | 966 | $2,450 | $2.54 | 19d | 1 | 1.14mi |
| 35090 Mission Hills Dr Rancho Mirage, CA | 2.0 | 2.0 | 1596 | $3,950 | $2.47 | 25d | 1 | 1.14mi |
| 38 Mission Ct Rancho Mirage, CA | 3.0 | 3.0 | 1382 | $3,500 | $2.53 | 44d | 1 | 1.15mi |
| 35082 Mission Hills Dr Rancho Mirage, CA | 2.0 | 2.5 | 1624 | $3,250 | $2.00 | 13d | 1 | 1.15mi |
| 69603 Heather Way Rancho Mirage, CA | 3.0 | 2.0 | 1218 | $2,300 | $1.89 | 44d | 1 | 1.16mi |
| 35 Mission Ct Rancho Mirage, CA | 3.0 | 2.0 | 1382 | $4,125 | $2.98 | 44d | 1 | 1.17mi |
| 68615 Paseo Soria Cathedral City, CA | 2.0 | 2.0 | 1462 | $3,500 | $2.39 | 8d | 1 | 1.17mi |
| 34361 Denise Way Rancho Mirage, CA | 3.0 | 2.0 | 1400 | $2,800 | $2.00 | 44d | 1 | 1.18mi |
| 69155 Dinah Shore Dr Cathedral City, CA | 2.0 | 2.0 | 1100 | $1,795 | $1.63 | 44d | 1 | 1.20mi |
| 69155 Dinah Shore Dr Apt 20 Cathedral City, CA | 2.0 | 2.0 | 1200 | $2,050 | $1.71 | 44d | 1 | 1.22mi |
| 35054 Mission Hills Dr Rancho Mirage, CA | 2.0 | 2.0 | 1396 | $2,549 | $1.83 | 5d | 1 | 1.23mi |
| 34073 Emily Way Rancho Mirage, CA | 2.0 | 2.0 | 966 | $2,100 | $2.17 | 19d | 1 | 1.29mi |
| 34073 Emily Way Rancho Mirage, CA | 2.0 | 2.0 | 966 | $2,100 | $2.17 | 22d | 1 | 1.29mi |
| 34071 Denise Way Rancho Mirage, CA | 3.0 | 2.0 | 1218 | $2,599 | $2.13 | 25d | 1 | 1.30mi |
| 34197 Calle Mora Cathedral City, CA | 2.0 | 2.0 | 1171 | $2,300 | $1.96 | 22d | 1 | 1.32mi |
| 34197 Calle Mora Cathedral City, CA | 2.0 | 2.0 | 1171 | $2,300 | $1.96 | 11d | 1 | 1.32mi |
| 34197 Calle Mora Cathedral City, CA | 2.0 | 2.0 | 1171 | $2,300 | $1.96 | 14d | 1 | 1.32mi |
| 70100 Mirage Cove Dr #10 Rancho Mirage, CA | 3.0 | 2.0 | 1570 | $3,000 | $1.91 | 44d | 1 | 1.34mi |
| 68368 Calle Leon Cathedral City, CA | 2.0 | 2.0 | 1406 | $3,790 | $2.70 | 44d | 1 | 1.41mi |
| 68368 Calle Leon Cathedral City, CA | 2.0 | 2.0 | 1406 | $3,790 | $2.70 | 16d | 1 | 1.41mi |
| 68177 Mountain View Rd Cathedral City, CA | 2.0 | 2.0 | 1394 | $2,895 | $2.08 | 44d | 1 | 1.42mi |
HOA detail
- Monthly dues
- $1 · $12/yr
- Likely covers
- security
Listing history 26 events
-
2026-05-08$2,100
-
2026-05-07$125,000 Active 1420-char remark
-
2024-04-13status Active
-
2024-04-12historical
-
2024-03-19price $179,500
-
2024-03-18status Active
-
2024-03-17historical
-
2024-02-26$197,500 Active
-
2023-06-29$165,000 Active
-
2023-06-28historical
-
2023-03-29price $179,900
-
2023-03-22price $185,000
-
2023-03-22status Active
-
2023-03-18historical
-
2023-03-03price $189,500
-
2023-02-07$195,000 Active
-
2022-09-20price $185,000
-
2022-09-13price $189,900
-
2022-09-06status Active
-
2022-08-31historical
-
2022-08-26$195,000 Active
-
2022-06-16historical
-
2022-06-09$190,000 Active
-
2020-08-31soldstatus $57,000 Sold
-
2020-07-31historical Backup Offers Accepted
-
2020-06-26$59,900 Active
ⓘ Source: listings_history table (triggers on properties + properties_extension) + one-shot
backfill from property_details.listing_events for pre-trigger history.
Tax reassessment forecast CA · Resets to sale price
- Current annual tax
- $418 · $35/mo
- Projected year-2 tax
- $950 · $79/mo
- Expected delta
- +$532/yr (+$44/mo · 127.2%)
ⓘ Screening estimate from a state-policy table — verify with the county assessor before closing.
Climate risk First Street
- Flood 1/10 Low FEMA zone X · 0% chance over 30 yrs
- Wildfire 4/10 Moderate
- Heat 9/10 Extreme 7 d/yr ≥113°F today · 20 d/yr by 30 yrs out
- Wind 1/10 Low
- Air quality 5/10 Major 6 unhealthy d/yr today · 8 by 30 yrs out
Nearby sold comps map
Loading sold comps map…
Walkable amenities ~0.75 mi
Loading nearby amenities…
Taxation est. · year 1
- Rental income
- $32,509
- − Mortgage interest
- −$7,002
- − Property taxes
- −$418
- − Insurance
- −$625
- − Repairs & maintenance
- −$2,601
- − Management
- −$2,601
- − HOA
- −$12
- − Depreciation
- −$3,636
- Taxable income
- $15,614
- Est. tax owed @ 24.0%
- −$3,747
- After-tax cash flow
- $13,013/yr
For passive investors: Depreciation is non-cash, so a rental often shows a tax loss while cash-flowing — sheltering income. Rental losses are passive: they offset passive income freely, and up to $25,000/yr can offset ordinary (W-2) income if you actively participate and your MAGI is under $100k (phasing out to $0 by $150k); unused losses carry forward. On sale, claimed depreciation is recaptured at up to 25%, and gains may owe capital-gains tax (a 1031 exchange can defer both). Figures are a year-1 estimate at your 24.0% rate — not tax advice; consult a CPA.
Schools (NCES district)
- District
- Palm Springs Unified
- NCES district ID
- 0629550
- Math proficiency
- 21% ▼ -7.00%
- Reading proficiency
- 42% ▬ 0.00%
- Median HH income
- $43,638
- Composite
- 26.76/100
- National rank
- #7131
- State rank
- #328 of 517 in CA
Livability — Cathedral City
- Score
- 66/100
- State rank
- #344
- US rank
- #11749
Category grades
Schools grade is shown separately in the Schools card above.
Census & demographics
- Census place
- Cathedral City, CA
- County
- Riverside County · 2,287,001 people
- City population
- 52,267
- Metro
- Riverside-San Bernardino-Ontario, CA
- Population (ZIP)
- 52,267
- Household income
- $73,572
- Rent vs Own
- Severe rent burden
- 1682.0
Population outlook (Riverside County) Hauer SSP2
- Today (2025)
- 2,664,475 people
- By 2030
- 2,802,692 · +5.2%
- By 2040
- 3,050,904 · +14.5%
- By 2050
- 3,256,783 · +22.2%
- By 2075
- 3,655,058 · +37.2%
- By 2100
- 3,766,594 · +41.4%
Race, ethnicity, and origin ACS 2023
- Neighborhood character
- Diverse neighborhood (Simpson 0.56)
- Race & ethnicity
- Hispanic / Latino 59% White 30% Two or more races 27% Asian 6% Native American 2% Black 2%
- Hispanic origin (detail)
- Mexican 51%
- Common ancestry
- Lithuanian 2% Romanian 1% Italian 1%
- Foreign-born
- 28% · Canada, Vietnam
- Languages at home
- 48% English-only · Spanish 46% Tagalog/Filipino 3% Other Asian/Pacific 1%
Political lean MEDSL · Riverside
- 2024 margin
- Toss-up / Even · D 48.0% · R 49.3% · Other 2.6%
- 2008→2024 swing
- -3.6pp toward R · 2008: 2.3pp · 2024: -1.3pp
- All cycles
- 2024: R+1.3 2020: D+8.0 2016: D+4.3 2012: R+0.4 2008: D+2.3
Not yet ingested
- Civics
- —
Market trends
- HPI YoY
- ▼ -136.57%
- Current HPI
- 356.9845
- Rent YoY
- ▲ 3.22%
- Metro
- Riverside-San Bernardino-Ontario, CA
- State GDP YoY
- ▲ 3.21%
- F500 in state
- 116
Industry mix (Fortune 500 HQ in CA)
| Industry | F500 HQs | Revenue |
|---|---|---|
| Technology | 27 | $1,492B |
|
||
| Financial Services | 3 | $174B |
|
||
| Retail | 3 | $44B |
|
||
| Insurance | 3 | $26B |
|
||
| Media / Entertainment | 2 | $115B |
|
||
| Pharmaceuticals / Biotech | 2 | $62B |
|
||
Price history
-96.5% since first listed28 events — show timeline
- 2026-05-25 Listing Removed — GPSMLS
- 2026-05-19 Rental Removed $2,100 CRMLS
- 2026-05-08 Listed for Rent $2,100 CRMLS
- 2026-05-07 Listed $125,000 GPSMLS
- 2024-04-13 Relisted — GPSMLS
- 2024-04-12 Listing Removed — GPSMLS
- 2024-03-19 Price Changed $179,500 GPSMLS
- 2024-03-18 Relisted — GPSMLS
- 2024-03-17 Listing Removed — GPSMLS
- 2024-02-26 Listed $197,500 GPSMLS
- 2023-06-29 Listed $165,000 GPSMLS
- 2023-06-28 Listing Removed — GPSMLS
- 2023-03-29 Price Changed $179,900 GPSMLS
- 2023-03-22 Price Changed $185,000 GPSMLS
- 2023-03-22 Relisted — GPSMLS
- 2023-03-18 Listing Removed — GPSMLS
- 2023-03-03 Price Changed $189,500 GPSMLS
- 2023-02-07 Listed $195,000 GPSMLS
- 2022-09-20 Price Changed $185,000 GPSMLS
- 2022-09-13 Price Changed $189,900 GPSMLS
- 2022-09-06 Relisted — GPSMLS
- 2022-08-31 Listing Removed — GPSMLS
- 2022-08-26 Listed $195,000 GPSMLS
- 2022-06-16 Listing Removed — GPSMLS
- 2022-06-09 Listed $190,000 GPSMLS
- 2020-08-31 Sold (MLS) $57,000 TheMLS
- 2020-07-31 Contingent — TheMLS
- 2020-06-26 Listed $59,900 TheMLS
Property tax history
+3.3%/yrLatest (2025): $418 · +20.6% YoY. Source: county tax records.
Cash-flow waterfall
monthlySold comps — $/sqft
last 12 mo · ≤1 miLoading sold comps…