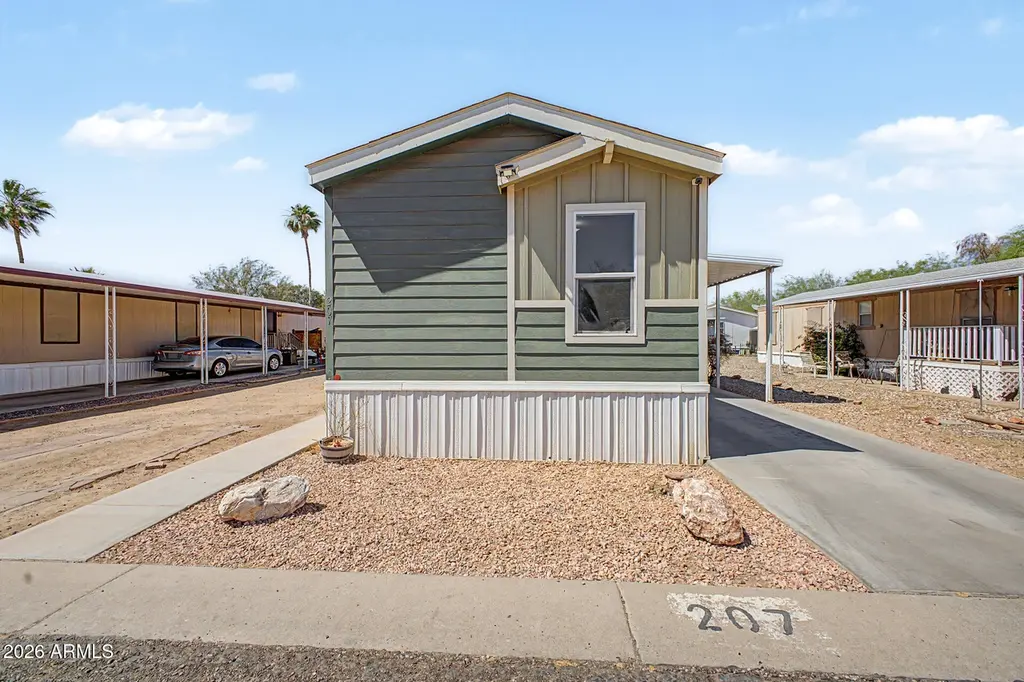
12721 W Greenway Rd #207 · El Mirage, AZ
Flood risk 1/10 · Minimal
- FEMA flood zone
- X (shaded)
- Chance of flooding over 30 yrs
- 0.0%
- Est. flood insurance / yr
- $507 – $1,088
Fire risk 4/10 · Minor
- Est. fire insurance / yr
- $610 – $1,132
Heat risk 9/10 · Severe
- Hot days now (above 114°F)
- 7 days/yr
- Hot days in 30 yrs
- 18 days/yr
Wind risk 1/10 · Minimal
- Chance of severe wind over 30 yrs
- —
Air-quality risk 2/10 · Minimal
- Unhealthy air days now
- 1 days/yr
- Unhealthy air days in 30 yrs
- 1 days/yr
Risk factors via First Street. Map © Google.
Why this score? — see what drove the B- grade
The composite is a weighted blend of 9 inputs, each scored 0–100. Each bar is that input's sub-score; the figure is the points it added to the 100-point composite (weight × sub-score).
- Cash flow +30.0/30.0
- 1% rule +10.0/10.0
- DSCR +10.0/10.0
- ARV discount +7.0/15.0
- Condition / age +4.0/5.0
- Schools +3.3/10.0
- Livability +3.2/5.0
- Rent growth +2.5/5.0
- Appreciation +0.0/10.0
$77,990
🖨 Deal sheet (PDF) 📄 Offer letter ✓ Due diligence
Listing remarks
Charming 3-bedroom, 2-bath mobile home located in the desirable Rosewood Estates community! This well-maintained home features two convenient storage sheds and is nestled in a beautiful neighborhood offering exclusive access to a private park and refreshing community pool. Enjoy comfortable living in a peaceful community with great amenities perfect for relaxing and spending time with family and friends.
Key facts
- 7 parking spots
- Community pool
- Built 2015
Property features AI
Finance
- HOA & community: No association fees; Land lease ($890.25 monthly); Community pool; Community spa (heated); Playground
Exterior
- Parking: 3 open parking spaces; 4 covered parking spaces; 4 carport spaces
- Security: Gated community
- Utilities: City water; Public sewer
- Home design: Manufactured/mobile home; Leasehold ownership
- Construction: Metal siding; Wood frame construction; Metal roof; Building area listed by builder
- Exterior features: Shed(s); Gravel/stone front; Private maintained road
Interior
- Kitchen: Refrigerator; Dishwasher
- Bedrooms: Up to 3 bedrooms
- Flooring: Carpet; Vinyl
- Bathrooms: 2 full bathrooms
- Heating & cooling: Electric heating; Central air conditioning
- Interior features: Eat-in kitchen; Full bath in primary bedroom
- Laundry & utility: Washer/dryer hookup only
Neighborhood map
What this means for you Summary
Snapshot
- This is a 3-bed/2.0-bath manufactured listed at $78k. Condition is rated good.
Deal economics
- At list price, monthly cash flow is $903 ($11k/yr) — positive.
- The deal already cash-flows at list — no discount required.
- Meets the 1% rule at list price ($2k rent vs $78k).
- Recommended offer: $76k (3.0% below list) — sets the bar for market timing.
- Cap rate 20.2% vs local median 4.5% in El Mirage — top-decile yield for the area; either an underpriced asset or a hidden risk that comps aren't pricing in. Stress-test before assuming the spread holds.
Location & tenants
- Location reads 63/100 on livability (#112 in AZ) — a middle-class / working-renter tenant base. Strengths: housing A+, cost of living A; Watch: amenities F, commute F, health & safety F.
- Dysart Unified District (4243) (suburban): math 34% / reading 40% proficiency, ranked #73 of 249 in AZ (top 29%) — families likely to look elsewhere, expect single-tenant / working-renter base with shorter leases.
- Zoned schools: Surprise Elementary School (math 27% / reading 38%, grade F, #502 of 1,109 statewide, top 45%, 771 students, 72% FRL); Valley Vista High School (math 25% / reading 32%, grade F, #133 of 381 statewide, top 35%, 2,464 students, 44% FRL) — zoned schools average 58% FRL vs 41% district-wide (17 pts higher); higher-poverty schools than district average — tighter screening recommended.
- Market conditions: Rents flat; 132 active listings in the ZIP; 30 comparable units currently listed for rent nearby; rentals at typical pace (median 25d on market — plan ~3-4 weeks tenant-placement turnaround); solid renter incomes; 36,011 units permitted in Maricopa County in 2024 (12,801 in 5+ unit buildings).
Forward outlook
- Local home prices are declining (-3.0%/yr); year-one equity from $540 of loan paydown is wiped out by about $2k of value loss. Plan a longer hold.
- Maricopa County population projected at +38% by 2050 — long-run rental-demand tailwind backs the buy-and-hold thesis.
- At projected returns (-3.0% appreciation + 0.1% rent growth), your $22k cash investment doubles in ~3 years — after that, you're playing with house money.
Negotiation context
- It's been on market 33 days — a 3% lower offer ($76k) is reasonable based on typical stale-listing flexibility.
Risks & watch-outs
- Climate carrying-cost: extreme-heat days projected 7→18/yr by 2055 (HVAC capex compounding) — expect insurance premiums to compound above CPI over the hold.
Questions for the listing agent
- It's been on market 33 days. Have you received any prior offers? Is the seller open to a 3% concession, seller financing, or rate buy-down credit?
- Is there a deadline driving the sale (1031 exchange, divorce, estate, relocation)? That informs how much negotiation room exists.
- Schools are D-rated, which usually means shorter tenancies and higher turnover. Who's the typical renter profile here, and what's been the actual vacancy rate?
- What's the average days-on-market for RENTAL listings here right now (not sales)? A rising rental-DOM trend means longer vacancies and softer asking-rent achievability than the comps imply.
- What's the recent tenant-quality profile in this submarket — average credit score on applications, eviction rate, late-payment / NSF rate, and stable-employment percentage? A property-management company in the area should have these aggregated.
- How much new for-sale + rental construction is in the pipeline within 1–3 miles? Heavy new supply typically softens prices + rents 12–24 months out; constrained supply supports both.
Investment metrics
- 1% rule
- 2.34% ✓
- Cap rate
- 20.19%
- Cash-on-cash
- 49.63%
- DSCR
- 3.21
- GRM
- 3.6
CMA / ARV
- ARV (on-the-fly)
- $77,210
- Comps found
- 8
Show comp detail 8 sales within ~0.75 mi
| Address | Dist | Beds/Ba | Sqft | Sold | Price | $/sf | Match |
|---|---|---|---|---|---|---|---|
| 12721 W Greenway Rd #184 | 0.00mi | 3/2.0 | 1,140 (+3%) | 2mo | $48,000 | $42 | 93 |
| 12721 W Greenway Way #200 | 0.12mi | 3/2.0 | 1,140 (+3%) | 3mo | $73,000 | $64 | 86 |
| 12721 W Greenway Rd #24 | 0.12mi | 3/2.0 | 1,088 (-1%) | 15mo | $85,000 | $78 | 80 |
| 15780 N Sunny Ln | 0.43mi | 3/2.0 | 1,120 (+2%) | 2mo | $197,000 | $176 | 76 |
| 12721 W Greenway Rd #80 | 0.12mi | 3/2.0 | 1,216 (+10%) | 8mo | $83,990 | $69 | 71 |
| 12721 W Greenway Rd #175 | 0.12mi | 3/2.0 | 1,140 (+3%) | 22mo | $80,000 | $70 | 70 |
| 12721 W Greenway Rd #136 | 0.12mi | 2/2.0 (-1) | 1,040 (-6%) | 13mo | $98,000 | $94 | 69 |
| 12721 W Greenway Rd #6 | 0.12mi | 3/2.0 | 1,216 (+10%) | 13mo | $72,000 | $59 | 67 |
Match score weights: distance 35% · size 25% · config 20% · recency 20%. Top-matched comps best support the ARV.
Projected returns pro-forma
-3.0% appreciation · 0.08% rent growth · sell at horizon
- IRR
- 43.9%
- Equity multiple
- 2.82×
- Total profit
- $39,698
- Equity at exit
- $11,629
- IRR
- 48.6%
- Equity multiple
- 5.06×
- Total profit
- $88,575
- Equity at exit
- $6,743
Cash invested: $21,837 (down + closing). Projections, not guarantees.
Landlord ↔ Tenant lean methodology
- Overall (STATE)
- 87 Strongly Landlord-Friendly
- State Arizona
- 87 Strongly Landlord-Friendly · R+3
- County
- — inherits STATE
- City
- — inherits STATE
ZIP-level market 85335
- Home prices YoY
- -13.3%
- Rents YoY
- 0.1%
- Active inventory
- 132
- Price-to-rent
- 3.6×
Monthly cashflow live
- Estimated rent
- $1,825 high interval (Pro) →
- Mortgage (P&I)
- −$409
- Tax est. 1.5%
- −$97 /mo · $1,170/yr
- Insurance
- −$32
- HOA
- −$0
- Vacancy / Maint / Mgmt
- −$383
- Net cashflow
- $903
Break-even live
Sensitivity live
| Price | -10% $957 | -5% $930 | +0% $903 | +5% $876 | +10% $849 |
|---|---|---|---|---|---|
| Rent | -10% $759 | -5% $831 | +0% $903 | +5% $975 | +10% $1,047 |
| Rate | -1.0pp $942 | -0.5pp $923 | base $903 | +0.5pp $883 | +1.0pp $862 |
UW: 25.0% down · 7.5% · 30yr · 1.5% tax · 5.0% vac · 8.0% maint · 8.0% mgmt
Financing live
Cash to close
- Down payment
- $19,498
- Closing costs
- $2,340
- Reserves months
- —
- Total cash needed
- —
Loan-product check · same deal, 3 products live
Conventional
25% down · 7.5% · 30yr
- Down + closing
- —
- Monthly P&I
- —
- Monthly cashflow
- —
- DSCR
- —
- Eligible?
- —
Personal DTI + credit; lowest rate.
DSCR
20% down · 8.5% · 30yr
- Down + closing
- —
- Monthly P&I
- —
- Monthly cashflow
- —
- DSCR
- —
- Eligible?
- —
No personal income docs; deal must DSCR.
Hard money
10% down · 12.0% · 12mo
- Down + closing
- —
- Monthly P&I
- —
- Monthly cashflow
- —
- DSCR
- —
- Eligible?
- —
Short-term bridge; refi at stabilization.
Rent comps 30 comps
| Address | Beds | Baths | Sqft | Rent | $/sqft | DOM | Units | Dist |
|---|---|---|---|---|---|---|---|---|
| 12945 W Greenway Rd El Mirage, AZ | 2.0 | 2.0 | 1060 | $1,300 | $1.23 | 24d | 4 | 0.22mi |
| 12574 W Lisbon Ln El Mirage, AZ | 3.0 | 2.0 | 1058 | $1,700 | $1.61 | 5d | 1 | 0.25mi |
| 15426 N Cactus Ln Surprise, AZ | 3.0 | 1.0 | 1376 | $1,634 | $1.19 | 44d | 1 | 0.40mi |
| 12438 W Hearn Rd El Mirage, AZ | 3.0 | 2.0 | 1308 | $1,595 | $1.22 | 24d | 1 | 0.44mi |
| 15427 N Jerry St Surprise, AZ | 2.0 | 1.5 | 920 | $1,450 | $1.58 | 5d | 1 | 0.51mi |
| 15620 N El Mirage Rd Surprise, AZ | 3.0 | 2.5 | 1310 | $1,599 | $1.22 | 24d | 2 | 0.60mi |
| 14417 N Gil Balcome Surprise, AZ | 3.0 | 2.0 | 1446 | $1,900 | $1.31 | 5d | 1 | 0.66mi |
| 12741 W Tasha Dr Surprise, AZ | 2.0 | 1.0 | 750 | $1,275 | $1.70 | 24d | 1 | 0.67mi |
| 12817 W Cottonwood St Unit 1 Surprise, AZ | 2.0 | 1.0 | 725 | $1,300 | $1.79 | 5d | 1 | 0.72mi |
| 13314 W Mauna Loa Ln Surprise, AZ | 3.0 | 2.0 | 1252 | $2,355 | $1.88 | 44d | 1 | 0.76mi |
| 16520 N Greasewood St Surprise, AZ | 2.0–3.0 | 2.5 | 1267 | $1,850 | $1.46 | 2d | 17 | 0.82mi |
| 13148 W Redfield Rd Surprise, AZ | 3.0 | 2.0 | 1372 | $1,970 | $1.44 | 4d | 1 | 0.87mi |
| 12731 W Sharon Dr El Mirage, AZ | 3.0 | 2.0 | 1300 | $1,650 | $1.27 | 17d | 1 | 0.95mi |
| 16629 N Greasewood St Surprise, AZ | 2.0 | 1.5 | 1052 | $1,462 | $1.39 | 2d | 3 | 0.98mi |
| 13939 N 132nd Ln Surprise, AZ | 3.0 | 2.5 | 1297 | $3,500 | $2.70 | 44d | 1 | 1.00mi |
| 12430 W Willow Ave El Mirage, AZ | 3.0 | 2.0 | 1183 | $5,900 | $4.99 | 5d | 1 | 1.05mi |
| 14005 N Palm St Unit 4 El Mirage, AZ | 2.0 | 1.0 | 830 | $1,200 | $1.45 | 44d | 1 | 1.06mi |
| 13913 N Palm St Unit 12 El Mirage, AZ | 2.0 | 1.0 | 800 | $1,200 | $1.50 | 2d | 1 | 1.08mi |
| 13913 N Palm St Unit 14 El Mirage, AZ | 2.0 | 1.0 | 830 | $1,200 | $1.45 | 44d | 1 | 1.08mi |
| 13338 W Boca Raton Rd Surprise, AZ | 3.0 | 2.0 | 1412 | $2,096 | $1.48 | 24d | 1 | 1.09mi |
| 13342 W Canyon Creek Dr Surprise, AZ | 3.0 | 2.0 | 1419 | $1,750 | $1.23 | 24d | 1 | 1.10mi |
| 14809 N El Frio Cir El Mirage, AZ | 4.0 | 2.0 | 1459 | $2,199 | $1.51 | 22d | 1 | 1.11mi |
| 12814 W Pershing St El Mirage, AZ | 4.0 | 3.0 | 1495 | $1,945 | $1.30 | 13d | 1 | 1.20mi |
| 11759 W Banff Ln El Mirage, AZ | 4.0 | 2.5 | 1495 | $2,000 | $1.34 | 44d | 1 | 1.25mi |
| 12521 W Myer Ln El Mirage, AZ | 3.0 | 2.0 | 1410 | $1,700 | $1.21 | 44d | 1 | 1.28mi |
| 12022 W Ash St El Mirage, AZ | 3.0 | 2.0 | 1040 | $1,800 | $1.73 | 24d | 1 | 1.31mi |
| 11755 W Thompson Ranch Rd El Mirage, AZ | 1.0–3.0 | 1.0–2.0 | 936 | $2,771 | $2.96 | 1d | 1 | 1.37mi |
| 13831 W Fargo Dr Surprise, AZ | 3.0 | 2.0 | 1100 | $1,600 | $1.45 | 24d | 1 | 1.38mi |
| 13843 W Fargo Dr Surprise, AZ | 3.0 | 2.0 | 1201 | $1,795 | $1.49 | 44d | 1 | 1.40mi |
| 13517 N Luna St El Mirage, AZ | 3.0 | 1.0 | 1260 | $1,530 | $1.21 | 24d | 1 | 1.46mi |
Listing history 14 events
-
2026-06-18days on market $77,990 Active 33 DOM
-
2026-06-17days on market $77,990 Active 32 DOM
-
2026-06-16days on market $77,990 Active 31 DOM
-
2026-06-15days on market $77,990 Active 30 DOM
-
2026-06-13days on market $77,990 Active 28 DOM
-
2026-06-09days on market $77,990 Active 24 DOM
-
2026-06-08days on market $77,990 Active 23 DOM
-
2026-06-07days on market $77,990 Active 22 DOM
-
2026-06-04days on market $77,990 Active 19 DOM
-
2026-06-03days on market $77,990 Active 18 DOM
-
2026-06-02days on market $77,990 Active 17 DOM
-
2026-06-01days on market $77,990 Active 16 DOM
-
2026-05-31days on market $77,990 Active 15 DOM
-
2026-05-16$77,990 Active
ⓘ Source: listings_history table (triggers on properties + properties_extension) + one-shot
backfill from property_details.listing_events for pre-trigger history.
Climate risk First Street
- Flood 1/10 Low FEMA zone X (shaded) · 0% chance over 30 yrs
- Wildfire 4/10 Moderate
- Heat 9/10 Extreme 7 d/yr ≥114°F today · 18 d/yr by 30 yrs out
- Wind 1/10 Low
- Air quality 2/10 Low 1 unhealthy d/yr today · 1 by 30 yrs out
Nearby sold comps map
Loading sold comps map…
Walkable amenities ~0.75 mi
Loading nearby amenities…
Taxation est. · year 1
- Rental income
- $21,905
- − Mortgage interest
- −$4,369
- − Property taxes
- −$1,170
- − Insurance
- −$390
- − Repairs & maintenance
- −$1,752
- − Management
- −$1,752
- − Depreciation
- −$2,269
- Taxable income
- $10,203
- Est. tax owed @ 24.0%
- −$2,449
- After-tax cash flow
- $8,389/yr
For passive investors: Depreciation is non-cash, so a rental often shows a tax loss while cash-flowing — sheltering income. Rental losses are passive: they offset passive income freely, and up to $25,000/yr can offset ordinary (W-2) income if you actively participate and your MAGI is under $100k (phasing out to $0 by $150k); unused losses carry forward. On sale, claimed depreciation is recaptured at up to 25%, and gains may owe capital-gains tax (a 1031 exchange can defer both). Figures are a year-1 estimate at your 24.0% rate — not tax advice; consult a CPA.
Condition & rehab AI · 30 photos
This well-maintained mobile home in a desirable community offers a good return on investment with minor cosmetic updates.
Value-add opportunities
- Resale paint exterior — enhances curb appeal
- Both install new flooring — improves aesthetics and value
- Both install new windows — increases energy efficiency and value
Renovation cost estimate screening
Value-add ROI direction
- Resale paint exterior — enhances curb appeal ↑
- Both install new flooring — improves aesthetics and value ↑
- Both install new windows — increases energy efficiency and value ↑
ⓘ Cost ranges are severity-bucket heuristics (US national rule-of-thumb). Get contractor quotes + a written scope before underwriting a rehab budget.
Schools (NCES district)
- District
- Dysart Unified District (4243)
- NCES district ID
- 0402690
- Math proficiency
- 34% ▼ -10.00%
- Reading proficiency
- 40% ▼ -5.00%
- Median HH income
- $58,033
- Composite
- 32.76/100
- National rank
- #5634
- State rank
- #73 of 249 in AZ
Livability — El Mirage
- Score
- 63/100
- State rank
- #112
- US rank
- #15164
Category grades
Schools grade is shown separately in the Schools card above.
Census & demographics
- Census place
- El Mirage, AZ
- County
- Maricopa County · 4,537,380 people
- City population
- 36,088
- Metro
- Phoenix-Mesa-Chandler, AZ
- Population (ZIP)
- 36,088
- Household income
- $78,050
- Rent vs Own
- Severe rent burden
- 669.0
Population outlook (Maricopa County) Hauer SSP2
- Today (2025)
- 4,979,203 people
- By 2030
- 5,378,229 · +8.0%
- By 2040
- 6,156,598 · +23.6%
- By 2050
- 6,872,376 · +38.0%
- By 2075
- 8,401,270 · +68.7%
- By 2100
- 9,247,439 · +85.7%
Race, ethnicity, and origin ACS 2023
- Neighborhood character
- Diverse neighborhood (Simpson 0.62)
- Race & ethnicity
- Hispanic / Latino 50% White 35% Two or more races 28% Black 6% Native American 1% Pacific Islander 1%
- Hispanic origin (detail)
- Mexican 37%
- Common ancestry
- Lithuanian 2% Romanian 1% Iranian 1%
- Foreign-born
- 15% · Canada
- Languages at home
- 66% English-only · Spanish 30% Other Indo-European 1% Other Asian/Pacific 1%
Political lean MEDSL · Maricopa
- 2024 margin
- Toss-up / Even · D 47.7% · R 51.2% · Other 1.1%
- 2008→2024 swing
- +7.1pp toward D · 2008: -10.6pp · 2024: -3.5pp
- All cycles
- 2024: R+3.5 2020: D+2.2 2016: R+3.5 2012: R+12.0 2008: R+10.6
Not yet ingested
- Civics
- —
Market trends
- HPI YoY
- ▼ -52.81%
- Current HPI
- 342.6503
- Rent YoY
- ▲ 0.08%
- Metro
- Phoenix-Mesa-Chandler, AZ
- State GDP YoY
- ▲ 4.54%
- F500 in state
- 20
Industry mix (Fortune 500 HQ in AZ)
| Industry | F500 HQs | Revenue |
|---|---|---|
| Technology | 2 | $13B |
|
||
| Mining / Metals | 1 | $23B |
|
||
| Environmental Services | 1 | $16B |
|
||
| Metals / Steel | 1 | $14B |
|
||
| Technology Distribution | 1 | $9B |
|
||
| Homebuilding | 1 | $8B |
|
||
Price history
1 event — show timeline
- 2026-05-16 Listed $77,990 ARMLS
Cash-flow waterfall
monthlySold comps — $/sqft
last 12 mo · ≤1 miLoading sold comps…