2716 Newport St · Jackson, MS
Flood risk 6/10 · Moderate
- FEMA flood zone
- AE
- Chance of flooding over 30 yrs
- 0.69%
- Est. flood insurance / yr
- $1,737 – $8,500
Fire risk 1/10 · Minimal
- Est. fire insurance / yr
- $1,241 – $2,305
Heat risk 7/10 · Major
- Hot days now (above 109°F)
- 7 days/yr
- Hot days in 30 yrs
- 20 days/yr
Wind risk 8/10 · Major
- Chance of severe wind over 30 yrs
- 80.0%
Air-quality risk 2/10 · Minimal
- Unhealthy air days now
- 0 days/yr
- Unhealthy air days in 30 yrs
- 1 days/yr
Risk factors via First Street. Map © Google.
Why this score? — see what drove the C- grade
The composite is a weighted blend of 9 inputs, each scored 0–100. Each bar is that input's sub-score; the figure is the points it added to the 100-point composite (weight × sub-score).
- Cash flow +15.0/30.0
- Appreciation +10.0/10.0
- ARV discount +7.5/15.0
- 1% rule +5.0/10.0
- DSCR +5.0/10.0
- Livability +3.4/5.0
- Rent growth +2.5/5.0
- Condition / age +2.5/5.0
- Schools +1.1/10.0
$15,000
🖨 Deal sheet 📄 Offer letter ✓ Due diligence
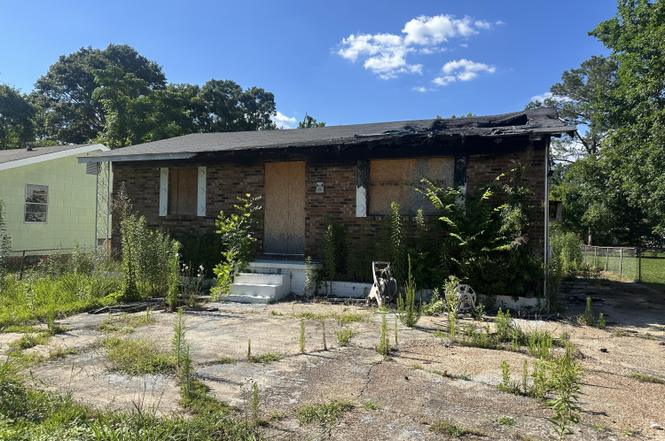
Listing remarks
Come and invest in this 3br/1.5ba burnt property with great potential. Home has a gas packaged unit, fenced front and back yard, concrete driveway, home foundation seems solid. Call a Realtor now to view!
Key facts
- Concrete driveway
- 7,405 sq ft lot
- Built 1960
Tags
Property features AI
Finance
- Other: Building area: 1,117 (source: public records); Lot size approximately 0.17 acres (7,405.2 sq ft)
Exterior
- Parking: Concrete driveway
- Utilities: Public water; Public sewer; Cable available; Electricity available; Natural gas available; Water available
- Home design: Single family residence (house); One story; Fixer condition
- Construction: Asbestos and brick construction; Asphalt shingle roof; Conventional foundation; Built (year source: public records)
- Exterior features: Partial chain link fencing; City lot
Interior
- Flooring: Carpet
- Bathrooms: 1 full bathroom; 1 half bathroom (1.5 total)
- Heating & cooling: Central heating (natural gas); Ceiling fan(s); Central air conditioning; Electric cooling; Wall/window unit(s); Gas cooling
- Interior features: Ceiling fan(s); Aluminum frame windows
Neighborhood map
What this means for you Summary
Snapshot
- This is a 3-bed/1.0-bath single-family listed at $15k.
Deal economics
- At list price, monthly cash flow is $270 ($3k/yr) — positive.
- The deal already cash-flows at list — no discount required.
- Meets the 1% rule at list price ($1k rent vs $15k).
- Cap rate 62.0% vs local median 9.9% in Jackson — top-decile yield for the area; either an underpriced asset or a hidden risk that comps aren't pricing in. Stress-test before assuming the spread holds.
Location & tenants
- Location reads 68/100 on livability (#66 in MS) — a middle-class / working-renter tenant base. Strengths: commute A+, cost of living A+, housing A+; Watch: amenities F, employment F, health & safety F.
- Jackson Public School District (urban): math 9% / reading 18% proficiency, ranked #112 of 130 in MS (top 86%) — low school quality limits family demand, transient renter base, plan for 1-2y turnover; 88% free/reduced lunch — lower-income household profile, screen leases tightly.
- Zoned schools: Johnson Elementary School (math 2% / reading 12%, grade F, #337 of 375 statewide, top 94%, 290 students, 100% FRL); Powell Middle School (math 3% / reading 6%, grade F, #177 of 179 statewide, top 99%, 320 students, 100% FRL); Lanier High School (math 3% / reading 2%, grade F, #197 of 197 statewide, top 100%, 603 students, 100% FRL).
- Market conditions: 81 active listings in the ZIP; 10 comparable units currently listed for rent nearby; rentals at typical pace (median 23d on market — plan ~3-4 weeks tenant-placement turnaround); 40% of comp listings sitting > 30 days — soft ceiling on asking rent; lower-income renter base — watch delinquency; 167 units permitted in Hinds County in 2024 (0 in 5+ unit buildings).
- This rent runs 43% of the median local income ($30k/yr) — at the standard rent-burdened threshold; future hikes will face affordability resistance.
Forward outlook
- In year one you build about $2k of equity ($104 loan paydown + $2k appreciation (10.0% local appreciation)).
- Hinds County population projected to shrink 6% by 2050 — rents likely to lag national; underwrite the cash flow, not the appreciation.
- At projected returns (10.0% appreciation + 3.0% rent growth), your $4k cash investment doubles in ~1 year — after that, you're playing with house money.
Negotiation context
- Only 8 days on market — expect competitive offers; lowballing is unlikely to land.
Risks & watch-outs
- Watch-outs: property tax is 3.6% of price; flood insurance adds $427/mo.
- Climate carrying-cost: in FEMA flood zone AE (mandatory federal flood insurance); severe wind risk, 80% chance of damaging wind over 30y; extreme-heat days projected 7→20/yr by 2055 (HVAC capex compounding) — expect insurance premiums to compound above CPI over the hold.
Questions for the listing agent
- Built in 1960 — when were the roof, HVAC, electrical panel, plumbing, and water heater last replaced?
- Property tax is high relative to price — has the assessment been appealed recently, and will the sale trigger a re-assessment?
- What's the actual annual flood-insurance premium (NFIP or private), and is the property in a SFHA with mandatory coverage?
- Is there a deadline driving the sale (1031 exchange, divorce, estate, relocation)? That informs how much negotiation room exists.
- Schools are F-rated, which usually means shorter tenancies and higher turnover. Who's the typical renter profile here, and what's been the actual vacancy rate?
- What's the average days-on-market for RENTAL listings here right now (not sales)? A rising rental-DOM trend means longer vacancies and softer asking-rent achievability than the comps imply.
- What's the recent tenant-quality profile in this submarket — average credit score on applications, eviction rate, late-payment / NSF rate, and stable-employment percentage? A property-management company in the area should have these aggregated.
- How much new for-sale + rental construction is in the pipeline within 1–3 miles? Heavy new supply typically softens prices + rents 12–24 months out; constrained supply supports both.
Investment metrics
- 1% rule
- 6.98% ✓
- Cap rate
- 62.04%
- Cash-on-cash
- 199.09%
- DSCR
- 9.86
- GRM
- 1.2
CMA / ARV
- ARV (on-the-fly)
- $52,416
- Comps found
- 10
Show comp detail 10 sales within ~0.75 mi
| Address | Dist | Beds/Ba | Sqft | Sold | Price | $/sf | Match |
|---|---|---|---|---|---|---|---|
| 4326 Sunset Dr | 0.37mi | 3/1.5 | 1,100 (+1%) | 3mo | $19,500 | $18 | 77 |
| 2858 Newport St | 0.20mi | 3/2.0 | 1,000 (-8%) | 3mo | $45,000 | $45 | 70 |
| 2424 Utah St | 0.25mi | 3/1.0 | 1,000 (-8%) | 9mo | $80,000 | $80 | 67 |
| 2438 Kingston Ave | 0.52mi | 3/2.0 | 1,042 (-5%) | 2mo | $51,000 | $49 | 63 |
| 2516 Montebello Drive Dr | 0.25mi | 3/1.0 | 1,000 (-8%) | 14mo | $100,000 | $100 | 62 |
| 3625 Liberty St | 0.64mi | 3/1.0 | 1,056 (-3%) | 5mo | $55,000 | $52 | 60 |
| 3845 Gammill St | 0.39mi | 3/1.0 | 994 (-9%) | 12mo | $35,000 | $35 | 57 |
| 4326 Kingsroad | 0.30mi | 3/1.5 | 1,215 (+11%) | 10mo | $55,000 | $45 | 56 |
| 3833 Warner Ave | 0.54mi | 2/2.0 (-1) | 1,064 (-3%) | 14mo | $34,999 | $33 | 50 |
| 3828 California Ave | 0.63mi | 3/1.0 | 941 (-14%) | 11mo | $45,000 | $48 | 39 |
Match score weights: distance 35% · size 25% · config 20% · recency 20%. Top-matched comps best support the ARV.
Projected returns pro-forma
10.0% appreciation · 3.0% rent growth · sell at horizon
- IRR
- 88.0%
- Equity multiple
- 7.11×
- Total profit
- $25,677
- Equity at exit
- $13,513
- IRR
- 82.8%
- Equity multiple
- 15.92×
- Total profit
- $62,663
- Equity at exit
- $29,142
Cash invested: $4,200 (down + closing). Projections, not guarantees.
Landlord ↔ Tenant lean methodology
- Overall (STATE)
- 90 Strongly Landlord-Friendly
- State Mississippi
- 90 Strongly Landlord-Friendly · R+11
- County
- — inherits STATE
- City
- — inherits STATE
ZIP-level market 39213
- Home prices YoY
- 7.0%
- Active inventory
- 81
- Price-to-rent
- 1.2×
Monthly cashflow live
- Estimated rent
- $1,047 high interval (Pro) →
- Mortgage (P&I)
- −$79
- Tax from tax record
- −$45 /mo · $541/yr
- Insurance
- −$6
- Flood insurance flood zone
- −$427 /mo · $5,118/yr
- HOA
- −$0
- Vacancy / Maint / Mgmt
- −$220
- Net cashflow
- $270
Break-even live
UW: 25.0% down · 7.5% · 30yr · 1.5% tax · 5.0% vac · 8.0% maint · 8.0% mgmt
Financing live
Cash to close
- Down payment
- $3,750
- Closing costs
- $450
- Reserves months
- —
- Total cash needed
- —
Loan-product check · same deal, 3 products live
Conventional
25% down · 7.5% · 30yr
- Down + closing
- —
- Monthly P&I
- —
- Monthly cashflow
- —
- DSCR
- —
- Eligible?
- —
Personal DTI + credit; lowest rate.
DSCR
20% down · 8.5% · 30yr
- Down + closing
- —
- Monthly P&I
- —
- Monthly cashflow
- —
- DSCR
- —
- Eligible?
- —
No personal income docs; deal must DSCR.
Hard money
10% down · 12.0% · 12mo
- Down + closing
- —
- Monthly P&I
- —
- Monthly cashflow
- —
- DSCR
- —
- Eligible?
- —
Short-term bridge; refi at stabilization.
Rent comps 10 comps
| Address | Beds | Baths | Sqft | Rent | $/sqft | DOM | Units | Dist |
|---|---|---|---|---|---|---|---|---|
| 2475 Greenfield Ave Jackson, MS | 2.0 | 1.5 | 1000 | $800 | $0.80 | 43d | 1 | 0.31mi |
| 3625 Liberty St Jackson, MS | 3.0 | 1.0 | 1056 | $1,190 | $1.13 | 13d | 1 | 0.63mi |
| 3434 Midlawn Ave Jackson, MS | 4.0 | 2.0 | 1188 | $1,200 | $1.01 | 21d | 1 | 0.93mi |
| 3444 Martin Luther King Jr Dr Jackson, MS | 3.0 | 2.0 | 1200 | $1,100 | $0.92 | 43d | 1 | 1.02mi |
| 3380 Shady Oaks St Unit D Jackson, MS | 2.0 | 1.0 | 721 | $832 | $1.15 | 43d | 1 | 1.17mi |
| 3380 Shady Oaks St Jackson, MS | 2.0 | 1.0 | 721 | $871 | $1.21 | 13d | 1 | 1.17mi |
| 3380 Shady Oaks St Unit B Jackson, MS | 2.0 | 1.0 | 721 | $871 | $1.21 | 23d | 1 | 1.17mi |
| 2829 Comfort St Jackson, MS | 3.0 | 2.0 | 1260 | $1,250 | $0.99 | 13d | 1 | 1.27mi |
| 2829 Comfort St Jackson, MS | 3.0 | 1.5 | 1260 | $1,250 | $0.99 | 23d | 1 | 1.27mi |
| 1175 Eminence Row Jackson, MS | 2.0 | 1.0 | 700 | $650 | $0.93 | 43d | 1 | 1.31mi |
Listing history 7 events
-
2026-06-18days on market $15,000 Active 8 DOM
-
2026-06-17days on market $15,000 Active 7 DOM
-
2026-06-16days on market $15,000 Active 6 DOM
-
2026-06-15days on market $15,000 Active 5 DOM
-
2026-06-14days on market $15,000 Active 3 DOM
-
2026-06-13remarks 204-char remark
-
2026-06-13$15,000 Active 2 DOM
ⓘ Source: listings_history table (triggers on properties + properties_extension) + one-shot
backfill from property_details.listing_events for pre-trigger history.
Tax reassessment forecast MS · Resets to sale price
- Current annual tax
- $541 · $45/mo
- Projected year-2 tax
- $541 · $45/mo
- Expected delta
- $0/yr ($0/mo · 0.0%)
ⓘ Screening estimate from a state-policy table — verify with the county assessor before closing.
Climate risk First Street
- Flood 6/10 Major FEMA zone AE · 69% chance over 30 yrs
- Wildfire 1/10 Low
- Heat 7/10 Severe 7 d/yr ≥109°F today · 20 d/yr by 30 yrs out
- Wind 8/10 Severe 80% chance of damaging wind over 30 yrs
- Air quality 2/10 Low 0 unhealthy d/yr today · 1 by 30 yrs out
Nearby sold comps map
Loading sold comps map…
Walkable amenities ~0.75 mi
Loading nearby amenities…
Taxation est. · year 1
- Rental income
- $12,559
- − Mortgage interest
- −$840
- − Property taxes
- −$541
- − Insurance
- −$5,194
- − Repairs & maintenance
- −$1,005
- − Management
- −$1,005
- − Depreciation
- −$436
- Taxable income
- $3,539
- Est. tax owed @ 24.0%
- −$849
- After-tax cash flow
- $2,394/yr
For passive investors: Depreciation is non-cash, so a rental often shows a tax loss while cash-flowing — sheltering income. Rental losses are passive: they offset passive income freely, and up to $25,000/yr can offset ordinary (W-2) income if you actively participate and your MAGI is under $100k (phasing out to $0 by $150k); unused losses carry forward. On sale, claimed depreciation is recaptured at up to 25%, and gains may owe capital-gains tax (a 1031 exchange can defer both). Figures are a year-1 estimate at your 24.0% rate — not tax advice; consult a CPA.
Schools (NCES district)
- District
- Jackson Public School District
- NCES district ID
- 2802190
- Math proficiency
- 9% ▼ -14.00%
- Reading proficiency
- 18% ▼ -7.00%
- Median HH income
- $33,234
- Composite
- 10.89/100
- National rank
- #9755
- State rank
- #112 of 130 in MS
Livability — Jackson
- Score
- 68/100
- State rank
- #66
- US rank
- #9695
Category grades
Schools grade is shown separately in the Schools card above.
Census & demographics
- Census place
- Jackson, MS
- County
- Hinds County · 167,040 people
- City population
- 140,204
- Metro
- Jackson, MS
- Population (ZIP)
- 18,691
- Household income
- $29,541
- Rent vs Own
- Severe rent burden
- 1138.0
Population outlook (Hinds County) Hauer SSP2
- Today (2025)
- 242,528 people
- By 2030
- 241,113 · -0.6%
- By 2040
- 235,557 · -2.9%
- By 2050
- 226,946 · -6.4%
- By 2075
- 199,995 · -17.5%
- By 2100
- 164,165 · -32.3%
Race, ethnicity, and origin ACS 2023
- Neighborhood character
- Predominantly Black (95%)
- Race & ethnicity
- Black 95% White 2% Two or more races 1% Hispanic / Latino 1%
- Foreign-born
- 0% · Canada
- Languages at home
- 98% English-only · Spanish 2%
Political lean MEDSL · Hinds
- 2024 margin
- Solid D (+46.1) · D 72.4% · R 26.3% · Other 1.4%
- 2008→2024 swing
- +7.1pp toward D · 2008: 39.0pp · 2024: 46.1pp
- All cycles
- 2024: D+46.1 2020: D+48.3 2016: D+43.7 2012: D+45.1 2008: D+39.0
Not yet ingested
- Civics
- —
Market trends
- HPI YoY
- ▲ 21.42%
- Current HPI
- 329.1844
- Rent YoY
- —
- Metro
- Jackson, MS
- State GDP YoY
- —
- F500 in state
- 0
Price history
2 events — show timeline
- 2026-06-10 Listed $15,000 MLSU
- 1961-02-01 Sold (Public Records) — Public Records
Cash-flow waterfall
monthlySold comps — $/sqft
last 12 mo · ≤1 miLoading sold comps…