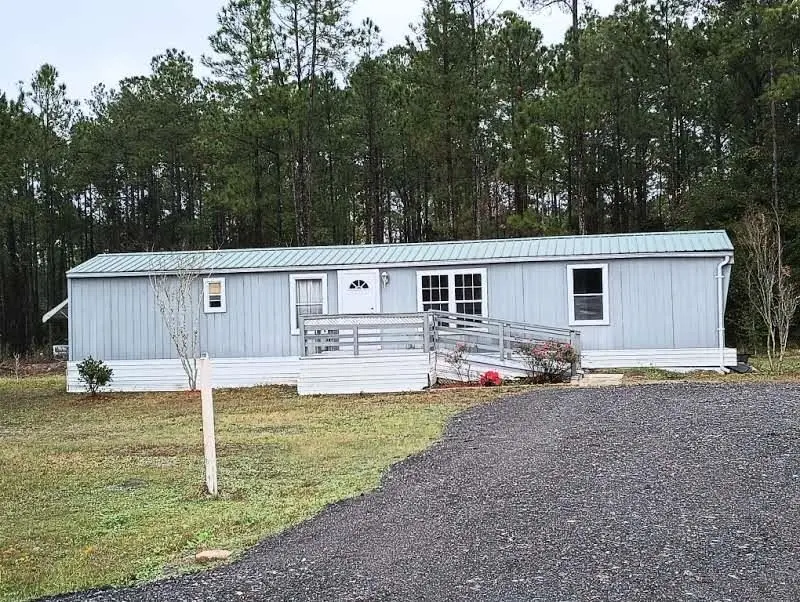
4010 Melanie St · Flagler Estates, FL
Flood risk 1/10 · Minimal
- FEMA flood zone
- X (unshaded)
- Chance of flooding over 30 yrs
- 0.0%
- Est. flood insurance / yr
- $507 – $1,088
Fire risk 4/10 · Minor
- Est. fire insurance / yr
- $947 – $1,759
Heat risk 9/10 · Severe
- Hot days now (above 107°F)
- 7 days/yr
- Hot days in 30 yrs
- 21 days/yr
Wind risk 9/10 · Severe
- Chance of severe wind over 30 yrs
- 99.0%
Air-quality risk 2/10 · Minimal
- Unhealthy air days now
- 1 days/yr
- Unhealthy air days in 30 yrs
- 1 days/yr
Risk factors via First Street. Map © Google.
Why this score? — see what drove the D grade
The composite is a weighted blend of 9 inputs, each scored 0–100. Each bar is that input's sub-score; the figure is the points it added to the 100-point composite (weight × sub-score).
- ARV discount +11.2/15.0
- Cash flow +9.3/30.0
- Schools +6.4/10.0
- Appreciation +5.0/10.0
- Livability +3.1/5.0
- DSCR +2.6/10.0
- Rent growth +2.5/5.0
- Condition / age +2.5/5.0
- 1% rule +2.2/10.0
$159,900
🖨 Deal sheet (PDF) 📄 Offer letter ✓ Due diligence
Listing remarks MLS
Fantastic opportunity for the cash buyer in Hastings. 3 Bedroom 1.5 bath singlewide mobile home-built year 1985, on 1.25 Acre lot. This property needs TLC but has the potential to make a great rental investment, winter getaway or for someone handy looking to live in rural St Johns County at an affordable price. Property features 10x10 front porch with ramp and a large 35x11 back deck, the back deck also features a washer/dryer shelter with hook ups. Subdivision is zoned for horses, Chickens, goats etc. No HOA, 20 minutes to St Augustine, Palatka, Palm Coast, shopping and beaches. This mobile home has been moved from its original location and is being offered for sale for cash only, sold as is, buyer responsible for due diligence, NO sight unseen offers accepted, all reasonable offers considered. Call and schedule your appointment today.
Key facts
- Zoned for goats
- Front porch
- Zoned for chickens
Tags
Neighborhood map
What this means for you Summary
Snapshot
- This is a 2-bed/2.0-bath manufactured listed at $160k.
Deal economics
- At list price, monthly cash flow is $-118 ($-1k/yr) — negative.
- To cash-flow at today's rent, offer at most $139k (13.1% below list).
- To meet the 1% rule (rent ≥ 1% of price), the offer needs to be $116k (27.7% below list).
- Recommended offer: $116k (27.7% below list) — sets the bar for 1% rule.
- Cap rate 5.4% vs local median 4.0% in Flagler Estates — top-decile yield for the area; either an underpriced asset or a hidden risk that comps aren't pricing in. Stress-test before assuming the spread holds.
Location & tenants
- Location reads 62/100 on livability (#763 in FL) — a middle-class / working-renter tenant base. Strengths: cost of living A+, housing A+, crime A-; Watch: health & safety C-, amenities F, commute F.
- St. Johns (rural): math 75% / reading 73% proficiency, ranked #2 of 73 in FL (top 3%) — strong family-tenant draw, lease renewals of 3-5y typical; only 20% free/reduced lunch — higher-income household profile.
- Zoned schools: South Woods Elementary School (math 51% / reading 46%, grade D, #1,152 of 2,144 statewide, top 55%, 689 students, 66% FRL); Gamble Rogers Middle School (math 61% / reading 55%, grade B, #151 of 571 statewide, top 27%, 925 students, 47% FRL); Pedro Menendez High School (math 31% / reading 54%, grade F, #264 of 667 statewide, top 41%, 1,519 students, 39% FRL) — zoned schools average 51% FRL vs 20% district-wide (31 pts higher); higher-poverty schools than district average — tighter screening recommended.
- Zoned-school proficiency averages 50% at this address vs 74% district-wide (-24 pts) — the specific schools serving this property underperform the St. Johns average; the district grade overstates school quality for this exact location.
- Market conditions: 7 active listings in the ZIP; 5,575 units permitted in St. Johns County in 2024 (584 in 5+ unit buildings).
Forward outlook
- In year one you build about $6k of equity ($1k loan paydown + $5k appreciation (3.0% local appreciation)).
- St. Johns County population projected at +60% by 2050 — long-run rental-demand tailwind backs the buy-and-hold thesis.
- By year 6, paydown + projected appreciation supports a ~$31k cash-out refi (75% LTV) — recoverable capital for the next deal without selling this one.
Negotiation context
- It's been on market 194 days — a 12% lower offer ($141k) is reasonable based on typical stale-listing flexibility.
- 4 sale attempts since 19y ago with the ask held roughly flat each time — persistent listings suggest the price (not the market) is what's stuck; bring a comps-based counter.
- Current owner paid $8k; list at $160k implies a 1899% gain — meaningful room to come down on a strong offer.
Risks & watch-outs
- Climate carrying-cost: severe wind risk, 99% chance of damaging wind over 30y; extreme-heat days projected 7→21/yr by 2055 (HVAC capex compounding) — expect insurance premiums to compound above CPI over the hold.
Questions for the listing agent
- What do current leases actually rent for vs. the listed asking? Can we see a recent rent roll and the last 12 months of T-12 income?
- It's been on market 194 days. Have you received any prior offers? Is the seller open to a 28% concession, seller financing, or rate buy-down credit?
- Why hasn't it sold? Are there any deal-killer items the seller is aware of (foundation, flood, title, zoning, code violations)?
- Is there a deadline driving the sale (1031 exchange, divorce, estate, relocation)? That informs how much negotiation room exists.
- Schools are F-rated, which usually means shorter tenancies and higher turnover. Who's the typical renter profile here, and what's been the actual vacancy rate?
- The area grade is low — what's the realistic commute time and amenity access for the typical tenant pool here? Any planned neighborhood developments (good or bad) we should know about?
- What's the average days-on-market for RENTAL listings here right now (not sales)? A rising rental-DOM trend means longer vacancies and softer asking-rent achievability than the comps imply.
- What's the recent tenant-quality profile in this submarket — average credit score on applications, eviction rate, late-payment / NSF rate, and stable-employment percentage? A property-management company in the area should have these aggregated.
- How much new for-sale + rental construction is in the pipeline within 1–3 miles? Heavy new supply typically softens prices + rents 12–24 months out; constrained supply supports both.
Investment metrics
- 1% rule
- 0.72% ✗
- Cap rate
- 5.41%
- Cash-on-cash
- -3.17%
- DSCR
- 0.86
- GRM
- 11.5
CMA / ARV
- ARV (median comp)
- $174,381
- List price
- $159,900
- Delta
- -8.30%
- Verdict
- FAIR
- Comps
- 1 within 2.0 mi
Show comp detail 3 sales within ~0.75 mi
| Address | Dist | Beds/Ba | Sqft | Sold | Price | $/sf | Match |
|---|---|---|---|---|---|---|---|
| 9870 Baylor Ave | 0.25mi | 2/2.0 | 924 (+10%) | 10mo | $175,875 | $190 | 63 |
| 9935 Baylor Ave | 0.15mi | 3/1.0 (+1) | 924 (+10%) | 14mo | $175,000 | $189 | 56 |
| 4215 Nancy St | 0.50mi | 3/2.0 (+1) | 960 (+14%) | 13mo | $193,000 | $201 | 37 |
Match score weights: distance 35% · size 25% · config 20% · recency 20%. Top-matched comps best support the ARV.
Projected returns pro-forma
3.0% appreciation · 3.0% rent growth · sell at horizon
- IRR
- 4.5%
- Equity multiple
- 1.26×
- Total profit
- $11,703
- Equity at exit
- $71,898
- IRR
- 7.7%
- Equity multiple
- 2.17×
- Total profit
- $52,205
- Equity at exit
- $110,803
Cash invested: $44,772 (down + closing). Projections, not guarantees.
Landlord ↔ Tenant lean methodology
- Overall (STATE)
- 87 Strongly Landlord-Friendly
- State Florida
- 87 Strongly Landlord-Friendly · R+3
- County
- — inherits STATE
- City
- — inherits STATE
ZIP-level market 32145-0000
- Active inventory
- 7
- Price-to-rent
- 11.5×
Monthly cashflow live
- Estimated rent
- $1,157 medium interval (Pro) →
- Mortgage (P&I)
- −$839
- Tax from tax record
- −$127 /mo · $1,522/yr
- Insurance
- −$67
- HOA
- −$0
- Vacancy / Maint / Mgmt
- −$243
- Net cashflow
- $-118
Break-even live
Sensitivity live
| Price | -10% $-28 | -5% $-73 | +0% $-118 | +5% $-164 | +10% $-209 |
|---|---|---|---|---|---|
| Rent | -10% $-210 | -5% $-164 | +0% $-118 | +5% $-73 | +10% $-27 |
| Rate | -1.0pp $-38 | -0.5pp $-78 | base $-118 | +0.5pp $-160 | +1.0pp $-202 |
UW: 25.0% down · 7.5% · 30yr · 1.5% tax · 5.0% vac · 8.0% maint · 8.0% mgmt
Financing live
Cash to close
- Down payment
- $39,975
- Closing costs
- $4,797
- Reserves months
- —
- Total cash needed
- —
Loan-product check · same deal, 3 products live
Conventional
25% down · 7.5% · 30yr
- Down + closing
- —
- Monthly P&I
- —
- Monthly cashflow
- —
- DSCR
- —
- Eligible?
- —
Personal DTI + credit; lowest rate.
DSCR
20% down · 8.5% · 30yr
- Down + closing
- —
- Monthly P&I
- —
- Monthly cashflow
- —
- DSCR
- —
- Eligible?
- —
No personal income docs; deal must DSCR.
Hard money
10% down · 12.0% · 12mo
- Down + closing
- —
- Monthly P&I
- —
- Monthly cashflow
- —
- DSCR
- —
- Eligible?
- —
Short-term bridge; refi at stabilization.
Listing history 22 events
-
2026-06-21days on market $159,900 Active 194 DOM
-
2026-06-18days on market $159,900 Active 191 DOM
-
2026-06-17days on market $159,900 Active 190 DOM
-
2026-06-16days on market $159,900 Active 189 DOM
-
2026-06-15days on market $159,900 Active 188 DOM
-
2026-06-13days on market $159,900 Active 186 DOM
-
2026-06-13days on market $159,900 Active 185 DOM
-
2026-06-10days on market $159,900 Active 182 DOM
-
2026-06-08days on market $159,900 Active 181 DOM
-
2026-06-07days on market $159,900 Active 180 DOM
-
2026-06-03days on market $159,900 Active 176 DOM
-
2026-06-02days on market $159,900 Active 175 DOM
-
2026-06-01days on market $159,900 Active 174 DOM
-
2026-05-31days on market $159,900 Active 173 DOM
-
2025-12-08$159,900 Active 848-char remark
Show marketing remark (848 chars)
Fantastic opportunity for the cash buyer in Hastings. 3 Bedroom 1.5 bath singlewide mobile home-built year 1985, on 1.25 Acre lot. This property needs TLC but has the potential to make a great rental investment, winter getaway or for someone handy looking to live in rural St Johns County at an affordable price. Property features 10x10 front porch with ramp and a large 35x11 back deck, the back deck also features a washer/dryer shelter with hook ups. Subdivision is zoned for horses, Chickens, goats etc. No HOA, 20 minutes to St Augustine, Palatka, Palm Coast, shopping and beaches. This mobile home has been moved from its original location and is being offered for sale for cash only, sold as is, buyer responsible for due diligence, NO sight unseen offers accepted, all reasonable offers considered. Call and schedule your appointment today.
-
2018-11-01historical
-
2018-05-02$80,000 Active
-
2014-02-28soldstatus $8,000
-
2014-02-26soldstatus $4,000
-
2013-11-01$5,000
-
2008-12-11historical
-
2007-12-11$30,000
ⓘ Source: listings_history table (triggers on properties + properties_extension) + one-shot
backfill from property_details.listing_events for pre-trigger history.
Tax reassessment forecast FL · Resets to sale price
- Current annual tax
- $1,522 · $127/mo
- Projected year-2 tax
- $1,522 · $127/mo
- Expected delta
- $0/yr ($0/mo · 0.0%)
ⓘ Screening estimate from a state-policy table — verify with the county assessor before closing.
Climate risk First Street
- Flood 1/10 Low FEMA zone X (unshaded) · 0% chance over 30 yrs
- Wildfire 4/10 Moderate
- Heat 9/10 Extreme 7 d/yr ≥107°F today · 21 d/yr by 30 yrs out
- Wind 9/10 Extreme 99% chance of damaging wind over 30 yrs
- Air quality 2/10 Low 1 unhealthy d/yr today · 1 by 30 yrs out
Nearby sold comps map
Loading sold comps map…
Walkable amenities ~0.75 mi
Loading nearby amenities…
Taxation est. · year 1
- Rental income
- $13,880
- − Mortgage interest
- −$8,957
- − Property taxes
- −$1,522
- − Insurance
- −$800
- − Repairs & maintenance
- −$1,110
- − Management
- −$1,110
- − Depreciation
- −$4,652
- Taxable loss
- −$4,271
- Est. tax savings @ 24.0%
- +$1,025
- After-tax cash flow
- $-394/yr
For passive investors: Depreciation is non-cash, so a rental often shows a tax loss while cash-flowing — sheltering income. Rental losses are passive: they offset passive income freely, and up to $25,000/yr can offset ordinary (W-2) income if you actively participate and your MAGI is under $100k (phasing out to $0 by $150k); unused losses carry forward. On sale, claimed depreciation is recaptured at up to 25%, and gains may owe capital-gains tax (a 1031 exchange can defer both). Figures are a year-1 estimate at your 24.0% rate — not tax advice; consult a CPA.
Schools (NCES district)
- District
- St. Johns
- NCES district ID
- 1201740
- Math proficiency
- 75% ▼ -5.00%
- Reading proficiency
- 73% ▼ -2.00%
- Median HH income
- $66,842
- Composite
- 64.31/100
- National rank
- #556
- State rank
- #2 of 73 in FL
Livability — Flagler Estates
- Score
- 62/100
- State rank
- #763
- US rank
- #16863
Category grades
Schools grade is shown separately in the Schools card above.
Census & demographics
- Census place
- Flagler Estates, FL
Population outlook (St. Johns County) Hauer SSP2
- Today (2025)
- 303,941 people
- By 2030
- 342,590 · +12.7%
- By 2040
- 417,328 · +37.3%
- By 2050
- 487,011 · +60.2%
- By 2075
- 635,395 · +109.1%
- By 2100
- 717,469 · +136.1%
Not yet ingested
- Political lean
- —
- Race & ethnicity
- —
- Common origin
- —
- Civics
- —
Market trends
- HPI YoY
- —
- Current HPI
- —
- Rent YoY
- —
- Metro
- —
- State GDP YoY
- ▲ 3.28%
- F500 in state
- 36
Industry mix (Fortune 500 HQ in FL)
| Industry | F500 HQs | Revenue |
|---|---|---|
| Industrial Technology | 2 | $29B |
|
||
| Insurance | 2 | $17B |
|
||
| Retail | 1 | $60B |
|
||
| Technology Distribution | 1 | $58B |
|
||
| Homebuilding | 1 | $35B |
|
||
| Technology Manufacturing | 1 | $35B |
|
||
Price history
+433.0% since first listed8 events — show timeline
- 2025-12-08 Listed $159,900 St. Augustine and St. Johns County Board of REALTORS®
- 2018-11-01 Listing Removed — Daytona MLS
- 2018-05-02 Listed $80,000 Daytona MLS
- 2014-02-28 Sold (Public Records) $8,000 Public Records
- 2014-02-26 Sold (MLS) $4,000 St. Augustine and St. Johns County Board of REALTORS®
- 2013-11-01 Listed $5,000 St. Augustine and St. Johns County Board of REALTORS®
- 2008-12-11 Listing Removed — realMLS
- 2007-12-11 Listed $30,000 realMLS
Property tax history
+16.6%/yrLatest (2025): $1,522 · +14.2% YoY. Source: county tax records.
Cash-flow waterfall
monthlySold comps — $/sqft
last 12 mo · ≤1 miLoading sold comps…