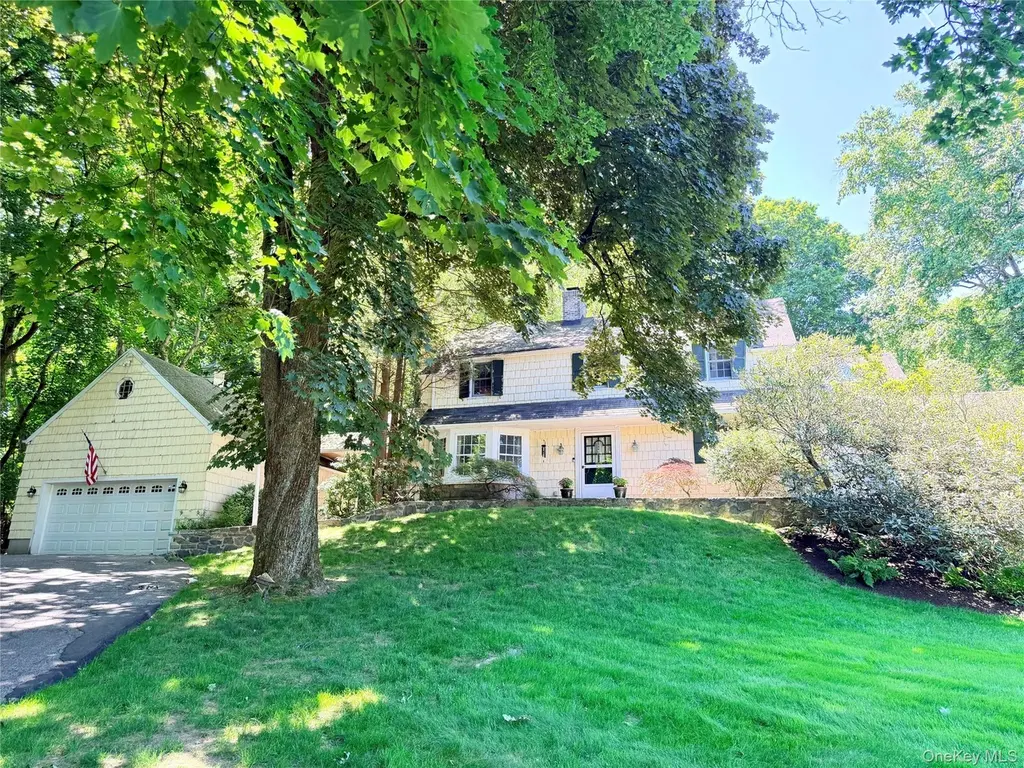
2 Turner Dr · Millwood, NY
Flood risk 1/10 · Minimal
- FEMA flood zone
- X (unshaded)
- Chance of flooding over 30 yrs
- 0.0%
- Est. flood insurance / yr
- $473 – $860
Fire risk 4/10 · Minor
- Est. fire insurance / yr
- $691 – $1,283
Heat risk 5/10 · Moderate
- Hot days now (above 99°F)
- 7 days/yr
- Hot days in 30 yrs
- 15 days/yr
Wind risk 5/10 · Moderate
- Chance of severe wind over 30 yrs
- 26.0%
Air-quality risk 4/10 · Minor
- Unhealthy air days now
- 4 days/yr
- Unhealthy air days in 30 yrs
- 5 days/yr
Risk factors via First Street. Map © Google.
Why this score? — see what drove the C+ grade
The composite is a weighted blend of 9 inputs, each scored 0–100. Each bar is that input's sub-score; the figure is the points it added to the 100-point composite (weight × sub-score).
- Cash flow +21.9/30.0
- ARV discount +11.3/15.0
- Schools +8.6/10.0
- DSCR +7.0/10.0
- 1% rule +6.4/10.0
- Rent growth +2.5/5.0
- Livability +2.5/5.0
- Condition / age +2.5/5.0
- Appreciation +0.0/10.0
$1,100,000
🖨 Deal sheet (PDF) 📄 Offer letter ✓ Due diligence
Listing remarks MLS
Charm, Charm, Charm!! Immaculate Updated 4/5 Br Colonial. Lush Landscaping, Perennial Gardens. New Garage With Great Storage Above. New Windows Upper Floor. Some Advanced Notice To Show Appreciated, Tenant Occupied.
Key facts
- 0.73 acre lot
- 2 garage spots
- Built 1934
Property features AI
Exterior
- Parking: Driveway; 2-car garage
- Utilities: Septic tank; Utilities: See remarks
- Home design: Single family residence
- Construction: Frame construction
- Exterior features: Frame construction; Not waterfront
Interior
- Kitchen: Gas cooktop; Gas oven; Dishwasher; Refrigerator; Stainless steel appliances
- Bedrooms: Includes a first-floor bedroom
- Bathrooms: Three full bathrooms
- Heating & cooling: Oil heating; Central air conditioning; One fireplace
- Interior features: First-floor bedroom and full bath; Built-in features; Cathedral ceilings; Ceiling fans; Formal dining room; His and hers closets; Natural woodwork; Primary bathroom; Master suite on main level; Storage space; Basement with storage
- Laundry & utility: Dryer
Neighborhood map
What this means for you Summary
Snapshot
- This is a 5-bed/3.5-bath single-family listed at $1.10M.
Deal economics
- At list price, monthly cash flow is $2k ($21k/yr) — positive.
- The deal already cash-flows at list — no discount required.
- Meets the 1% rule at list price ($12k rent vs $1.10M).
Location & tenants
- Location reads: area grade C — affects rentability + tenant quality, not the cash-flow math above.
- Chappaqua Central School District (suburban): math 81% / reading 88% proficiency, ranked #5 of 590 in NY (top 1%) — strong family-tenant draw, lease renewals of 3-5y typical; only 2% free/reduced lunch — higher-income household profile.
- Zoned schools: Westorchard School (math 82% / reading 87%, grade A+, #93 of 2,108 statewide, top 6%, 425 students, 4% FRL); Robert E Bell School (math 71% / reading 84%, grade A+, #39 of 729 statewide, top 5%, 594 students, 6% FRL); Horace Greeley High School (math 100% / reading 100%, grade A+, #1 of 1,100 statewide, top 0%, 1,152 students, 0% FRL) — zoned schools at 3% FRL track the district average.
- Market conditions: 75 active listings in the ZIP; 1 comparable units currently listed for rent nearby; 954 units permitted in Westchester County in 2024 (649 in 5+ unit buildings).
Forward outlook
- Local home prices are declining (-3.0%/yr); year-one equity from $8k of loan paydown is wiped out by about $33k of value loss. Plan a longer hold.
- Westchester County population projected at +10% by 2050 — modest demand growth; plan on rents tracking national, not racing it.
Negotiation context
- Only 10 days on market — expect competitive offers; lowballing is unlikely to land.
- Current owner paid $606k; list at $1.10M implies a 82% gain — meaningful room to come down on a strong offer.
Risks & watch-outs
- Watch-outs: built in 1934 — expect roof / HVAC / electrical / plumbing capex.
- Climate carrying-cost: moderate wind risk, 26% chance of damaging wind over 30y; extreme-heat days projected 7→15/yr by 2055 (HVAC capex compounding) — expect insurance premiums to compound above CPI over the hold.
Questions for the listing agent
- Built in 1934 — when were the roof, HVAC, electrical panel, plumbing, and water heater last replaced?
- Is there a deadline driving the sale (1031 exchange, divorce, estate, relocation)? That informs how much negotiation room exists.
- What's the average days-on-market for RENTAL listings here right now (not sales)? A rising rental-DOM trend means longer vacancies and softer asking-rent achievability than the comps imply.
- What's the recent tenant-quality profile in this submarket — average credit score on applications, eviction rate, late-payment / NSF rate, and stable-employment percentage? A property-management company in the area should have these aggregated.
- How much new for-sale + rental construction is in the pipeline within 1–3 miles? Heavy new supply typically softens prices + rents 12–24 months out; constrained supply supports both.
Investment metrics
- 1% rule
- 1.14% ✓
- Cap rate
- 8.19%
- Cash-on-cash
- 6.78%
- DSCR
- 1.30
- GRM
- 7.3
CMA / ARV
- ARV (on-the-fly)
- $1,200,030
- Comps found
- 5
Show comp detail 5 sales within ~0.75 mi
| Address | Dist | Beds/Ba | Sqft | Sold | Price | $/sf | Match |
|---|---|---|---|---|---|---|---|
| 341 Millwood Rd | 0.05mi | 4/2.5 (-1) | 2,541 (-6%) | 5mo | $1,375,000 | $541 | 74 |
| 9 Whitlaw Ln | 0.29mi | 4/2.5 (-1) | 2,932 (+8%) | 2mo | $1,655,800 | $565 | 63 |
| 508 Millwood Rd | 0.45mi | 4/3.0 (-1) | 2,940 (+8%) | 1mo | $1,300,000 | $442 | 58 |
| 20 High Meadows Rd | 0.59mi | 4/4.0 (-1) | 2,877 (+6%) | 16mo | $765,000 | $266 | 42 |
| 5 Longview Ln | 0.73mi | 4/3.0 (-1) | 3,016 (+11%) | 23mo | $1,289,000 | $427 | 21 |
Match score weights: distance 35% · size 25% · config 20% · recency 20%. Top-matched comps best support the ARV.
Projected returns pro-forma
-3.0% appreciation · 3.0% rent growth · sell at horizon
- IRR
- -5.8%
- Equity multiple
- 0.78×
- Total profit
- $-66,874
- Equity at exit
- $164,014
- IRR
- 3.9%
- Equity multiple
- 1.28×
- Total profit
- $86,610
- Equity at exit
- $95,108
Cash invested: $308,000 (down + closing). Projections, not guarantees.
Landlord ↔ Tenant lean methodology
- Overall (STATE)
- 15 Strongly Tenant-Friendly
- State New York
- 15 Strongly Tenant-Friendly · D+10
- County
- — inherits STATE
- City
- — inherits STATE
ZIP-level market 10514
- Active inventory
- 75
- Price-to-rent
- 7.3×
Monthly cashflow live
- Estimated rent
- $12,500 medium interval (Pro) →
- Mortgage (P&I)
- −$5,769
- Tax from tax record
- −$1,908 /mo · $22,891/yr
- Insurance
- −$458
- HOA
- −$0
- Vacancy / Maint / Mgmt
- −$2,625
- Net cashflow
- $1,741
Break-even live
Sensitivity live
| Price | -10% $2,363 | -5% $2,052 | +0% $1,741 | +5% $1,429 | +10% $1,118 |
|---|---|---|---|---|---|
| Rent | -10% $753 | -5% $1,247 | +0% $1,741 | +5% $2,234 | +10% $2,728 |
| Rate | -1.0pp $2,295 | -0.5pp $2,020 | base $1,741 | +0.5pp $1,456 | +1.0pp $1,166 |
UW: 25.0% down · 7.5% · 30yr · 1.5% tax · 5.0% vac · 8.0% maint · 8.0% mgmt
Financing live
Cash to close
- Down payment
- $275,000
- Closing costs
- $33,000
- Reserves months
- —
- Total cash needed
- —
Loan-product check · same deal, 3 products live
Conventional
25% down · 7.5% · 30yr
- Down + closing
- —
- Monthly P&I
- —
- Monthly cashflow
- —
- DSCR
- —
- Eligible?
- —
Personal DTI + credit; lowest rate.
DSCR
20% down · 8.5% · 30yr
- Down + closing
- —
- Monthly P&I
- —
- Monthly cashflow
- —
- DSCR
- —
- Eligible?
- —
No personal income docs; deal must DSCR.
Hard money
10% down · 12.0% · 12mo
- Down + closing
- —
- Monthly P&I
- —
- Monthly cashflow
- —
- DSCR
- —
- Eligible?
- —
Short-term bridge; refi at stabilization.
Rent comps 1 comps
| Address | Beds | Baths | Sqft | Rent | $/sqft | DOM | Units | Dist |
|---|---|---|---|---|---|---|---|---|
| 355 Crow Hill Rd Mount Kisco, NY | 4.0 | 2.0 | 3000 | $12,500 | $4.17 | 3d | 1 | 1.44mi |
Listing history 10 events
-
2026-06-18days on market $1,100,000 Active 10 DOM
-
2026-06-17days on market $1,100,000 Active 9 DOM
-
2026-06-16days on market $1,100,000 Active 8 DOM
-
2026-06-15days on market $1,100,000 Active 7 DOM
-
2026-06-13days on market $1,100,000 Active 5 DOM
-
2026-06-13days on market $1,100,000 Active 4 DOM
-
2026-06-09statusdays on market $1,100,000 Active 1 DOM
-
2026-06-08days on market $1,100,000 Coming Soon 2 DOM
-
2026-06-07remarks 699-char remark
-
2026-06-07$1,100,000 Coming Soon 1 DOM
ⓘ Source: listings_history table (triggers on properties + properties_extension) + one-shot
backfill from property_details.listing_events for pre-trigger history.
Tax reassessment forecast NY · Partial reset (capped growth)
- Current annual tax
- $22,891 · $1,908/mo
- Projected year-2 tax
- $22,891 · $1,908/mo
- Expected delta
- $0/yr ($0/mo · 0.0%)
ⓘ Screening estimate from a state-policy table — verify with the county assessor before closing.
Climate risk First Street
- Flood 1/10 Low FEMA zone X (unshaded) · 0% chance over 30 yrs
- Wildfire 4/10 Moderate
- Heat 5/10 Major 7 d/yr ≥99°F today · 15 d/yr by 30 yrs out
- Wind 5/10 Major 26% chance of damaging wind over 30 yrs
- Air quality 4/10 Moderate 4 unhealthy d/yr today · 5 by 30 yrs out
Nearby sold comps map
Loading sold comps map…
Walkable amenities ~0.75 mi
Loading nearby amenities…
Taxation est. · year 1
- Rental income
- $150,000
- − Mortgage interest
- −$61,617
- − Property taxes
- −$22,891
- − Insurance
- −$5,500
- − Repairs & maintenance
- −$12,000
- − Management
- −$12,000
- − Depreciation
- −$32,000
- Taxable income
- $3,992
- Est. tax owed @ 24.0%
- −$958
- After-tax cash flow
- $19,929/yr
For passive investors: Depreciation is non-cash, so a rental often shows a tax loss while cash-flowing — sheltering income. Rental losses are passive: they offset passive income freely, and up to $25,000/yr can offset ordinary (W-2) income if you actively participate and your MAGI is under $100k (phasing out to $0 by $150k); unused losses carry forward. On sale, claimed depreciation is recaptured at up to 25%, and gains may owe capital-gains tax (a 1031 exchange can defer both). Figures are a year-1 estimate at your 24.0% rate — not tax advice; consult a CPA.
Schools (NCES district)
- District
- Chappaqua Central School District
- NCES district ID
- 3606990
- Math proficiency
- 81% ▼ -7.00%
- Reading proficiency
- 88% ▲ 6.00%
- Median HH income
- $200,741
- Composite
- 85.78/100
- National rank
- #7
- State rank
- #5 of 590 in NY
Livability — Millwood
No livability data for this city. (Only ~50 U.S. cities are tracked.)
Census & demographics
- Population (ZIP)
- 12,227
Population outlook (Westchester County) Hauer SSP2
- Today (2025)
- 1,028,035 people
- By 2030
- 1,051,636 · +2.3%
- By 2040
- 1,098,520 · +6.9%
- By 2050
- 1,136,044 · +10.5%
- By 2075
- 1,196,925 · +16.4%
- By 2100
- 1,175,147 · +14.3%
Race, ethnicity, and origin ACS 2023
- Neighborhood character
- Predominantly White (69%)
- Race & ethnicity
- White 69% Asian 13% Two or more races 9% Hispanic / Latino 9% Black 4%
- Hispanic origin (detail)
- Dominican 3%
- Common ancestry
- Italian 4% Romanian 3% Scotch-Irish 3%
- Foreign-born
- 15% · Canada, China, South Korea
- Languages at home
- 85% English-only · Other Indo-European 6% Chinese 3% Spanish 3%
Political lean MEDSL · Westchester
- 2024 margin
- Strong D (+26.3) · D 63.1% · R 36.9%
- 2008→2024 swing
- -1.3pp toward R · 2008: 27.6pp · 2024: 26.3pp
- All cycles
- 2024: D+26.3 2020: D+36.3 2016: D+32.8 2012: D+22.2 2008: D+27.6
Not yet ingested
- Civics
- —
Market trends
- HPI YoY
- ▼ -633.91%
- Current HPI
- 251.9894
- Rent YoY
- —
- Metro
- —
- State GDP YoY
- ▲ 2.60%
- F500 in state
- 92
Industry mix (Fortune 500 HQ in NY)
| Industry | F500 HQs | Revenue |
|---|---|---|
| Financial Services | 10 | $950B |
|
||
| Consumer Goods | 9 | $162B |
|
||
| Insurance | 4 | $225B |
|
||
| Telecommunications | 2 | $144B |
|
||
| Pharmaceuticals | 2 | $112B |
|
||
| Media / Entertainment | 2 | $69B |
|
||
Price history
+182.1% since first listed7 events — show timeline
- 2026-06-06 Coming Soon $1,100,000 OneKey® MLS as Distributed by MLS Grid
- 2000-09-27 Sold (Public Records) $605,500 Public Records
- 2000-08-07 Sold (MLS) $605,500 HGMLS
- 2000-05-23 Price Changed $611,000 HGMLS
- 2000-05-23 Delisted — HGMLS
- 2000-02-28 Listed $605,500 HGMLS
- 1989-01-19 Sold (Public Records) $390,000 Public Records
Property tax history
+2.0%/yrLatest (2025): $22,891 · +2.0% YoY. Source: county tax records.
Cash-flow waterfall
monthlySold comps — $/sqft
last 12 mo · ≤1 miLoading sold comps…