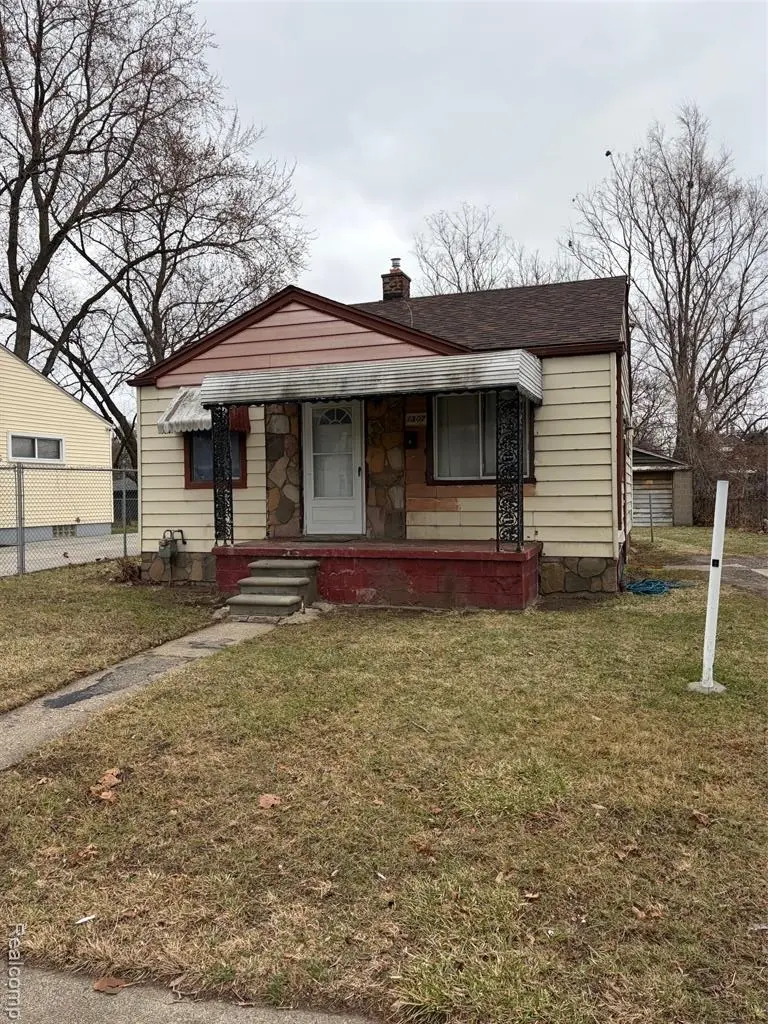
1307 S Bassett St · Detroit, MI
Flood risk 9/10 · Severe
- FEMA flood zone
- X (unshaded)
- Chance of flooding over 30 yrs
- 0.99%
- Est. flood insurance / yr
- $473 – $860
Fire risk 1/10 · Minimal
- Est. fire insurance / yr
- $784 – $1,456
Heat risk 3/10 · Minor
- Hot days now (above 96°F)
- 7 days/yr
- Hot days in 30 yrs
- 15 days/yr
Wind risk 2/10 · Minimal
- Chance of severe wind over 30 yrs
- —
Air-quality risk 4/10 · Minor
- Unhealthy air days now
- 6 days/yr
- Unhealthy air days in 30 yrs
- 8 days/yr
Risk factors via First Street. Map © Google.
Why this score? — see what drove the A- grade
The composite is a weighted blend of 9 inputs, each scored 0–100. Each bar is that input's sub-score; the figure is the points it added to the 100-point composite (weight × sub-score).
- Cash flow +30.0/30.0
- ARV discount +15.0/15.0
- 1% rule +10.0/10.0
- DSCR +10.0/10.0
- Appreciation +5.1/10.0
- Livability +3.7/5.0
- Rent growth +2.5/5.0
- Condition / age +2.5/5.0
- Schools +1.3/10.0
$44,900
🖨 Deal sheet (PDF) 📄 Offer letter ✓ Due diligence
Listing remarks MLS
Investment Opportunity! Two bedroom ranch located on the border of River Rouge near schools, transportation and shopping. Great starter home potential. Updated kitchen and bath, new roof last year, partial window replacement.
Key facts
- Updated bath
- Updated kitchen
- New roof
Tags
Neighborhood map
What this means for you Summary
Snapshot
- This is a 2-bed/1.0-bath single-family listed at $45k.
Deal economics
- At list price, monthly cash flow is $359 ($4k/yr) — positive.
- The deal already cash-flows at list — no discount required.
- Meets the 1% rule at list price ($933 rent vs $45k).
- Cap rate 17.4% vs local median 10.0% in Detroit — top-decile yield for the area; either an underpriced asset or a hidden risk that comps aren't pricing in. Stress-test before assuming the spread holds.
Location & tenants
- Location reads 73/100 on livability (#218 in MI) — a middle-class / working-renter tenant base. Strengths: amenities A+, commute A+, cost of living A+; Watch: schools F, crime F, employment F.
- Detroit Public Schools Community District (urban): math 10% / reading 24% proficiency, ranked #499 of 540 in MI (top 92%) — low school quality limits family demand, transient renter base, plan for 1-2y turnover; 90% free/reduced lunch — lower-income household profile, screen leases tightly.
- Market conditions: 26 active listings in the ZIP; 2 comparable units currently listed for rent nearby; 2,639 units permitted in Wayne County in 2024 (1,216 in 5+ unit buildings).
Forward outlook
- In year one you build about $359 of equity ($310 loan paydown + $49 appreciation (0.1% local appreciation)).
- Wayne County population projected at -17% by 2050 — secular population decline; favor cash flow + early exit over multi-decade hold.
- At projected returns (0.1% appreciation + 3.0% rent growth), your $13k cash investment doubles in ~3 years — after that, you're playing with house money.
Negotiation context
- Only 13 days on market — expect competitive offers; lowballing is unlikely to land.
- 8 sale attempts since 19y ago with the ask held roughly flat each time — persistent listings suggest the price (not the market) is what's stuck; bring a comps-based counter.
- Current owner paid $4k; list at $45k implies a 1183% gain — meaningful room to come down on a strong offer.
Risks & watch-outs
- Watch-outs: flood insurance adds $56/mo; built in 1953 — expect roof / HVAC / electrical / plumbing capex.
- Climate carrying-cost: severe flood risk — expect insurance premiums to compound above CPI over the hold.
Questions for the listing agent
- Built in 1953 — when were the roof, HVAC, electrical panel, plumbing, and water heater last replaced?
- What's the actual annual flood-insurance premium (NFIP or private), and is the property in a SFHA with mandatory coverage?
- Is there a deadline driving the sale (1031 exchange, divorce, estate, relocation)? That informs how much negotiation room exists.
- Schools are F-rated, which usually means shorter tenancies and higher turnover. Who's the typical renter profile here, and what's been the actual vacancy rate?
- Crime grade is F in this area — have there been break-ins, vandalism, or insurance claims at this property in the last 3 years? What carrier currently insures it and at what premium?
- What's the average days-on-market for RENTAL listings here right now (not sales)? A rising rental-DOM trend means longer vacancies and softer asking-rent achievability than the comps imply.
- What's the recent tenant-quality profile in this submarket — average credit score on applications, eviction rate, late-payment / NSF rate, and stable-employment percentage? A property-management company in the area should have these aggregated.
- How much new for-sale + rental construction is in the pipeline within 1–3 miles? Heavy new supply typically softens prices + rents 12–24 months out; constrained supply supports both.
Investment metrics
- 1% rule
- 2.08% ✓
- Cap rate
- 17.38%
- Cash-on-cash
- 39.61%
- DSCR
- 2.76
- GRM
- 4.0
CMA / ARV
- ARV (on-the-fly)
- $54,720
- Comps found
- 8
Show comp detail 8 sales within ~0.75 mi
| Address | Dist | Beds/Ba | Sqft | Sold | Price | $/sf | Match |
|---|---|---|---|---|---|---|---|
| 1436 S Deacon St | 0.17mi | 2/1.0 | 759 (+5%) | 18mo | $45,000 | $59 | 68 |
| 151 Dwight St | 0.36mi | 2/1.0 | 738 (+2%) | 14mo | $40,000 | $54 | 67 |
| 150 Division St | 0.42mi | 2/1.0 | 792 (+10%) | 9mo | $59,800 | $76 | 56 |
| 46 E James St | 0.69mi | 2/1.0 | 720 (0%) | 14mo | $21,000 | $29 | 56 |
| 1512 S Annabelle St | 0.30mi | 3/1.5 (+1) | 744 (+3%) | 22mo | $43,500 | $58 | 55 |
| 1555 S Bassett St | 0.13mi | 3/1.5 (+1) | 826 (+15%) | 19mo | $73,500 | $89 | 46 |
| 2241 S Beatrice St | 0.66mi | 2/1.0 | 786 (+9%) | 13mo | $70,000 | $89 | 43 |
| 48 E James St | 0.70mi | 3/1.0 (+1) | 784 (+9%) | 10mo | $90,000 | $115 | 39 |
Match score weights: distance 35% · size 25% · config 20% · recency 20%. Top-matched comps best support the ARV.
Projected returns pro-forma
0.11% appreciation · 3.0% rent growth · sell at horizon
- IRR
- 35.3%
- Equity multiple
- 2.74×
- Total profit
- $21,864
- Equity at exit
- $13,281
- IRR
- 38.5%
- Equity multiple
- 5.37×
- Total profit
- $54,893
- Equity at exit
- $16,161
Cash invested: $12,572 (down + closing). Projections, not guarantees.
Landlord ↔ Tenant lean methodology
- Overall (STATE)
- 62 Landlord-Friendly
- State Michigan
- 62 Landlord-Friendly · EVEN
- County
- — inherits STATE
- City
- — inherits STATE
ZIP-level market 48217
- Home prices YoY
- 0.0%
- Active inventory
- 26
- Price-to-rent
- 4.0×
Monthly cashflow live
- Estimated rent
- $933 medium interval (Pro) →
- Mortgage (P&I)
- −$235
- Tax from tax record
- −$68 /mo · $819/yr
- Insurance
- −$19
- Flood insurance flood zone
- −$56 /mo · $666/yr
- HOA
- −$0
- Vacancy / Maint / Mgmt
- −$196
- Net cashflow
- $359
Break-even live
Sensitivity live
| Price | -10% $385 | -5% $372 | +0% $359 | +5% $347 | +10% $334 |
|---|---|---|---|---|---|
| Rent | -10% $286 | -5% $323 | +0% $359 | +5% $396 | +10% $433 |
| Rate | -1.0pp $382 | -0.5pp $371 | base $359 | +0.5pp $348 | +1.0pp $336 |
UW: 25.0% down · 7.5% · 30yr · 1.5% tax · 5.0% vac · 8.0% maint · 8.0% mgmt
Financing live
Cash to close
- Down payment
- $11,225
- Closing costs
- $1,347
- Reserves months
- —
- Total cash needed
- —
Loan-product check · same deal, 3 products live
Conventional
25% down · 7.5% · 30yr
- Down + closing
- —
- Monthly P&I
- —
- Monthly cashflow
- —
- DSCR
- —
- Eligible?
- —
Personal DTI + credit; lowest rate.
DSCR
20% down · 8.5% · 30yr
- Down + closing
- —
- Monthly P&I
- —
- Monthly cashflow
- —
- DSCR
- —
- Eligible?
- —
No personal income docs; deal must DSCR.
Hard money
10% down · 12.0% · 12mo
- Down + closing
- —
- Monthly P&I
- —
- Monthly cashflow
- —
- DSCR
- —
- Eligible?
- —
Short-term bridge; refi at stabilization.
Rent comps 2 comps
| Address | Beds | Baths | Sqft | Rent | $/sqft | DOM | Units | Dist |
|---|---|---|---|---|---|---|---|---|
| 3748 15th St Ecorse, MI | 2.0 | 1.0 | 528 | $1,099 | $2.08 | 18d | 1 | 1.10mi |
| 88 Hill St Unit 2 River Rouge, MI | 1.0 | 1.0 | 700 | $800 | $1.14 | 25d | 1 | 1.18mi |
Listing history 24 events
-
2026-04-01status Pending 225-char remark
Show marketing remark (225 chars)
Investment Opportunity! Two bedroom ranch located on the border of River Rouge near schools, transportation and shopping. Great starter home potential. Updated kitchen and bath, new roof last year, partial window replacement.
-
2026-04-01status Pending
Show marketing remark (225 chars)
Investment Opportunity! Two bedroom ranch located on the border of River Rouge near schools, transportation and shopping. Great starter home potential. Updated kitchen and bath, new roof last year, partial window replacement.
-
2026-03-18$44,900 Active
Show marketing remark (225 chars)
Investment Opportunity! Two bedroom ranch located on the border of River Rouge near schools, transportation and shopping. Great starter home potential. Updated kitchen and bath, new roof last year, partial window replacement.
-
2026-03-18$44,900 Active 225-char remark
Show marketing remark (225 chars)
Investment Opportunity! Two bedroom ranch located on the border of River Rouge near schools, transportation and shopping. Great starter home potential. Updated kitchen and bath, new roof last year, partial window replacement.
-
2018-11-24historical
-
2018-07-26status Pending
-
2018-07-26status Pending
-
2018-07-26historical
-
2018-06-06price $8,900
-
2018-06-06price $8,900
-
2018-05-30price $11,900
-
2018-05-30price $11,900
-
2018-04-23$15,000 Active
-
2018-04-23$15,000 Active
-
2008-02-20soldstatus $3,500
-
2008-02-20soldstatus $3,500
-
2008-02-14historical
-
2007-10-16$3,500
-
2007-10-16$3,500
-
2007-10-16$6,450
-
2007-10-16historical
-
2007-10-16historical
-
2007-07-30$7,150
-
2003-11-14soldstatus $60,000
ⓘ Source: listings_history table (triggers on properties + properties_extension) + one-shot
backfill from property_details.listing_events for pre-trigger history.
Tax reassessment forecast MI · Partial reset (capped growth)
- Current annual tax
- $819 · $68/mo
- Projected year-2 tax
- $819 · $68/mo
- Expected delta
- $0/yr ($0/mo · 0.0%)
ⓘ Screening estimate from a state-policy table — verify with the county assessor before closing.
Climate risk First Street
- Flood 9/10 Extreme FEMA zone X (unshaded) · 99% chance over 30 yrs
- Wildfire 1/10 Low
- Heat 3/10 Moderate 7 d/yr ≥96°F today · 15 d/yr by 30 yrs out
- Wind 2/10 Low
- Air quality 4/10 Moderate 6 unhealthy d/yr today · 8 by 30 yrs out
Nearby sold comps map
Loading sold comps map…
Walkable amenities ~0.75 mi
Loading nearby amenities…
Taxation est. · year 1
- Rental income
- $11,201
- − Mortgage interest
- −$2,515
- − Property taxes
- −$819
- − Insurance
- −$891
- − Repairs & maintenance
- −$896
- − Management
- −$896
- − Depreciation
- −$1,306
- Taxable income
- $3,877
- Est. tax owed @ 24.0%
- −$931
- After-tax cash flow
- $3,383/yr
For passive investors: Depreciation is non-cash, so a rental often shows a tax loss while cash-flowing — sheltering income. Rental losses are passive: they offset passive income freely, and up to $25,000/yr can offset ordinary (W-2) income if you actively participate and your MAGI is under $100k (phasing out to $0 by $150k); unused losses carry forward. On sale, claimed depreciation is recaptured at up to 25%, and gains may owe capital-gains tax (a 1031 exchange can defer both). Figures are a year-1 estimate at your 24.0% rate — not tax advice; consult a CPA.
Schools (NCES district)
- District
- Detroit Public Schools Community District
- NCES district ID
- 2601103
- Math proficiency
- 10% ▼ -2.00%
- Reading proficiency
- 24% ▲ 6.00%
- Median HH income
- $25,815
- Composite
- 13.06/100
- National rank
- #9564
- State rank
- #499 of 540 in MI
Livability — Detroit
- Score
- 73/100
- State rank
- #218
- US rank
- #5427
Category grades
Schools grade is shown separately in the Schools card above.
Census & demographics
- Census place
- Detroit, MI
- City population
- 572,865
- Population (ZIP)
- 6,437
Population outlook (Wayne County) Hauer SSP2
- Today (2025)
- 1,675,273 people
- By 2030
- 1,620,300 · -3.3%
- By 2040
- 1,502,341 · -10.3%
- By 2050
- 1,384,039 · -17.4%
- By 2075
- 1,124,592 · -32.9%
- By 2100
- 881,193 · -47.4%
Race, ethnicity, and origin ACS 2023
- Neighborhood character
- Predominantly Black (78%)
- Race & ethnicity
- Black 78% Hispanic / Latino 12% Two or more races 10% White 4%
- Hispanic origin (detail)
- Mexican 5% Dominican 4%
- Common ancestry
- Lithuanian 6% Romanian 1%
- Foreign-born
- 3% · Canada
- Languages at home
- 94% English-only · Spanish 6%
Political lean MEDSL · Wayne
- 2024 margin
- Strong D (+29.0) · D 62.7% · R 33.7% · Other 3.6%
- 2008→2024 swing
- -20.5pp toward R · 2008: 49.5pp · 2024: 29.0pp
- All cycles
- 2024: D+29.0 2020: D+38.1 2016: D+37.3 2012: D+46.9 2008: D+49.5
Not yet ingested
- Civics
- —
Market trends
- HPI YoY
- ▲ 0.11%
- Current HPI
- 366.479
- Rent YoY
- —
- Metro
- —
- State GDP YoY
- ▲ 1.37%
- F500 in state
- 28
Industry mix (Fortune 500 HQ in MI)
| Industry | F500 HQs | Revenue |
|---|---|---|
| Automotive Parts | 3 | $48B |
|
||
| Automotive | 2 | $372B |
|
||
| Chemicals | 1 | $45B |
|
||
| Automotive Retail | 1 | $29B |
|
||
| Healthcare / Medical Devices | 1 | $23B |
|
||
| Automotive Technology | 1 | $20B |
|
||
Price history
-25.2% since first listed24 events — show timeline
- 2026-04-01 Pending — MiRealSource-MiMLS
- 2026-04-01 Pending — REALCOMP
- 2026-03-18 Listed $44,900 REALCOMP
- 2026-03-18 Listed $44,900 MiRealSource-MiMLS
- 2018-11-24 Listing Removed — REALCOMP
- 2018-07-26 Pending — MiRealSource-MiMLS
- 2018-07-26 Pending — REALCOMP
- 2018-07-26 Listing Removed — MiRealSource-MiMLS
- 2018-06-06 Price Changed $8,900 MiRealSource-MiMLS
- 2018-06-06 Price Changed $8,900 REALCOMP
- 2018-05-30 Price Changed $11,900 MiRealSource-MiMLS
- 2018-05-30 Price Changed $11,900 REALCOMP
- 2018-04-23 Listed $15,000 MiRealSource-MiMLS
- 2018-04-23 Listed $15,000 REALCOMP
- 2008-02-20 Sold (MLS) $3,500 REALCOMP
- 2008-02-20 Sold (MLS) $3,500 MiRealSource-MiMLS
- 2008-02-14 Listing Removed — MiRealSource-MiMLS
- 2007-10-16 Listing Removed — REALCOMP
- 2007-10-16 Listing Removed — MiRealSource-MiMLS
- 2007-10-16 Listed $6,450 MiRealSource-MiMLS
- 2007-10-16 Listed $3,500 REALCOMP
- 2007-10-16 Listed $3,500 MiRealSource-MiMLS
- 2007-07-30 Listed $7,150 REALCOMP
- 2003-11-14 Sold (Public Records) $60,000 Public Records
Property tax history
-3.7%/yrLatest (2025): $819 · -11.1% YoY. Source: county tax records.
Cash-flow waterfall
monthlySold comps — $/sqft
last 12 mo · ≤1 miLoading sold comps…