64625 Pierson Blvd Blvd Unit G11 · Cabazon, CA
Flood risk 1/10 · Minimal
- FEMA flood zone
- AO
- Chance of flooding over 30 yrs
- 0.0%
- Est. flood insurance / yr
- $848 – $2,087
Fire risk 6/10 · Moderate
- Est. fire insurance / yr
- $659 – $1,223
Heat risk 8/10 · Major
- Hot days now (above 110°F)
- 5 days/yr
- Hot days in 30 yrs
- 13 days/yr
Wind risk 1/10 · Minimal
- Chance of severe wind over 30 yrs
- —
Air-quality risk 5/10 · Moderate
- Unhealthy air days now
- 7 days/yr
- Unhealthy air days in 30 yrs
- 10 days/yr
Risk factors via First Street. Map © Google.
Why this score? — see what drove the C+ grade
The composite is a weighted blend of 9 inputs, each scored 0–100. Each bar is that input's sub-score; the figure is the points it added to the 100-point composite (weight × sub-score).
- Cash flow +28.4/30.0
- DSCR +10.0/10.0
- 1% rule +7.8/10.0
- Appreciation +6.6/10.0
- Schools +2.7/10.0
- Livability +2.7/5.0
- Rent growth +2.5/5.0
- Condition / age +2.2/5.0
- ARV discount +0.0/15.0
$149,000
🖨 Deal sheet 📄 Offer letter ✓ Due diligence
Listing remarks
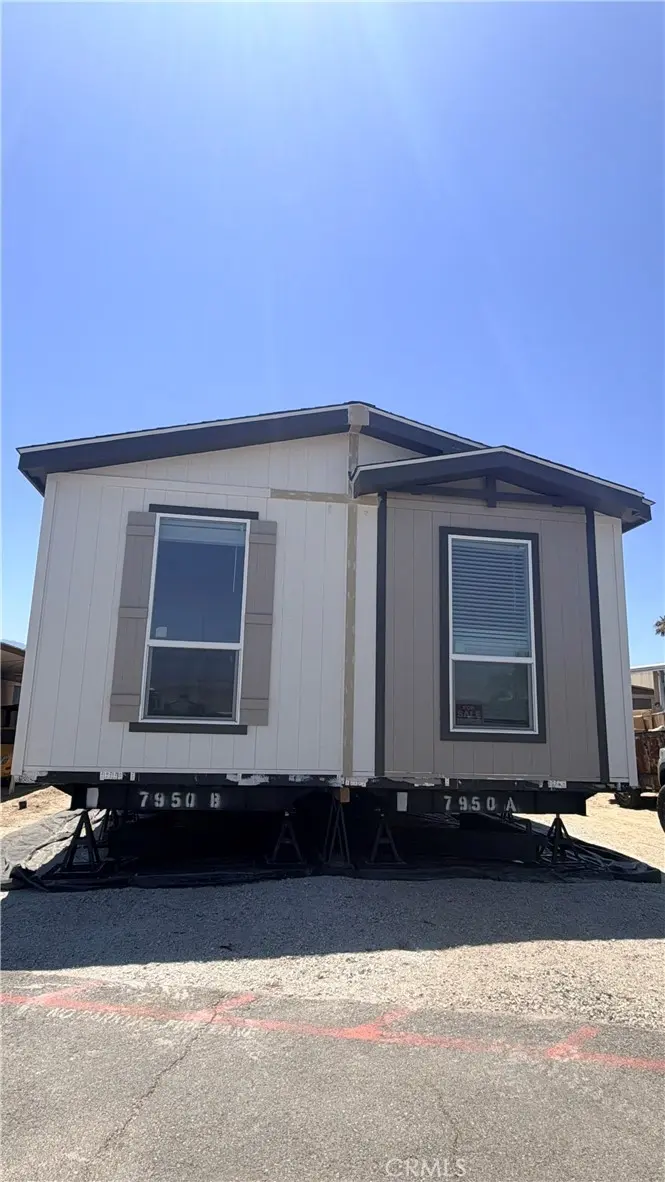
3-bedroom, 2-bathroom double-wide located on Lot G-11 in Park West Mobile Home Park, Desert Hot Springs. This spacious 944 sq ft home showcases an open-concept great room design with a large island kitchen, and generous cabinet storage. The primary suite includes stainless-steel appliances, dedicated laundry area and a carport. Park West Mobile Home Park is an all-ages community featuring resort-style amenities such as a heated pool, spa, clubhouse, playground, basketball court, and on-site management. Home currently setup. Contact for space rent per month. Approval required through community management prior to occupancy.
Key facts
- Large island kitchen
- Carport
- Heated pool
Tags
Property features AI
Finance
- Other: Pets allowed (size limit; dogs and cats allowed; number limit); Located in a valley/mountainous urban area with street lighting
- HOA & community: Park West Mobile Home Park; Association amenities include pool, spa, clubhouse, playground, pet rules, and grounds maintenance; Land lease (park) with $800 monthly land lease; Rent includes pool
Exterior
- Parking: Attached garage; Carport; Driveway parking; Total 2 parking spaces (1 garage, 1 carport/covered); Additional parking space
- Security: Resident manager
- Utilities: District/public water; Public sewer; Natural gas connected; Electricity connected; Water connected; Sewer connected
- Home design: Single-story (1 story); Mobile home model 'Harmony' (mobile home remains); Entry at front entrance; Access via city streets
- Construction: Concrete block foundation; Solar energy generation; Energy-efficient insulation and construction
- Exterior features: Community pool; Community spa; Paved lot; Has view
Interior
- Kitchen: Kitchen open to family room; Kitchen island; Quartz counters; Walk-In Pantry; Energy Star appliances; Gas cooktop; Gas range; Gas oven; Microwave; Refrigerator; Freezer; Dishwasher; Water heater unit
- Bedrooms: Primary bedroom with walk-in closet
- Flooring: Vinyl flooring
- Bathrooms: Two full bathrooms; Tile counters; Shower in tub; Walk-in shower
- Heating & cooling: Central heating (central furnace); Central cooling; Energy Star HVAC
- Interior features: Quartz counters; Pantry; Recessed lighting; Open floor plan; Energy Star doors; Energy Star windows; Walk-In Pantry; Walk-In Closet; Laundry; Family Room; Primary Bathroom; One-level home; Front entrance; Community spa; Resident manager
- Laundry & utility: Gas and electric dryer hookup; Washer/dryer hookups available
Neighborhood map
What this means for you Summary
Snapshot
- This is a 3-bed/2.0-bath manufactured listed at $149k. Condition is rated fair.
Deal economics
- At list price, monthly cash flow is $360 ($4k/yr) — positive.
- The deal already cash-flows at list — no discount required.
- Meets the 1% rule at list price ($2k rent vs $149k).
- Recommended offer: $147k (1.5% below list) — sets the bar for market timing.
Location & tenants
- Location reads 53/100 on livability (#926 in CA) — a working-class tenant base; expect higher turnover. Strengths: housing A+, crime B; Watch: cost of living D+, employment D, schools F.
- Palm Springs Unified (suburban): math 21% / reading 42% proficiency, ranked #328 of 517 in CA (top 63%) — families likely to look elsewhere, expect single-tenant / working-renter base with shorter leases; 73% free/reduced lunch — lower-income household profile, screen leases tightly.
- Market conditions: 67 active listings in the ZIP; 2 comparable units currently listed for rent nearby; 9,195 units permitted in Riverside County in 2024 (1,512 in 5+ unit buildings).
Forward outlook
- In year one you build about $6k of equity ($1k loan paydown + $5k appreciation (3.2% local appreciation)).
- Riverside County population projected at +22% by 2050 — long-run rental-demand tailwind backs the buy-and-hold thesis.
- At projected returns (3.2% appreciation + 3.0% rent growth), your $42k cash investment doubles in ~4 years — after that, you're playing with house money.
- By year 6, paydown + projected appreciation supports a ~$31k cash-out refi (75% LTV) — recoverable capital for the next deal without selling this one.
Negotiation context
- It's been on market 30 days — a 2% lower offer ($147k) is reasonable based on typical stale-listing flexibility.
Risks & watch-outs
- Watch-outs: flood insurance adds $122/mo.
- Climate carrying-cost: in FEMA flood zone AO (mandatory federal flood insurance); major wildfire risk; extreme-heat days projected 5→13/yr by 2055 (HVAC capex compounding) — expect insurance premiums to compound above CPI over the hold.
Questions for the listing agent
- Have any recent inspections been done? Can we get a copy of the seller's disclosures and any deferred-maintenance estimates?
- What's the actual annual flood-insurance premium (NFIP or private), and is the property in a SFHA with mandatory coverage?
- Is there a deadline driving the sale (1031 exchange, divorce, estate, relocation)? That informs how much negotiation room exists.
- Schools are F-rated, which usually means shorter tenancies and higher turnover. Who's the typical renter profile here, and what's been the actual vacancy rate?
- What's the average days-on-market for RENTAL listings here right now (not sales)? A rising rental-DOM trend means longer vacancies and softer asking-rent achievability than the comps imply.
- What's the recent tenant-quality profile in this submarket — average credit score on applications, eviction rate, late-payment / NSF rate, and stable-employment percentage? A property-management company in the area should have these aggregated.
- How much new for-sale + rental construction is in the pipeline within 1–3 miles? Heavy new supply typically softens prices + rents 12–24 months out; constrained supply supports both.
Investment metrics
- 1% rule
- 1.28% ✓
- Cap rate
- 10.18%
- Cash-on-cash
- 13.87%
- DSCR
- 1.62
- GRM
- 6.5
CMA / ARV
- ARV (on-the-fly)
- $108,560
- Comps found
- 6
Show comp detail 6 sales within ~0.75 mi
| Address | Dist | Beds/Ba | Sqft | Sold | Price | $/sf | Match |
|---|---|---|---|---|---|---|---|
| 64625 Pierson Blvd Blvd Unit A10 | 0.00mi | 3/2.0 | 944 (0%) | 2mo | $109,000 | $115 | 99 |
| 64625 Pierson Blvd Unit F4 | 0.13mi | 2/2.0 (-1) | 938 (-1%) | 8mo | $100,000 | $107 | 81 |
| 64625 Pierson Blvd Unit B5 | 0.00mi | 3/2.0 | 840 (-11%) | 2mo | $109,000 | $130 | 80 |
| 64625 Pierson Blvd Unit E11 | 0.09mi | 2/2.0 (-1) | 1,030 (+9%) | 7mo | $65,000 | $63 | 70 |
| 64625 Pierson Blvd Unit A8 | 0.13mi | 3/2.0 | 840 (-11%) | 9mo | $109,000 | $130 | 68 |
| 64550 Pierson Blvd #12 | 0.25mi | 3/2.0 | 1,060 (+12%) | 8mo | $83,000 | $78 | 61 |
Match score weights: distance 35% · size 25% · config 20% · recency 20%. Top-matched comps best support the ARV.
Projected returns pro-forma
3.21% appreciation · 3.0% rent growth · sell at horizon
- IRR
- 17.7%
- Equity multiple
- 2.02×
- Total profit
- $42,603
- Equity at exit
- $68,724
- IRR
- 19.0%
- Equity multiple
- 3.82×
- Total profit
- $117,701
- Equity at exit
- $107,275
Cash invested: $41,720 (down + closing). Projections, not guarantees.
Landlord ↔ Tenant lean methodology
- Overall (STATE)
- 18 Strongly Tenant-Friendly
- State California
- 18 Strongly Tenant-Friendly · D+13
- County
- — inherits STATE
- City
- — inherits STATE
ZIP-level market 92230
- Home prices YoY
- 0.6%
- Active inventory
- 67
- Price-to-rent
- 6.5×
Monthly cashflow live
- Estimated rent
- $1,914 medium interval (Pro) →
- Mortgage (P&I)
- −$781
- Tax est. 1.5%
- −$186 /mo · $2,235/yr
- Insurance
- −$62
- Flood insurance flood zone
- −$122 /mo · $1,468/yr
- HOA
- −$0
- Vacancy / Maint / Mgmt
- −$402
- Net cashflow
- $360
Break-even live
UW: 25.0% down · 7.5% · 30yr · 1.5% tax · 5.0% vac · 8.0% maint · 8.0% mgmt
Financing live
Cash to close
- Down payment
- $37,250
- Closing costs
- $4,470
- Reserves months
- —
- Total cash needed
- —
Loan-product check · same deal, 3 products live
Conventional
25% down · 7.5% · 30yr
- Down + closing
- —
- Monthly P&I
- —
- Monthly cashflow
- —
- DSCR
- —
- Eligible?
- —
Personal DTI + credit; lowest rate.
DSCR
20% down · 8.5% · 30yr
- Down + closing
- —
- Monthly P&I
- —
- Monthly cashflow
- —
- DSCR
- —
- Eligible?
- —
No personal income docs; deal must DSCR.
Hard money
10% down · 12.0% · 12mo
- Down + closing
- —
- Monthly P&I
- —
- Monthly cashflow
- —
- DSCR
- —
- Eligible?
- —
Short-term bridge; refi at stabilization.
Rent comps 2 comps
| Address | Beds | Baths | Sqft | Rent | $/sqft | DOM | Units | Dist |
|---|---|---|---|---|---|---|---|---|
| 13175 Little Morongo Rd Desert Hot Springs, CA | 4.0 | 2.5 | 1056 | $1,995 | $1.89 | 43d | 1 | 0.55mi |
| 66051 3rd St Desert Hot Springs, CA | 2.0 | 1.0 | 760 | $1,675 | $2.20 | 24d | 1 | 1.46mi |
Listing history 16 events
-
2026-06-18days on market $149,000 Active 30 DOM
-
2026-06-17days on market $149,000 Active 29 DOM
-
2026-06-16days on market $149,000 Active 28 DOM
-
2026-06-15days on market $149,000 Active 27 DOM
-
2026-06-13days on market $149,000 Active 25 DOM
-
2026-06-13days on market $149,000 Active 24 DOM
-
2026-06-09days on market $149,000 Active 21 DOM
-
2026-06-08days on market $149,000 Active 20 DOM
-
2026-06-07remarks 630-char remark
-
2026-06-07days on market $149,000 Active 19 DOM
-
2026-06-04days on market $149,000 Active 16 DOM
-
2026-06-03days on market $149,000 Active 15 DOM
-
2026-06-02days on market $149,000 Active 14 DOM
-
2026-06-01days on market $149,000 Active 13 DOM
-
2026-05-31days on market $149,000 Active 12 DOM
-
2026-05-19$149,000 Active
ⓘ Source: listings_history table (triggers on properties + properties_extension) + one-shot
backfill from property_details.listing_events for pre-trigger history.
Climate risk First Street
- Flood 1/10 Low FEMA zone AO · 0% chance over 30 yrs
- Wildfire 6/10 Major
- Heat 8/10 Severe 5 d/yr ≥110°F today · 13 d/yr by 30 yrs out
- Wind 1/10 Low
- Air quality 5/10 Major 7 unhealthy d/yr today · 10 by 30 yrs out
Nearby sold comps map
Loading sold comps map…
Walkable amenities ~0.75 mi
Loading nearby amenities…
Taxation est. · year 1
- Rental income
- $22,966
- − Mortgage interest
- −$8,346
- − Property taxes
- −$2,235
- − Insurance
- −$2,212
- − Repairs & maintenance
- −$1,837
- − Management
- −$1,837
- − Depreciation
- −$4,335
- Taxable income
- $2,163
- Est. tax owed @ 24.0%
- −$519
- After-tax cash flow
- $3,800/yr
For passive investors: Depreciation is non-cash, so a rental often shows a tax loss while cash-flowing — sheltering income. Rental losses are passive: they offset passive income freely, and up to $25,000/yr can offset ordinary (W-2) income if you actively participate and your MAGI is under $100k (phasing out to $0 by $150k); unused losses carry forward. On sale, claimed depreciation is recaptured at up to 25%, and gains may owe capital-gains tax (a 1031 exchange can defer both). Figures are a year-1 estimate at your 24.0% rate — not tax advice; consult a CPA.
Condition & rehab AI · 2 photos
This manufactured home in Park West Mobile Home Park is in fair condition with average exterior and interior finishes. Painting and landscaping improvements would significantly enhance its curb appeal and value.
Value-add opportunities
- Both Painting the exterior and interior — Fresh paint enhances curb appeal and interior aesthetics
- Both Landscaping improvements — Well-maintained landscaping can significantly boost curb appeal and property value
- Both HVAC maintenance — A clean and efficient HVAC system improves comfort and energy efficiency
- Both Carport maintenance — A well-maintained carport can add value and utility to the property
Renovation cost estimate screening
Value-add ROI direction
- Both Painting the exterior and interior — Fresh paint enhances curb appeal and interior aesthetics ↑
- Both Landscaping improvements — Well-maintained landscaping can significantly boost curb appeal and property value ↑
- Both HVAC maintenance — A clean and efficient HVAC system improves comfort and energy efficiency ↑
- Both Carport maintenance — A well-maintained carport can add value and utility to the property ↑
ⓘ Cost ranges are severity-bucket heuristics (US national rule-of-thumb). Get contractor quotes + a written scope before underwriting a rehab budget.
Schools (NCES district)
- District
- Palm Springs Unified
- NCES district ID
- 0629550
- Math proficiency
- 21% ▼ -7.00%
- Reading proficiency
- 42% ▬ 0.00%
- Median HH income
- $43,638
- Composite
- 26.76/100
- National rank
- #7131
- State rank
- #328 of 517 in CA
Livability — Cabazon
- Score
- 53/100
- State rank
- #926
- US rank
- #24243
Category grades
Schools grade is shown separately in the Schools card above.
Census & demographics
- City population
- 2,105
- Population (ZIP)
- 2,105
Population outlook (Riverside County) Hauer SSP2
- Today (2025)
- 2,664,475 people
- By 2030
- 2,802,692 · +5.2%
- By 2040
- 3,050,904 · +14.5%
- By 2050
- 3,256,783 · +22.2%
- By 2075
- 3,655,058 · +37.2%
- By 2100
- 3,766,594 · +41.4%
Race, ethnicity, and origin ACS 2023
- Neighborhood character
- Diverse neighborhood (Simpson 0.55)
- Race & ethnicity
- Hispanic / Latino 53% White 41% Two or more races 11% Pacific Islander 1%
- Hispanic origin (detail)
- Mexican 47%
- Common ancestry
- Iranian 5% Scandinavian 2% Portuguese 2%
- Foreign-born
- 20% · Canada
- Languages at home
- 62% English-only · Spanish 37% Other Asian/Pacific 1%
Political lean MEDSL · Riverside
- 2024 margin
- Toss-up / Even · D 48.0% · R 49.3% · Other 2.6%
- 2008→2024 swing
- -3.6pp toward R · 2008: 2.3pp · 2024: -1.3pp
- All cycles
- 2024: R+1.3 2020: D+8.0 2016: D+4.3 2012: R+0.4 2008: D+2.3
Not yet ingested
- Civics
- —
Market trends
- HPI YoY
- ▲ 3.21%
- Current HPI
- 549.9479
- Rent YoY
- —
- Metro
- —
- State GDP YoY
- ▲ 3.21%
- F500 in state
- 116
Industry mix (Fortune 500 HQ in CA)
| Industry | F500 HQs | Revenue |
|---|---|---|
| Technology | 27 | $1,492B |
|
||
| Financial Services | 3 | $174B |
|
||
| Retail | 3 | $44B |
|
||
| Insurance | 3 | $26B |
|
||
| Media / Entertainment | 2 | $115B |
|
||
| Pharmaceuticals / Biotech | 2 | $62B |
|
||
Price history
1 event — show timeline
- 2026-05-19 Listed $149,000 CRMLS
Cash-flow waterfall
monthlySold comps — $/sqft
last 12 mo · ≤1 miLoading sold comps…