21244 W Hwy 113 Hwy · Ritchie, IL
Flood risk 9/10 · Severe
- FEMA flood zone
- X (unshaded)
- Chance of flooding over 30 yrs
- 0.99%
- Est. flood insurance / yr
- $507 – $1,088
Fire risk 1/10 · Minimal
- Est. fire insurance / yr
- $804 – $1,492
Heat risk 3/10 · Minor
- Hot days now (above 104°F)
- 7 days/yr
- Hot days in 30 yrs
- 16 days/yr
Wind risk 2/10 · Minimal
- Chance of severe wind over 30 yrs
- 1.0%
Air-quality risk 3/10 · Minor
- Unhealthy air days now
- 1 days/yr
- Unhealthy air days in 30 yrs
- 3 days/yr
Risk factors via First Street. Map © Google.
Why this score? — see what drove the C- grade
The composite is a weighted blend of 9 inputs, each scored 0–100. Each bar is that input's sub-score; the figure is the points it added to the 100-point composite (weight × sub-score).
- Cash flow +20.5/30.0
- ARV discount +7.5/15.0
- DSCR +6.5/10.0
- 1% rule +5.2/10.0
- Schools +3.0/10.0
- Rent growth +2.5/5.0
- Livability +2.5/5.0
- Condition / age +2.5/5.0
- Appreciation +0.0/10.0
$269,900
🖨 Deal sheet 📄 Offer letter ✓ Due diligence
Listing remarks
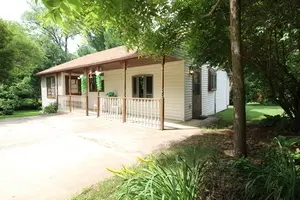
Beautifully updated 2 bedroom, 1 bath home. Enjoy amazing views right from your deck on a large, wooded lot. Fully Remodeled Riverfront home located on the scenic Kankakee River, Perfect for outdoor enthusiasts, this property offers direct access to excellent fishing and boating, along with breathtaking views and peaceful riverfront scenery. Inside features include original knotty pine paneled family/sunroom, partial basement, and an extra-large shed for storage. Recent updates include new HVAC and central air, new electrical service, new tankless hw heater updated lighting, new flooring, new doors and trim, plus a completely remodeled bathroom. Move-in ready with plenty of charm and comfor
Key facts
- New hvac
- Large wooded lot
- Updated home
Tags
Property features AI
Finance
- Other: Estimated living area and total finished area approximately 1,000; Immediate possession available
- HOA & community: No master association fee required
Exterior
- Parking: Space for 4 vehicles; Asphalt parking surface
- Utilities: Well water; Septic tank sewer
- Home design: Detached single-family home; One-story entry; Fee simple ownership; Rehab completed in 2025
- Construction: Vinyl siding exterior; Block foundation; Asphalt roof; Built before 1978
- Exterior features: Waterfront property; Lot dimensions approximately 177 x 226 x 106 x 256; Lot size between 0.25 and 0.49 acre
Interior
- Kitchen: Kitchen on the main level (12 x 13)
- Bedrooms: 2 bedrooms (both on the main level); Master bedroom on the main level (13 x 12); Second bedroom on the main level (13 x 9)
- Bathrooms: 1 full bathroom
- Heating & cooling: Natural gas heating; Central air conditioning
- Interior features: 5 total rooms; Unfinished basement with exterior entry, walk-up access, and partial finish
- Laundry & utility: Laundry room in the basement
Neighborhood map
What this means for you Summary
Snapshot
- This is a 2-bed/1.0-bath other listed at $270k.
Deal economics
- At list price, monthly cash flow is $291 ($3k/yr) — positive.
- The deal already cash-flows at list — no discount required.
- Meets the 1% rule at list price ($3k rent vs $270k).
- Recommended offer: $266k (1.5% below list) — sets the bar for market timing.
Location & tenants
- Location reads: area grade C — affects rentability + tenant quality, not the cash-flow math above.
- Reed Custer CUSD 255U (rural): math 29% / reading 37% proficiency, ranked #203 of 620 in IL (top 33%) — families likely to look elsewhere, expect single-tenant / working-renter base with shorter leases.
- Market conditions: 81 active listings in the ZIP; 1 comparable units currently listed for rent nearby; 2,028 units permitted in Will County in 2024 (530 in 5+ unit buildings).
Forward outlook
- Local home prices are declining (-3.0%/yr); year-one equity from $2k of loan paydown is wiped out by about $8k of value loss. Plan a longer hold.
- Will County population projected to shrink 4% by 2050 — rents likely to lag national; underwrite the cash flow, not the appreciation.
Negotiation context
- It's been on market 16 days — a 2% lower offer ($266k) is reasonable based on typical stale-listing flexibility.
- 10 sale attempts since 4y ago; this cycle's ask is 4% above the opening price — seller raised mid-cycle; expect resistance to lowballs.
- Current owner paid $205k; 32% above their basis — modest negotiation headroom, anchor on the comps not their cost.
Risks & watch-outs
- Watch-outs: flood insurance adds $66/mo.
- Climate carrying-cost: severe flood risk — expect insurance premiums to compound above CPI over the hold.
Questions for the listing agent
- What's the actual annual flood-insurance premium (NFIP or private), and is the property in a SFHA with mandatory coverage?
- Is there a deadline driving the sale (1031 exchange, divorce, estate, relocation)? That informs how much negotiation room exists.
- What's the average days-on-market for RENTAL listings here right now (not sales)? A rising rental-DOM trend means longer vacancies and softer asking-rent achievability than the comps imply.
- What's the recent tenant-quality profile in this submarket — average credit score on applications, eviction rate, late-payment / NSF rate, and stable-employment percentage? A property-management company in the area should have these aggregated.
- How much new for-sale + rental construction is in the pipeline within 1–3 miles? Heavy new supply typically softens prices + rents 12–24 months out; constrained supply supports both.
Investment metrics
- 1% rule
- 1.02% ✓
- Cap rate
- 7.88%
- Cash-on-cash
- 5.68%
- DSCR
- 1.25
- GRM
- 8.2
CMA / ARV
No comps found within radius.
Projected returns pro-forma
-3.0% appreciation · 3.0% rent growth · sell at horizon
- IRR
- -9.1%
- Equity multiple
- 0.67×
- Total profit
- $-25,128
- Equity at exit
- $40,243
- IRR
- 0.4%
- Equity multiple
- 1.03×
- Total profit
- $2,220
- Equity at exit
- $23,336
Cash invested: $75,572 (down + closing). Projections, not guarantees.
Landlord ↔ Tenant lean methodology
- Overall (STATE)
- 43 Moderately Tenant-Leaning
- State Illinois
- 43 Moderately Tenant-Leaning · D+7
- County
- — inherits STATE
- City
- — inherits STATE
ZIP-level market 60481
- Active inventory
- 81
- Price-to-rent
- 8.2×
Monthly cashflow live
- Estimated rent
- $2,750 medium interval (Pro) →
- Mortgage (P&I)
- −$1,415
- Tax from tax record
- −$287 /mo · $3,442/yr
- Insurance
- −$112
- Flood insurance flood zone
- −$66 /mo · $798/yr
- HOA
- −$0
- Vacancy / Maint / Mgmt
- −$578
- Net cashflow
- $291
Break-even live
UW: 25.0% down · 7.5% · 30yr · 1.5% tax · 5.0% vac · 8.0% maint · 8.0% mgmt
Financing live
Cash to close
- Down payment
- $67,475
- Closing costs
- $8,097
- Reserves months
- —
- Total cash needed
- —
Loan-product check · same deal, 3 products live
Conventional
25% down · 7.5% · 30yr
- Down + closing
- —
- Monthly P&I
- —
- Monthly cashflow
- —
- DSCR
- —
- Eligible?
- —
Personal DTI + credit; lowest rate.
DSCR
20% down · 8.5% · 30yr
- Down + closing
- —
- Monthly P&I
- —
- Monthly cashflow
- —
- DSCR
- —
- Eligible?
- —
No personal income docs; deal must DSCR.
Hard money
10% down · 12.0% · 12mo
- Down + closing
- —
- Monthly P&I
- —
- Monthly cashflow
- —
- DSCR
- —
- Eligible?
- —
Short-term bridge; refi at stabilization.
Rent comps 1 comps
| Address | Beds | Baths | Sqft | Rent | $/sqft | DOM | Units | Dist |
|---|---|---|---|---|---|---|---|---|
| 34500 S Lakeside Ter Wilmington, IL | 3.0 | 1.5 | 1300 | $2,750 | $2.12 | 24d | 1 | 1.35mi |
Listing history 29 events
-
2026-05-11historical
-
2026-05-11$269,900 Active 752-char remark
-
2026-05-07price
-
2026-05-07Active
-
2026-05-07historical
-
2026-04-08price
-
2025-12-11price
-
2025-11-23price
-
2025-11-14Active
-
2025-11-13historical
-
2025-10-20price
-
2025-10-14Active
-
2025-10-14historical
-
2025-10-07price
-
2025-09-24Active
-
2025-09-24historical
-
2025-09-09Active
-
2023-11-22soldstatus $205,000
-
2023-11-01soldstatus $205,000 Closed
-
2023-09-23historical Contingent - No Showings
-
2023-08-29price $238,500
-
2023-07-06$258,500 Active
-
2023-06-12historical
-
2023-05-05Active
-
2023-05-05historical
-
2023-03-17price
-
2022-12-08Active
-
1989-11-13soldstatus $66,000
-
1988-06-27soldstatus $84,000
ⓘ Source: listings_history table (triggers on properties + properties_extension) + one-shot
backfill from property_details.listing_events for pre-trigger history.
Tax reassessment forecast IL · Partial reset (capped growth)
- Current annual tax
- $3,442 · $287/mo
- Projected year-2 tax
- $4,785 · $399/mo
- Expected delta
- +$1,342/yr (+$112/mo · 39.0%)
ⓘ Screening estimate from a state-policy table — verify with the county assessor before closing.
Climate risk First Street
- Flood 9/10 Extreme FEMA zone X (unshaded) · 99% chance over 30 yrs
- Wildfire 1/10 Low
- Heat 3/10 Moderate 7 d/yr ≥104°F today · 16 d/yr by 30 yrs out
- Wind 2/10 Low 100% chance of damaging wind over 30 yrs
- Air quality 3/10 Moderate 1 unhealthy d/yr today · 3 by 30 yrs out
Nearby sold comps map
Loading sold comps map…
Walkable amenities ~0.75 mi
Loading nearby amenities…
Taxation est. · year 1
- Rental income
- $33,000
- − Mortgage interest
- −$15,119
- − Property taxes
- −$3,442
- − Insurance
- −$2,147
- − Repairs & maintenance
- −$2,640
- − Management
- −$2,640
- − Depreciation
- −$7,852
- Taxable loss
- −$840
- Est. tax savings @ 24.0%
- +$201
- After-tax cash flow
- $3,698/yr
For passive investors: Depreciation is non-cash, so a rental often shows a tax loss while cash-flowing — sheltering income. Rental losses are passive: they offset passive income freely, and up to $25,000/yr can offset ordinary (W-2) income if you actively participate and your MAGI is under $100k (phasing out to $0 by $150k); unused losses carry forward. On sale, claimed depreciation is recaptured at up to 25%, and gains may owe capital-gains tax (a 1031 exchange can defer both). Figures are a year-1 estimate at your 24.0% rate — not tax advice; consult a CPA.
Schools (NCES district)
- District
- Reed Custer CUSD 255U
- NCES district ID
- 1733380
- Math proficiency
- 29% ▼ -8.00%
- Reading proficiency
- 37% ▼ -12.00%
- Median HH income
- $60,500
- Composite
- 29.67/100
- National rank
- #6461
- State rank
- #203 of 620 in IL
Livability — Ritchie
No livability data for this city. (Only ~50 U.S. cities are tracked.)
Census & demographics
- Population (ZIP)
- 11,277
Population outlook (Will County) Hauer SSP2
- Today (2025)
- 705,368 people
- By 2030
- 708,154 · +0.4%
- By 2040
- 702,692 · -0.4%
- By 2050
- 680,249 · -3.6%
- By 2075
- 611,990 · -13.2%
- By 2100
- 516,215 · -26.8%
Race, ethnicity, and origin ACS 2023
- Neighborhood character
- Predominantly White (88%)
- Race & ethnicity
- White 88% Hispanic / Latino 7% Two or more races 4% Black 2%
- Hispanic origin (detail)
- Mexican 5%
- Common ancestry
- Romanian 6% Iranian 3% Lithuanian 2%
- Foreign-born
- 4% · Canada, Dominican Republic
- Languages at home
- 94% English-only · Spanish 4%
Political lean MEDSL · Will
- 2024 margin
- Toss-up / Even · D 50.1% · R 48.5% · Other 1.4%
- 2008→2024 swing
- -11.6pp toward R · 2008: 13.2pp · 2024: 1.6pp
- All cycles
- 2024: D+1.6 2020: D+8.3 2016: D+5.7 2012: D+3.7 2008: D+13.2
Not yet ingested
- Civics
- —
Market trends
- HPI YoY
- ▼ -224.12%
- Current HPI
- 230.6346
- Rent YoY
- —
- Metro
- —
- State GDP YoY
- ▲ 1.59%
- F500 in state
- 60
Industry mix (Fortune 500 HQ in IL)
| Industry | F500 HQs | Revenue |
|---|---|---|
| Insurance | 4 | $201B |
|
||
| Consumer Goods | 4 | $87B |
|
||
| Industrial Machinery | 3 | $64B |
|
||
| Healthcare | 2 | $55B |
|
||
| Retail / Pharmacy | 1 | $148B |
|
||
| Agriculture / Food | 1 | $86B |
|
||
Price history
+144.0% since first listed32 events — show timeline
- 2026-05-29 Listing Removed — MRED as Distributed by MLS Grid
- 2026-05-28 Listing Removed — MRED as Distributed by MLS Grid
- 2026-05-28 Listed — MRED as Distributed by MLS Grid
- 2026-05-11 Listing Removed — MRED as Distributed by MLS Grid
- 2026-05-11 Listed — MRED as Distributed by MLS Grid
- 2026-05-07 Price Changed — MRED as Distributed by MLS Grid
- 2026-05-07 Listing Removed — MRED as Distributed by MLS Grid
- 2026-05-07 Listed — MRED as Distributed by MLS Grid
- 2026-04-08 Price Changed — MRED as Distributed by MLS Grid
- 2025-12-11 Price Changed — MRED as Distributed by MLS Grid
- 2025-11-23 Price Changed — MRED as Distributed by MLS Grid
- 2025-11-14 Listed — MRED as Distributed by MLS Grid
- 2025-11-13 Listing Removed — MRED as Distributed by MLS Grid
- 2025-10-20 Price Changed — MRED as Distributed by MLS Grid
- 2025-10-14 Listing Removed — MRED as Distributed by MLS Grid
- 2025-10-14 Listed — MRED as Distributed by MLS Grid
- 2025-10-07 Price Changed — MRED as Distributed by MLS Grid
- 2025-09-24 Listing Removed — MRED as Distributed by MLS Grid
- 2025-09-24 Listed — MRED as Distributed by MLS Grid
- 2025-09-09 Listed — MRED as Distributed by MLS Grid
- 2023-11-22 Sold (Public Records) $205,000 Public Records
- 2023-11-01 Sold (MLS) $205,000 MRED as Distributed by MLS Grid
- 2023-09-23 Contingent — MRED as Distributed by MLS Grid
- 2023-08-29 Price Changed $238,500 MRED as Distributed by MLS Grid
- 2023-07-06 Listed $258,500 MRED as Distributed by MLS Grid
- 2023-06-12 Listing Removed — MRED as Distributed by MLS Grid
- 2023-05-05 Listing Removed — MRED as Distributed by MLS Grid
- 2023-05-05 Listed — MRED as Distributed by MLS Grid
- 2023-03-17 Price Changed — MRED as Distributed by MLS Grid
- 2022-12-08 Listed — MRED as Distributed by MLS Grid
- 1989-11-13 Sold (Public Records) $66,000 Public Records
- 1988-06-27 Sold (Public Records) $84,000 Public Records
Property tax history
+1.2%/yrLatest (2024): $3,442 · +5.2% YoY. Source: county tax records.
Cash-flow waterfall
monthlySold comps — $/sqft
last 12 mo · ≤1 miLoading sold comps…