 🏷️ Likely Rental
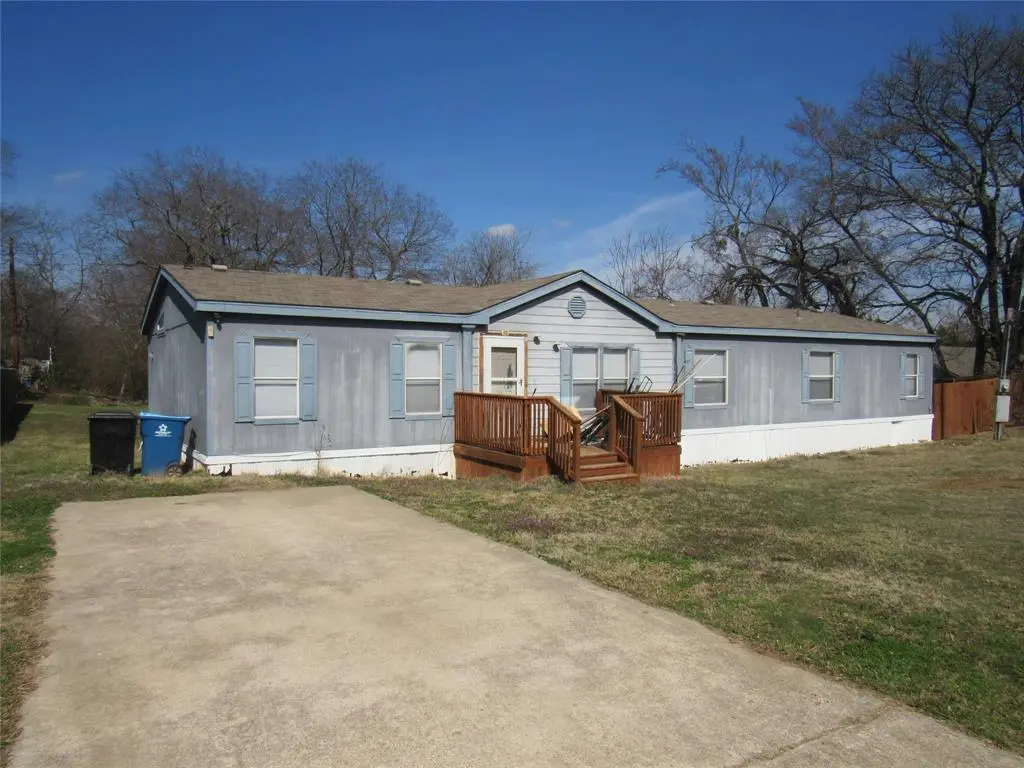
501 W Collins St · Denison, TX
Flood risk 1/10 · Minimal
- FEMA flood zone
- X (unshaded)
- Chance of flooding over 30 yrs
- 0.0%
- Est. flood insurance / yr
- $507 – $1,088
Fire risk 5/10 · Moderate
- Est. fire insurance / yr
- $1,222 – $2,270
Heat risk 6/10 · Moderate
- Hot days now (above 108°F)
- 7 days/yr
- Hot days in 30 yrs
- 21 days/yr
Wind risk 4/10 · Minor
- Chance of severe wind over 30 yrs
- 20.0%
Air-quality risk 2/10 · Minimal
- Unhealthy air days now
- 2 days/yr
- Unhealthy air days in 30 yrs
- 2 days/yr
Risk factors via First Street. Map © Google.
Why this score? — see what drove the B grade
The composite is a weighted blend of 9 inputs, each scored 0–100. Each bar is that input's sub-score; the figure is the points it added to the 100-point composite (weight × sub-score).
- Cash flow +26.7/30.0
- ARV discount +15.0/15.0
- DSCR +9.2/10.0
- 1% rule +8.3/10.0
- Schools +3.7/10.0
- Livability +3.7/5.0
- Rent growth +2.5/5.0
- Condition / age +2.5/5.0
- Appreciation +0.0/10.0
$150,000
🖨 Deal sheet (PDF) 📄 Offer letter ✓ Due diligence
Listing remarks MLS
This 5 bedroom 3 bath home sits conveniently in the heart of Denison, minutes to schools, retail, downtown Denison, Medical and US Hwy 75. 2 large lots make up the third of an acre this home sits on, with the back yard being primarily fenced. Weather you fix it up with new carpet, paint and siding or remove the spacious doublewide and build, this home and location are amazing, with established homes on three sides and new town homes to the east. This home needs a bit of TLC, has been a rental and you can see what all is needed when you enter, carpet, a bit of paint, repair a few doors and one of the three full baths. This is priced to sell with those fixes in mind along with new skirting surrounding the home. Take a look today with your favorite agent, a bit of elbow grease and this home will be back to the amazing home the sellers had before the tenant. Small front porch and back stairs and landings, this is a massive amount of home for the money! buyer responsible to verify all information, disclosure and survey in documents.
Key facts
- Spacious doublewide
- Small front porch
- Two large lots
Tags
Neighborhood map
What this means for you Summary
Snapshot
- This is a 5-bed/3.0-bath manufactured listed at $150k.
Deal economics
- At list price, monthly cash flow is $406 ($5k/yr) — positive.
- The deal already cash-flows at list — no discount required.
- Meets the 1% rule at list price ($2k rent vs $150k).
- Recommended offer: $132k (12.0% below list) — sets the bar for market timing.
- Cap rate 9.5% vs local median 3.8% in Denison — top-decile yield for the area; either an underpriced asset or a hidden risk that comps aren't pricing in. Stress-test before assuming the spread holds.
Location & tenants
- Location reads 73/100 on livability (#221 in TX) — a middle-class / working-renter tenant base. Strengths: cost of living A+, housing A+, crime A; Watch: health & safety D+, schools D-, amenities F.
- Denison ISD (urban): math 43% / reading 44% proficiency, ranked #315 of 826 in TX (top 38%) — families likely to look elsewhere, expect single-tenant / working-renter base with shorter leases.
- Market conditions: Rents flat; 485 active listings in the ZIP; 3 comparable units currently listed for rent nearby; rentals lingering (median 45d on market — plan ~5-8 weeks vacancy on turnover, expect pricing pressure); 100% of comp listings sitting > 30 days — soft ceiling on asking rent; 2,272 units permitted in Grayson County in 2024 (750 in 5+ unit buildings).
- This rent runs 33% of the median local income ($72k/yr) — at the standard rent-burdened threshold; future hikes will face affordability resistance.
Forward outlook
- Local home prices are declining (-3.0%/yr); year-one equity from $1k of loan paydown is wiped out by about $4k of value loss. Plan a longer hold.
- Grayson County population projected at +12% by 2050 — modest demand growth; plan on rents tracking national, not racing it.
Negotiation context
- It's been on market 121 days — a 12% lower offer ($132k) is reasonable based on typical stale-listing flexibility.
- 4 sale attempts since 23y ago with the ask held roughly flat each time — persistent listings suggest the price (not the market) is what's stuck; bring a comps-based counter.
Risks & watch-outs
- Watch-outs: property tax is 2.6% of price.
- Climate carrying-cost: moderate wildfire risk; extreme-heat days projected 7→21/yr by 2055 (HVAC capex compounding) — expect insurance premiums to compound above CPI over the hold.
Questions for the listing agent
- It's been on market 121 days. Have you received any prior offers? Is the seller open to a 12% concession, seller financing, or rate buy-down credit?
- Property tax is high relative to price — has the assessment been appealed recently, and will the sale trigger a re-assessment?
- Why hasn't it sold? Are there any deal-killer items the seller is aware of (foundation, flood, title, zoning, code violations)?
- Is there a deadline driving the sale (1031 exchange, divorce, estate, relocation)? That informs how much negotiation room exists.
- Schools are D-rated, which usually means shorter tenancies and higher turnover. Who's the typical renter profile here, and what's been the actual vacancy rate?
- What's the average days-on-market for RENTAL listings here right now (not sales)? A rising rental-DOM trend means longer vacancies and softer asking-rent achievability than the comps imply.
- What's the recent tenant-quality profile in this submarket — average credit score on applications, eviction rate, late-payment / NSF rate, and stable-employment percentage? A property-management company in the area should have these aggregated.
- How much new for-sale + rental construction is in the pipeline within 1–3 miles? Heavy new supply typically softens prices + rents 12–24 months out; constrained supply supports both.
Investment metrics
- 1% rule
- 1.33% ✓
- Cap rate
- 9.54%
- Cash-on-cash
- 11.61%
- DSCR
- 1.52
- GRM
- 6.3
CMA / ARV
- ARV (median comp)
- $250,804
- List price
- $150,000
- Delta
- -40.19%
- Verdict
- UNDERPRICED
- Comps
- 20 within 1.0 mi
Projected returns pro-forma
-3.0% appreciation · 0.05% rent growth · sell at horizon
- IRR
- -2.7%
- Equity multiple
- 0.90×
- Total profit
- $-4,064
- Equity at exit
- $22,365
- IRR
- 3.1%
- Equity multiple
- 1.19×
- Total profit
- $7,985
- Equity at exit
- $12,969
Cash invested: $42,000 (down + closing). Projections, not guarantees.
Landlord ↔ Tenant lean methodology
- Overall (STATE)
- 87 Strongly Landlord-Friendly
- State Texas
- 87 Strongly Landlord-Friendly · R+5
- County
- — inherits STATE
- City
- — inherits STATE
ZIP-level market 75020
- Rents YoY
- 0.1%
- Active inventory
- 485
- Price-to-rent
- 6.3×
Monthly cashflow live
- Estimated rent
- $1,996 medium interval (Pro) →
- Mortgage (P&I)
- −$787
- Tax from tax record
- −$321 /mo · $3,858/yr
- Insurance
- −$62
- HOA
- −$0
- Vacancy / Maint / Mgmt
- −$419
- Net cashflow
- $406
Break-even live
Sensitivity live
| Price | -10% $491 | -5% $449 | +0% $406 | +5% $364 | +10% $322 |
|---|---|---|---|---|---|
| Rent | -10% $249 | -5% $328 | +0% $406 | +5% $485 | +10% $564 |
| Rate | -1.0pp $482 | -0.5pp $445 | base $406 | +0.5pp $368 | +1.0pp $328 |
UW: 25.0% down · 7.5% · 30yr · 1.5% tax · 5.0% vac · 8.0% maint · 8.0% mgmt
Financing live
Cash to close
- Down payment
- $37,500
- Closing costs
- $4,500
- Reserves months
- —
- Total cash needed
- —
Loan-product check · same deal, 3 products live
Conventional
25% down · 7.5% · 30yr
- Down + closing
- —
- Monthly P&I
- —
- Monthly cashflow
- —
- DSCR
- —
- Eligible?
- —
Personal DTI + credit; lowest rate.
DSCR
20% down · 8.5% · 30yr
- Down + closing
- —
- Monthly P&I
- —
- Monthly cashflow
- —
- DSCR
- —
- Eligible?
- —
No personal income docs; deal must DSCR.
Hard money
10% down · 12.0% · 12mo
- Down + closing
- —
- Monthly P&I
- —
- Monthly cashflow
- —
- DSCR
- —
- Eligible?
- —
Short-term bridge; refi at stabilization.
Rent comps 3 comps
| Address | Beds | Baths | Sqft | Rent | $/sqft | DOM | Units | Dist |
|---|---|---|---|---|---|---|---|---|
| 1931 Ave a Denison, TX | 4.0 | 3.0 | 1450 | $1,695 | $1.17 | 44d | 1 | 0.49mi |
| 1921 Ave a Denison, TX | 4.0 | 3.0 | 1700 | $1,995 | $1.17 | 44d | 1 | 0.49mi |
| 1730 S Center St Denison, TX | 4.0 | 1.5 | 1700 | $1,500 | $0.88 | 44d | 1 | 0.87mi |
Listing history 27 events
-
2026-06-19days on market $150,000 Active 121 DOM
-
2026-06-18days on market $150,000 Active 120 DOM
-
2026-06-17days on market $150,000 Active 119 DOM
-
2026-06-16days on market $150,000 Active 118 DOM
-
2026-06-15days on market $150,000 Active 117 DOM
-
2026-06-14days on market $150,000 Active 115 DOM
-
2026-06-13days on market $150,000 Active 114 DOM
-
2026-06-10days on market $150,000 Active 112 DOM
-
2026-06-09days on market $150,000 Active 111 DOM
-
2026-06-08days on market $150,000 Active 110 DOM
-
2026-06-07days on market $150,000 Active 109 DOM
-
2026-06-05days on market $150,000 Active 106 DOM
-
2026-06-03days on market $150,000 Active 105 DOM
-
2026-06-02days on market $150,000 Active 104 DOM
-
2026-06-01days on market $150,000 Active 103 DOM
-
2026-05-31days on market $150,000 Active 102 DOM
-
2026-05-30days on market $150,000 Active 101 DOM
-
2026-02-16$150,000 Active 1049-char remark
Show marketing remark (1049 chars)
This 5 bedroom 3 bath home sits conveniently in the heart of Denison, minutes to schools, retail, downtown Denison, Medical and US Hwy 75. 2 large lots make up the third of an acre this home sits on, with the back yard being primarily fenced. Weather you fix it up with new carpet, paint and siding or remove the spacious doublewide and build, this home and location are amazing, with established homes on three sides and new town homes to the east. This home needs a bit of TLC, has been a rental and you can see what all is needed when you enter, carpet, a bit of paint, repair a few doors and one of the three full baths. This is priced to sell with those fixes in mind along with new skirting surrounding the home. Take a look today with your favorite agent, a bit of elbow grease and this home will be back to the amazing home the sellers had before the tenant. Small front porch and back stairs and landings, this is a massive amount of home for the money! buyer responsible to verify all information, disclosure and survey in documents.
-
2010-10-15historical
-
2010-05-28$54,900
-
2006-01-23soldstatus
-
2006-01-02historical
-
2005-12-23$37,000
-
2004-06-03soldstatus
-
2003-09-04soldstatus
-
2003-07-30historical
-
2003-07-11$10,000
ⓘ Source: listings_history table (triggers on properties + properties_extension) + one-shot
backfill from property_details.listing_events for pre-trigger history.
Tax reassessment forecast TX · Resets to sale price
- Current annual tax
- $3,858 · $321/mo
- Projected year-2 tax
- $3,858 · $321/mo
- Expected delta
- $0/yr ($0/mo · 0.0%)
ⓘ Screening estimate from a state-policy table — verify with the county assessor before closing.
Climate risk First Street
- Flood 1/10 Low FEMA zone X (unshaded) · 0% chance over 30 yrs
- Wildfire 5/10 Major
- Heat 6/10 Major 7 d/yr ≥108°F today · 21 d/yr by 30 yrs out
- Wind 4/10 Moderate 20% chance of damaging wind over 30 yrs
- Air quality 2/10 Low 2 unhealthy d/yr today · 2 by 30 yrs out
Nearby sold comps map
Loading sold comps map…
Walkable amenities ~0.75 mi
Loading nearby amenities…
Taxation est. · year 1
- Rental income
- $23,955
- − Mortgage interest
- −$8,402
- − Property taxes
- −$3,858
- − Insurance
- −$750
- − Repairs & maintenance
- −$1,916
- − Management
- −$1,916
- − Depreciation
- −$4,364
- Taxable income
- $2,748
- Est. tax owed @ 24.0%
- −$660
- After-tax cash flow
- $4,218/yr
For passive investors: Depreciation is non-cash, so a rental often shows a tax loss while cash-flowing — sheltering income. Rental losses are passive: they offset passive income freely, and up to $25,000/yr can offset ordinary (W-2) income if you actively participate and your MAGI is under $100k (phasing out to $0 by $150k); unused losses carry forward. On sale, claimed depreciation is recaptured at up to 25%, and gains may owe capital-gains tax (a 1031 exchange can defer both). Figures are a year-1 estimate at your 24.0% rate — not tax advice; consult a CPA.
Schools (NCES district)
- District
- Denison ISD
- NCES district ID
- 4816710
- Math proficiency
- 43% ▼ -7.00%
- Reading proficiency
- 44% ▼ -3.00%
- Median HH income
- $41,650
- Composite
- 36.6/100
- National rank
- #4629
- State rank
- #315 of 826 in TX
Livability — Denison
- Score
- 73/100
- State rank
- #221
- US rank
- #5428
Category grades
Schools grade is shown separately in the Schools card above.
Census & demographics
- Census place
- Denison, TX
- County
- Grayson County · 108,053 people
- City population
- 34,008
- Metro
- Sherman-Denison, TX
- Population (ZIP)
- 24,835
- Household income
- $71,605
- Rent vs Own
- Severe rent burden
- 997.0
Population outlook (Grayson County) Hauer SSP2
- Today (2025)
- 134,540 people
- By 2030
- 138,653 · +3.1%
- By 2040
- 145,958 · +8.5%
- By 2050
- 151,218 · +12.4%
- By 2075
- 161,802 · +20.3%
- By 2100
- 159,036 · +18.2%
Race, ethnicity, and origin ACS 2023
- Neighborhood character
- Predominantly White (73%)
- Race & ethnicity
- White 73% Hispanic / Latino 13% Two or more races 9% Black 6%
- Hispanic origin (detail)
- Mexican 11%
- Common ancestry
- Slovak 5% Serbian 2% Portuguese 2%
- Foreign-born
- 4% · Canada
- Languages at home
- 93% English-only · Spanish 6%
Political lean MEDSL · Grayson
- 2024 margin
- Solid R (+54.3) · D 22.5% · R 76.7%
- 2008→2024 swing
- -16.4pp toward R · 2008: -37.9pp · 2024: -54.3pp
- All cycles
- 2024: R+54.3 2020: R+49.9 2016: R+53.1 2012: R+48.0 2008: R+37.9
Not yet ingested
- Civics
- —
Market trends
- HPI YoY
- ▼ -295.96%
- Current HPI
- 257.1806
- Rent YoY
- ▬ 0.05%
- Metro
- Sherman-Denison, TX
- State GDP YoY
- ▲ 3.95%
- F500 in state
- 110
Industry mix (Fortune 500 HQ in TX)
| Industry | F500 HQs | Revenue |
|---|---|---|
| Energy | 16 | $1,198B |
|
||
| Technology | 5 | $198B |
|
||
| Engineering / Construction | 4 | $72B |
|
||
| Energy Services | 3 | $60B |
|
||
| Utilities | 3 | $41B |
|
||
| Healthcare | 2 | $330B |
|
||
Price history
+1400.0% since first listed10 events — show timeline
- 2026-02-16 Listed $150,000 NTREIS
- 2010-10-15 Listing Removed — NTREIS
- 2010-05-28 Listed $54,900 NTREIS
- 2006-01-23 Sold (MLS) — NTREIS
- 2006-01-02 Listing Removed — NTREIS
- 2005-12-23 Listed $37,000 NTREIS
- 2004-06-03 Sold (Public Records) — Public Records
- 2003-09-04 Sold (Public Records) — Public Records
- 2003-07-30 Listing Removed — NTREIS
- 2003-07-11 Listed $10,000 NTREIS
Property tax history
+4.9%/yrLatest (2025): $3,858 · -4.1% YoY. Source: county tax records.
Cash-flow waterfall
monthlySold comps — $/sqft
last 12 mo · ≤1 miLoading sold comps…