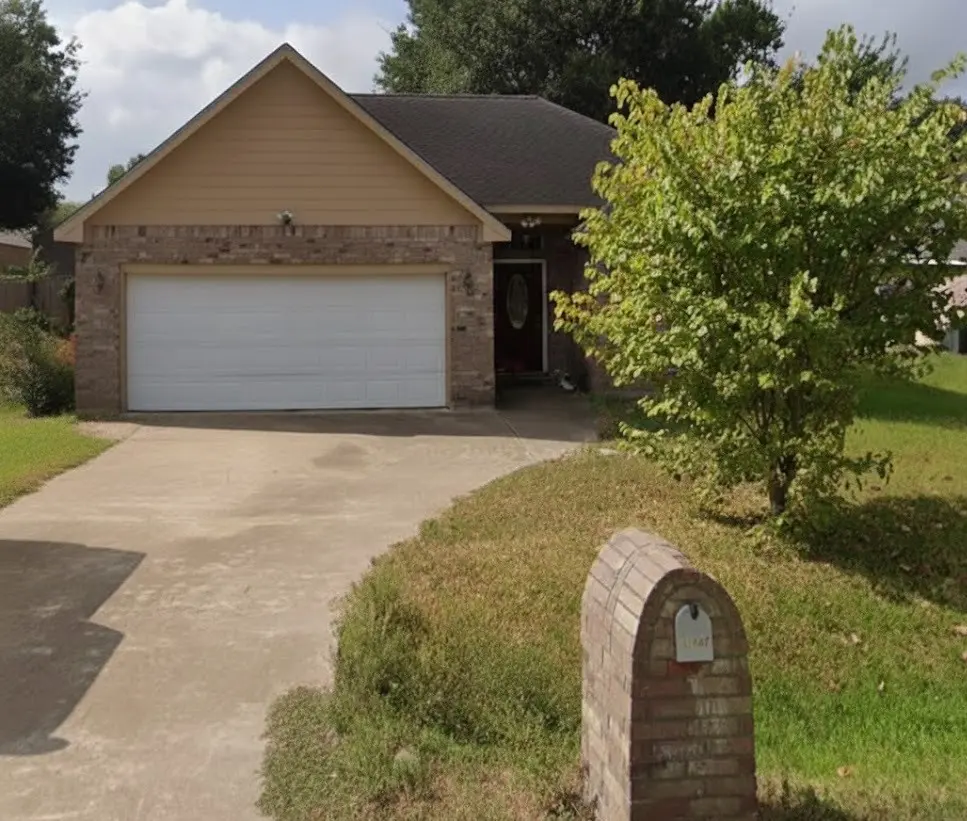
31907 Ironwood Dr · Waller, TX
Flood risk 4/10 · Minor
- FEMA flood zone
- X (unshaded)
- Chance of flooding over 30 yrs
- 0.22%
- Est. flood insurance / yr
- $507 – $1,088
Fire risk 5/10 · Moderate
- Est. fire insurance / yr
- $1,222 – $2,270
Heat risk 9/10 · Severe
- Hot days now (above 111°F)
- 7 days/yr
- Hot days in 30 yrs
- 22 days/yr
Wind risk 8/10 · Major
- Chance of severe wind over 30 yrs
- 99.0%
Air-quality risk 2/10 · Minimal
- Unhealthy air days now
- 1 days/yr
- Unhealthy air days in 30 yrs
- 1 days/yr
Risk factors via First Street. Map © Google.
Why this score? — see what drove the D grade
The composite is a weighted blend of 9 inputs, each scored 0–100. Each bar is that input's sub-score; the figure is the points it added to the 100-point composite (weight × sub-score).
- ARV discount +15.0/15.0
- Cash flow +7.8/30.0
- 1% rule +3.8/10.0
- Livability +3.1/5.0
- Appreciation +2.9/10.0
- Schools +2.9/10.0
- Condition / age +2.5/5.0
- DSCR +1.8/10.0
- Rent growth +1.6/5.0
$190,000
🖨 Deal sheet (PDF) 📄 Offer letter ✓ Due diligence
Listing remarks MLS
Investor Special! 3 bed, 2 bath home with great layout and oversized yard in a quiet country-style subdivision. Just minutes from Hwy 290 and walking distance to schools, this property is ready for a refresh and full of potential. Home features an open kitchen with granite countertops. The kitchen opens to the family room with a gas fireplace, ideal for future entertaining. Private primary suite offers double sinks, a garden tub, and separate shower. No carpet throughout. Large fenced backyard with room to expand outdoor living or add value. Home needs cosmetic updates but has strong bones and great flow. Perfect opportunity for investors, flippers, or buyers looking to customize and create equity. Priced to sell.
Key facts
- Double sinks
- Oversized yard
- Gas fireplace
Tags
Neighborhood map
What this means for you Summary
Snapshot
- This is a 3-bed/2.0-bath single-family listed at $190k.
Deal economics
- At list price, monthly cash flow is $-214 ($-3k/yr) — negative.
- To cash-flow at today's rent, offer at most $152k (19.9% below list).
- To meet the 1% rule (rent ≥ 1% of price), the offer needs to be $168k (11.7% below list).
- Recommended offer: $152k (19.9% below list) — sets the bar for cash-flow.
- Cap rate 4.9% vs local median 3.0% in Waller — top-decile yield for the area; either an underpriced asset or a hidden risk that comps aren't pricing in. Stress-test before assuming the spread holds.
Location & tenants
- Location reads 61/100 on livability (#1,003 in TX) — a middle-class / working-renter tenant base. Strengths: cost of living A+, housing A-; Watch: crime D, amenities F, commute F.
- Waller ISD (rural): math 30% / reading 35% proficiency, ranked #532 of 826 in TX (top 64%) — families likely to look elsewhere, expect single-tenant / working-renter base with shorter leases.
- Zoned schools: I T Holleman El (math 33% / reading 31%, grade F, #2,268 of 4,322 statewide, top 55%, 688 students, 70% FRL); Waller J H (math 21% / reading 28%, grade F, #1,279 of 1,662 statewide, top 78%, 899 students, 69% FRL); Waller H S (math 25% / reading 40%, grade F, #1,029 of 1,632 statewide, top 64%, 2,639 students, 62% FRL).
- Market conditions: Rents falling (-3.8%/yr); 1196 active listings in the ZIP; 4 comparable units currently listed for rent nearby; rentals lingering (median 46d on market — plan ~5-8 weeks vacancy on turnover, expect pricing pressure); 50% of comp listings sitting > 30 days — soft ceiling on asking rent; solid renter incomes; 29,883 units permitted in Harris County in 2024 (8,621 in 5+ unit buildings).
Forward outlook
- Local home prices are declining (-3.0%/yr); year-one equity from $1k of loan paydown is wiped out by about $6k of value loss. Plan a longer hold.
- Harris County population projected at +47% by 2050 — long-run rental-demand tailwind backs the buy-and-hold thesis.
Negotiation context
- It's been on market 187 days — a 12% lower offer ($167k) is reasonable based on typical stale-listing flexibility.
- 8 sale attempts since 20y ago; this cycle's ask has dropped $20k (10%) from the opening price — seller is motivated, your offer sets the floor, not the list.
Risks & watch-outs
- Watch-outs: property tax is 2.9% of price.
- Climate carrying-cost: severe wind risk, 99% chance of damaging wind over 30y; moderate wildfire risk; extreme-heat days projected 7→22/yr by 2055 (HVAC capex compounding) — expect insurance premiums to compound above CPI over the hold.
Questions for the listing agent
- What do current leases actually rent for vs. the listed asking? Can we see a recent rent roll and the last 12 months of T-12 income?
- It's been on market 187 days. Have you received any prior offers? Is the seller open to a 20% concession, seller financing, or rate buy-down credit?
- Property tax is high relative to price — has the assessment been appealed recently, and will the sale trigger a re-assessment?
- Why hasn't it sold? Are there any deal-killer items the seller is aware of (foundation, flood, title, zoning, code violations)?
- Is there a deadline driving the sale (1031 exchange, divorce, estate, relocation)? That informs how much negotiation room exists.
- Crime grade is D in this area — have there been break-ins, vandalism, or insurance claims at this property in the last 3 years? What carrier currently insures it and at what premium?
- The area grade is low — what's the realistic commute time and amenity access for the typical tenant pool here? Any planned neighborhood developments (good or bad) we should know about?
- What's the average days-on-market for RENTAL listings here right now (not sales)? A rising rental-DOM trend means longer vacancies and softer asking-rent achievability than the comps imply.
- What's the recent tenant-quality profile in this submarket — average credit score on applications, eviction rate, late-payment / NSF rate, and stable-employment percentage? A property-management company in the area should have these aggregated.
- How much new for-sale + rental construction is in the pipeline within 1–3 miles? Heavy new supply typically softens prices + rents 12–24 months out; constrained supply supports both.
Investment metrics
- 1% rule
- 0.88% ✗
- Cap rate
- 4.94%
- Cash-on-cash
- -4.84%
- DSCR
- 0.78
- GRM
- 9.4
CMA / ARV
- ARV (median comp)
- $260,732
- List price
- $190,000
- Delta
- -27.13%
- Verdict
- UNDERPRICED
- Comps
- 20 within 1.0 mi
Show comp detail 8 sales within ~0.75 mi
| Address | Dist | Beds/Ba | Sqft | Sold | Price | $/sf | Match |
|---|---|---|---|---|---|---|---|
| 31611 Cypress Cir | 0.23mi | 3/2.0 | 1,481 (+2%) | 21mo | $260,000 | $176 | 68 |
| 31611 Waller Tomball Rd | 0.39mi | 3/1.0 | 1,428 (-1%) | 21mo | $214,900 | $150 | 58 |
| 2017 Penick Rd | 0.56mi | 3/2.0 | 1,337 (-8%) | 6mo | $272,500 | $204 | 57 |
| 31910 Waller Tomball Rd | 0.26mi | 3/1.0 | 1,560 (+8%) | 20mo | $160,000 | $103 | 54 |
| 2506 Brazeal St | 0.57mi | 3/1.0 | 1,565 (+8%) | 9mo | $248,500 | $159 | 49 |
| 2315 Dewey St | 0.40mi | 2/2.0 (-1) | 1,292 (-11%) | 13mo | $305,000 | $236 | 48 |
| 2611 Center St | 0.56mi | 2/2.0 (-1) | 1,232 (-15%) | 14mo | $235,000 | $191 | 33 |
| 1219 Alliance St | 0.67mi | 2/1.0 (-1) | 1,288 (-11%) | 13mo | $265,000 | $206 | 31 |
Match score weights: distance 35% · size 25% · config 20% · recency 20%. Top-matched comps best support the ARV.
Projected returns pro-forma
-3.0% appreciation · 0.0% rent growth · sell at horizon
- IRR
- -28.5%
- Equity multiple
- 0.08×
- Total profit
- $-49,195
- Equity at exit
- $28,330
- IRR
- -50.2%
- Equity multiple
- -0.48×
- Total profit
- $-78,751
- Equity at exit
- $16,428
Cash invested: $53,200 (down + closing). Projections, not guarantees.
Landlord ↔ Tenant lean methodology
- Overall (STATE)
- 87 Strongly Landlord-Friendly
- State Texas
- 87 Strongly Landlord-Friendly · R+5
- County
- — inherits STATE
- City
- — inherits STATE
ZIP-level market 77484
- Home prices YoY
- -1.0%
- Rents YoY
- -3.8%
- Active inventory
- 1196
- Price-to-rent
- 9.4×
Monthly cashflow live
- Estimated rent
- $1,677 medium interval (Pro) →
- Mortgage (P&I)
- −$996
- Tax from tax record
- −$464 /mo · $5,567/yr
- Insurance
- −$79
- HOA
- −$0
- Vacancy / Maint / Mgmt
- −$352
- Net cashflow
- $-214
Break-even live
Sensitivity live
| Price | -10% $-107 | -5% $-161 | +0% $-214 | +5% $-268 | +10% $-322 |
|---|---|---|---|---|---|
| Rent | -10% $-347 | -5% $-281 | +0% $-214 | +5% $-148 | +10% $-82 |
| Rate | -1.0pp $-119 | -0.5pp $-166 | base $-214 | +0.5pp $-264 | +1.0pp $-314 |
UW: 25.0% down · 7.5% · 30yr · 1.5% tax · 5.0% vac · 8.0% maint · 8.0% mgmt
Financing live
Cash to close
- Down payment
- $47,500
- Closing costs
- $5,700
- Reserves months
- —
- Total cash needed
- —
Loan-product check · same deal, 3 products live
Conventional
25% down · 7.5% · 30yr
- Down + closing
- —
- Monthly P&I
- —
- Monthly cashflow
- —
- DSCR
- —
- Eligible?
- —
Personal DTI + credit; lowest rate.
DSCR
20% down · 8.5% · 30yr
- Down + closing
- —
- Monthly P&I
- —
- Monthly cashflow
- —
- DSCR
- —
- Eligible?
- —
No personal income docs; deal must DSCR.
Hard money
10% down · 12.0% · 12mo
- Down + closing
- —
- Monthly P&I
- —
- Monthly cashflow
- —
- DSCR
- —
- Eligible?
- —
Short-term bridge; refi at stabilization.
Rent comps 4 comps
| Address | Beds | Baths | Sqft | Rent | $/sqft | DOM | Units | Dist |
|---|---|---|---|---|---|---|---|---|
| 2101 Reinke Rd Waller, TX | 1.0–2.0 | 1.0–2.5 | 865 | $1,650 | $1.91 | 4d | 12 | 0.86mi |
| 510 Alliance St Waller, TX | 4.0 | 2.0 | 1800 | $1,900 | $1.06 | 45d | 1 | 0.89mi |
| 19610 FM 362 Rd Waller, TX | 2.0–3.0 | 2.0 | 901 | $1,490 | $1.65 | 6d | 5 | 1.07mi |
| 19616 Farm to Market 362 Waller, TX | 3.0 | 2.0 | 1005 | $1,180 | $1.17 | 45d | 1 | 1.08mi |
Listing history 35 events
-
2026-06-21days on market $190,000 Active 187 DOM
-
2026-06-18days on market $190,000 Active 184 DOM
-
2026-06-17days on market $190,000 Active 183 DOM
-
2026-06-16days on market $190,000 Active 182 DOM
-
2026-06-15days on market $190,000 Active 181 DOM
-
2026-06-13days on market $190,000 Active 179 DOM
-
2026-06-09days on market $190,000 Active 175 DOM
-
2026-06-08days on market $190,000 Active 174 DOM
-
2026-06-07days on market $190,000 Active 173 DOM
-
2026-06-04days on market $190,000 Active 170 DOM
-
2026-06-03days on market $190,000 Active 169 DOM
-
2026-06-02days on market $190,000 Active 168 DOM
-
2026-06-01days on market $190,000 Active 167 DOM
-
2026-05-31days on market $190,000 Active 166 DOM
-
2026-03-10price $190,000 726-char remark
Show marketing remark (726 chars)
Investor Special! 3 bed, 2 bath home with great layout and oversized yard in a quiet country-style subdivision. Just minutes from Hwy 290 and walking distance to schools, this property is ready for a refresh and full of potential. Home features an open kitchen with granite countertops. The kitchen opens to the family room with a gas fireplace, ideal for future entertaining. Private primary suite offers double sinks, a garden tub, and separate shower. No carpet throughout. Large fenced backyard with room to expand outdoor living or add value. Home needs cosmetic updates but has strong bones and great flow. Perfect opportunity for investors, flippers, or buyers looking to customize and create equity. Priced to sell.
-
2026-01-03price $200,000 726-char remark
Show marketing remark (726 chars)
Investor Special! 3 bed, 2 bath home with great layout and oversized yard in a quiet country-style subdivision. Just minutes from Hwy 290 and walking distance to schools, this property is ready for a refresh and full of potential. Home features an open kitchen with granite countertops. The kitchen opens to the family room with a gas fireplace, ideal for future entertaining. Private primary suite offers double sinks, a garden tub, and separate shower. No carpet throughout. Large fenced backyard with room to expand outdoor living or add value. Home needs cosmetic updates but has strong bones and great flow. Perfect opportunity for investors, flippers, or buyers looking to customize and create equity. Priced to sell.
-
2025-12-16$210,000 Active 726-char remark
Show marketing remark (726 chars)
Investor Special! 3 bed, 2 bath home with great layout and oversized yard in a quiet country-style subdivision. Just minutes from Hwy 290 and walking distance to schools, this property is ready for a refresh and full of potential. Home features an open kitchen with granite countertops. The kitchen opens to the family room with a gas fireplace, ideal for future entertaining. Private primary suite offers double sinks, a garden tub, and separate shower. No carpet throughout. Large fenced backyard with room to expand outdoor living or add value. Home needs cosmetic updates but has strong bones and great flow. Perfect opportunity for investors, flippers, or buyers looking to customize and create equity. Priced to sell.
-
2017-06-01soldstatus
-
2017-05-24soldstatus Sold 507-char remark
Show marketing remark (507 chars)
PRICED TO SELL! 3 BEDROOM, 2 BATH HOME WITH HUGE YARD LOCATED IN A QUIET COUNTRY SUBDIVISION WITHIN WALKING DISTANCE TO SCHOOLS & EZ ACCESS TO HWY 290. GREAT FLOORPLAN W/ LOTS OF CHARACTER! HUGE KITCHEN W/ GRANITE C-TOPS W/ MINI WINDOWS IN BACKSPLASH, ELECTRIC APPLIANCES & FRIDGE. KITCHEN OPENS TO FAMILY ROOM W/ GAS FIREPLACE. PRIVATE MASTER BEDROOM & BATH W/ DOUBLE SINKS, GARDEN TUB & SEP. SHOWER. LARGE OVERSIZED FENCED BACKYARD. NO CARPET! MOTIVATED SELLER! FREE HOME WARRANTY!
-
2017-04-11status Pending 507-char remark
Show marketing remark (507 chars)
PRICED TO SELL! 3 BEDROOM, 2 BATH HOME WITH HUGE YARD LOCATED IN A QUIET COUNTRY SUBDIVISION WITHIN WALKING DISTANCE TO SCHOOLS & EZ ACCESS TO HWY 290. GREAT FLOORPLAN W/ LOTS OF CHARACTER! HUGE KITCHEN W/ GRANITE C-TOPS W/ MINI WINDOWS IN BACKSPLASH, ELECTRIC APPLIANCES & FRIDGE. KITCHEN OPENS TO FAMILY ROOM W/ GAS FIREPLACE. PRIVATE MASTER BEDROOM & BATH W/ DOUBLE SINKS, GARDEN TUB & SEP. SHOWER. LARGE OVERSIZED FENCED BACKYARD. NO CARPET! MOTIVATED SELLER! FREE HOME WARRANTY!
-
2017-04-07$149,990 Active 507-char remark
Show marketing remark (507 chars)
PRICED TO SELL! 3 BEDROOM, 2 BATH HOME WITH HUGE YARD LOCATED IN A QUIET COUNTRY SUBDIVISION WITHIN WALKING DISTANCE TO SCHOOLS & EZ ACCESS TO HWY 290. GREAT FLOORPLAN W/ LOTS OF CHARACTER! HUGE KITCHEN W/ GRANITE C-TOPS W/ MINI WINDOWS IN BACKSPLASH, ELECTRIC APPLIANCES & FRIDGE. KITCHEN OPENS TO FAMILY ROOM W/ GAS FIREPLACE. PRIVATE MASTER BEDROOM & BATH W/ DOUBLE SINKS, GARDEN TUB & SEP. SHOWER. LARGE OVERSIZED FENCED BACKYARD. NO CARPET! MOTIVATED SELLER! FREE HOME WARRANTY!
-
2014-12-05historical
-
2014-10-14$127,000 Active
-
2012-06-30historical
-
2012-04-23$125,000
-
2011-02-17historical
-
2010-11-01$125,000
-
2008-04-21soldstatus
-
2007-12-31historical
-
2007-04-17$119,900
-
2007-04-13historical
-
2007-04-12$125,000
-
2007-04-07historical
-
2006-10-07$125,000
-
1989-05-18soldstatus
ⓘ Source: listings_history table (triggers on properties + properties_extension) + one-shot
backfill from property_details.listing_events for pre-trigger history.
Tax reassessment forecast TX · Resets to sale price
- Current annual tax
- $5,567 · $464/mo
- Projected year-2 tax
- $5,567 · $464/mo
- Expected delta
- $0/yr ($0/mo · 0.0%)
ⓘ Screening estimate from a state-policy table — verify with the county assessor before closing.
Climate risk First Street
- Flood 4/10 Moderate FEMA zone X (unshaded) · 22% chance over 30 yrs
- Wildfire 5/10 Major
- Heat 9/10 Extreme 7 d/yr ≥111°F today · 22 d/yr by 30 yrs out
- Wind 8/10 Severe 99% chance of damaging wind over 30 yrs
- Air quality 2/10 Low 1 unhealthy d/yr today · 1 by 30 yrs out
Nearby sold comps map
Loading sold comps map…
Walkable amenities ~0.75 mi
Loading nearby amenities…
Taxation est. · year 1
- Rental income
- $20,127
- − Mortgage interest
- −$10,643
- − Property taxes
- −$5,567
- − Insurance
- −$950
- − Repairs & maintenance
- −$1,610
- − Management
- −$1,610
- − Depreciation
- −$5,527
- Taxable loss
- −$5,780
- Est. tax savings @ 24.0%
- +$1,387
- After-tax cash flow
- $-1,186/yr
For passive investors: Depreciation is non-cash, so a rental often shows a tax loss while cash-flowing — sheltering income. Rental losses are passive: they offset passive income freely, and up to $25,000/yr can offset ordinary (W-2) income if you actively participate and your MAGI is under $100k (phasing out to $0 by $150k); unused losses carry forward. On sale, claimed depreciation is recaptured at up to 25%, and gains may owe capital-gains tax (a 1031 exchange can defer both). Figures are a year-1 estimate at your 24.0% rate — not tax advice; consult a CPA.
Schools (NCES district)
- District
- Waller ISD
- NCES district ID
- 4844430
- Math proficiency
- 30% ▼ -23.00%
- Reading proficiency
- 35% ▼ -11.00%
- Median HH income
- $58,911
- Composite
- 29.12/100
- National rank
- #6593
- State rank
- #532 of 826 in TX
Livability — Waller
- Score
- 61/100
- State rank
- #1003
- US rank
- #17792
Category grades
Schools grade is shown separately in the Schools card above.
Census & demographics
- Census place
- Waller, TX
- County
- Harris County · 4,702,590 people
- Metro
- Houston-The Woodlands-Sugar Land, TX
- Population (ZIP)
- 14,348
- Household income
- $81,250
- Rent vs Own
- Severe rent burden
- 270.0
Population outlook (Harris County) Hauer SSP2
- Today (2025)
- 5,571,493 people
- By 2030
- 6,089,821 · +9.3%
- By 2040
- 7,142,806 · +28.2%
- By 2050
- 8,185,864 · +46.9%
- By 2075
- 10,574,329 · +89.8%
- By 2100
- 12,109,958 · +117.4%
Race, ethnicity, and origin ACS 2023
- Neighborhood character
- Diverse neighborhood (Simpson 0.66)
- Race & ethnicity
- White 47% Hispanic / Latino 31% Two or more races 16% Black 15%
- Hispanic origin (detail)
- Mexican 30%
- Common ancestry
- Slovak 2% Serbian 2% Iranian 1%
- Foreign-born
- 13% · Canada
- Languages at home
- 73% English-only · Spanish 24% Arabic 2%
Political lean MEDSL · Harris
- 2024 margin
- Lean D (+5.5) · D 52.0% · R 46.4% · Other 1.6%
- 2008→2024 swing
- +3.9pp toward D · 2008: 1.6pp · 2024: 5.5pp
- All cycles
- 2024: D+5.5 2020: D+13.3 2016: D+12.4 2012: D+0.1 2008: D+1.6
Not yet ingested
- Civics
- —
Market trends
- HPI YoY
- ▼ -4.17%
- Current HPI
- 397.85
- Rent YoY
- ▼ -3.77%
- Metro
- Houston-The Woodlands-Sugar Land, TX
- State GDP YoY
- ▲ 3.95%
- F500 in state
- 110
Industry mix (Fortune 500 HQ in TX)
| Industry | F500 HQs | Revenue |
|---|---|---|
| Energy | 16 | $1,198B |
|
||
| Technology | 5 | $198B |
|
||
| Engineering / Construction | 4 | $72B |
|
||
| Energy Services | 3 | $60B |
|
||
| Utilities | 3 | $41B |
|
||
| Healthcare | 2 | $330B |
|
||
Price history
+52.0% since first listed21 events — show timeline
- 2026-03-10 Price Changed $190,000 HARMLS
- 2026-01-03 Price Changed $200,000 HARMLS
- 2025-12-16 Listed $210,000 HARMLS
- 2017-06-01 Sold (Public Records) — Public Records
- 2017-05-24 Sold (MLS) — HARMLS
- 2017-04-11 Pending — HARMLS
- 2017-04-07 Listed $149,990 HARMLS
- 2014-12-05 Listing Removed — HARMLS
- 2014-10-14 Listed $127,000 HARMLS
- 2012-06-30 Listing Removed — HARMLS
- 2012-04-23 Listed $125,000 HARMLS
- 2011-02-17 Listing Removed — HARMLS
- 2010-11-01 Listed $125,000 HARMLS
- 2008-04-21 Sold (Public Records) — Public Records
- 2007-12-31 Listing Removed — HARMLS
- 2007-04-17 Listed $119,900 HARMLS
- 2007-04-13 Listing Removed — HARMLS
- 2007-04-12 Listed $125,000 HARMLS
- 2007-04-07 Listing Removed — HARMLS
- 2006-10-07 Listed $125,000 HARMLS
- 1989-05-18 Sold (Public Records) — Public Records
Property tax history
+7.6%/yrLatest (2025): $5,567 · +13.0% YoY. Source: county tax records.
Cash-flow waterfall
monthlySold comps — $/sqft
last 12 mo · ≤1 miLoading sold comps…