582 Eisenhower Blvd · Lehigh Acres, FL
Flood risk 1/10 · Minimal
- FEMA flood zone
- X (unshaded)
- Chance of flooding over 30 yrs
- 0.0%
- Est. flood insurance / yr
- $507 – $1,088
Fire risk 2/10 · Minimal
- Est. fire insurance / yr
- $947 – $1,759
Heat risk 9/10 · Severe
- Hot days now (above 109°F)
- 6 days/yr
- Hot days in 30 yrs
- 22 days/yr
Wind risk 10/10 · Severe
- Chance of severe wind over 30 yrs
- 99.0%
Air-quality risk 2/10 · Minimal
- Unhealthy air days now
- 1 days/yr
- Unhealthy air days in 30 yrs
- 2 days/yr
Risk factors via First Street. Map © Google.
Why this score? — see what drove the D- grade
The composite is a weighted blend of 9 inputs, each scored 0–100. Each bar is that input's sub-score; the figure is the points it added to the 100-point composite (weight × sub-score).
- Appreciation +10.0/10.0
- ARV discount +7.5/15.0
- Cash flow +6.6/30.0
- Schools +4.1/10.0
- Livability +3.0/5.0
- Condition / age +2.5/5.0
- 1% rule +1.6/10.0
- Rent growth +1.3/5.0
- DSCR +0.8/10.0
$309,900
🖨 Deal sheet 📄 Offer letter ✓ Due diligence
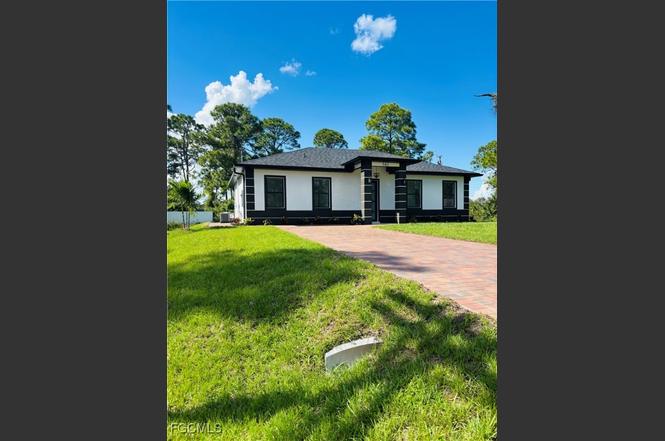
Listing remarks
Welcome to this Stunning 4 bedroom and 3 bathroom modern home, perfectly situated in a quiet, desirable neighborhood, close to grocery and stores. This brand new construction combines sleek design with comfort and functionally, offering everything today's homeowner desires. step inside to an open -concept floor plan that seamlessly connects the living, dining and kitchen areas. Modern white kitchen features premium cabinetry, quart countertop, sleek black fixtures and finishes that create a timeless contrast. Luxurious black and white bathrooms. Enjoy outdoor living in the large, landscaped yard, perfect for relaxation and family to have fun.
Key facts
- Black fixtures
- Landscaped yard
- Premium cabinetry
Tags
Property features AI
Finance
- Other: Zoned RS-1
- Financial info: Pets allowed
- HOA & community: Association fee includes trash
Exterior
- Security: Security/high impact doors
- Utilities: Well water; Septic tank; Cable available
- Home design: Single-story; New construction; Faces east; West exposure on lot
- Construction: Block, concrete, and stucco construction; Shingle roof
- Exterior features: Security/high impact doors; Sprinkler/irrigation system; Patio; Room for pool; Manual sprinklers
Interior
- Kitchen: Microwave; Range; Refrigerator
- Flooring: Tile
- Bathrooms: 3 full bathrooms
- Heating & cooling: Central heating (electric); Ceiling fans
- Interior features: Impact glass windows; Breakfast bar; Tray ceilings
- Laundry & utility: Washer hookup; Dryer hookup
Neighborhood map
What this means for you Summary
Snapshot
- This is a 4-bed/3.0-bath land listed at $310k.
Deal economics
- At list price, monthly cash flow is $-514 ($-6k/yr) — negative.
- To cash-flow at today's rent, offer at most $235k (24.0% below list).
- To meet the 1% rule (rent ≥ 1% of price), the offer needs to be $206k (33.5% below list).
- Recommended offer: $206k (33.5% below list) — sets the bar for 1% rule.
Location & tenants
- Location reads 59/100 on livability (#826 in FL) — a working-class tenant base; expect higher turnover. Strengths: cost of living A+, housing A+; Watch: crime C-, employment D+, schools D-.
- Lee (suburban): math 47% / reading 50% proficiency, ranked #42 of 73 in FL (top 58%) — families likely to look elsewhere, expect single-tenant / working-renter base with shorter leases.
- Market conditions: Rents falling (-4.7%/yr); 2460 active listings in the ZIP; 40 comparable units currently listed for rent nearby; rentals at typical pace (median 19d on market — plan ~3-4 weeks tenant-placement turnaround); 15,411 units permitted in Lee County in 2024 (4,686 in 5+ unit buildings).
- This rent runs 34% of the median local income ($72k/yr) — at the standard rent-burdened threshold; future hikes will face affordability resistance.
Forward outlook
- In year one you build about $33k of equity ($2k loan paydown + $31k appreciation (10.0% local appreciation)).
- Lee County population projected at +44% by 2050 — long-run rental-demand tailwind backs the buy-and-hold thesis.
- By year 2, paydown + projected appreciation supports a ~$53k cash-out refi (75% LTV) — recoverable capital for the next deal without selling this one.
Negotiation context
- It's been on market 236 days — a 12% lower offer ($273k) is reasonable based on typical stale-listing flexibility.
Risks & watch-outs
- Climate carrying-cost: severe wind risk, 99% chance of damaging wind over 30y; extreme-heat days projected 6→22/yr by 2055 (HVAC capex compounding) — expect insurance premiums to compound above CPI over the hold.
Questions for the listing agent
- What do current leases actually rent for vs. the listed asking? Can we see a recent rent roll and the last 12 months of T-12 income?
- It's been on market 236 days. Have you received any prior offers? Is the seller open to a 34% concession, seller financing, or rate buy-down credit?
- Why hasn't it sold? Are there any deal-killer items the seller is aware of (foundation, flood, title, zoning, code violations)?
- Is there a deadline driving the sale (1031 exchange, divorce, estate, relocation)? That informs how much negotiation room exists.
- Schools are D-rated, which usually means shorter tenancies and higher turnover. Who's the typical renter profile here, and what's been the actual vacancy rate?
- The area grade is low — what's the realistic commute time and amenity access for the typical tenant pool here? Any planned neighborhood developments (good or bad) we should know about?
- What's the average days-on-market for RENTAL listings here right now (not sales)? A rising rental-DOM trend means longer vacancies and softer asking-rent achievability than the comps imply.
- What's the recent tenant-quality profile in this submarket — average credit score on applications, eviction rate, late-payment / NSF rate, and stable-employment percentage? A property-management company in the area should have these aggregated.
- How much new for-sale + rental construction is in the pipeline within 1–3 miles? Heavy new supply typically softens prices + rents 12–24 months out; constrained supply supports both.
Investment metrics
- 1% rule
- 0.66% ✗
- Cap rate
- 4.30%
- Cash-on-cash
- -7.11%
- DSCR
- 0.68
- GRM
- 12.5
CMA / ARV
No comps found within radius.
Projected returns pro-forma
10.0% appreciation · 0.0% rent growth · sell at horizon
- IRR
- 18.5%
- Equity multiple
- 2.50×
- Total profit
- $130,009
- Equity at exit
- $279,182
- IRR
- 16.7%
- Equity multiple
- 5.59×
- Total profit
- $397,875
- Equity at exit
- $602,068
Cash invested: $86,772 (down + closing). Projections, not guarantees.
Landlord ↔ Tenant lean methodology
- Overall (STATE)
- 87 Strongly Landlord-Friendly
- State Florida
- 87 Strongly Landlord-Friendly · R+3
- County
- — inherits STATE
- City
- — inherits STATE
ZIP-level market 33974
- Home prices YoY
- 5.8%
- Rents YoY
- -4.7%
- Active inventory
- 2460
- Price-to-rent
- 12.5×
Monthly cashflow live
- Estimated rent
- $2,060 high interval (Pro) →
- Mortgage (P&I)
- −$1,625
- Tax est. 1.5%
- −$387 /mo · $4,648/yr
- Insurance
- −$129
- HOA
- −$0
- Vacancy / Maint / Mgmt
- −$433
- Net cashflow
- $-514
Break-even live
UW: 25.0% down · 7.5% · 30yr · 1.5% tax · 5.0% vac · 8.0% maint · 8.0% mgmt
Financing live
Cash to close
- Down payment
- $77,475
- Closing costs
- $9,297
- Reserves months
- —
- Total cash needed
- —
Loan-product check · same deal, 3 products live
Conventional
25% down · 7.5% · 30yr
- Down + closing
- —
- Monthly P&I
- —
- Monthly cashflow
- —
- DSCR
- —
- Eligible?
- —
Personal DTI + credit; lowest rate.
DSCR
20% down · 8.5% · 30yr
- Down + closing
- —
- Monthly P&I
- —
- Monthly cashflow
- —
- DSCR
- —
- Eligible?
- —
No personal income docs; deal must DSCR.
Hard money
10% down · 12.0% · 12mo
- Down + closing
- —
- Monthly P&I
- —
- Monthly cashflow
- —
- DSCR
- —
- Eligible?
- —
Short-term bridge; refi at stabilization.
Rent comps 40 comps
| Address | Beds | Baths | Sqft | Rent | $/sqft | DOM | Units | Dist |
|---|---|---|---|---|---|---|---|---|
| 954 Pilgrim St E Lehigh Acres, FL | 3.0 | 2.0 | 1246 | $1,625 | $1.30 | 1d | 1 | 0.17mi |
| 928 Milwaukee Blvd Lehigh Acres, FL | 4.0 | 2.0 | 1719 | $1,990 | $1.16 | 23d | 1 | 0.26mi |
| 538 Flamingo Ave S Lehigh Acres, FL | 3.0 | 2.0 | 1272 | $1,791 | $1.41 | 3d | 1 | 0.32mi |
| 538 Cypress Ave S Lehigh Acres, FL | 3.0 | 2.0 | 1055 | $1,699 | $1.61 | 2d | 1 | 0.34mi |
| 908 Winters St E Lehigh Acres, FL | 3.0 | 2.0 | 1639 | $2,200 | $1.34 | 10d | 1 | 0.41mi |
| 635 Hawthorne Ave S Lehigh Acres, FL | 3.0 | 2.0 | 1029 | $1,300 | $1.26 | 23d | 1 | 0.52mi |
| 635 Hawthorne Ave S Lehigh Acres, FL | 3.0 | 2.0 | 1029 | $1,300 | $1.26 | 21d | 1 | 0.52mi |
| 886 Milwaukee Blvd Lehigh Acres, FL | 3.0 | 2.0 | 1205 | $1,900 | $1.58 | 23d | 1 | 0.54mi |
| 940 Sterling St E Lehigh Acres, FL | 4.0 | 2.0 | 1389 | $1,750 | $1.26 | 3d | 1 | 0.57mi |
| 541 Hawthorne Ave S Lehigh Acres, FL | 3.0 | 2.0 | 1634 | $1,921 | $1.18 | 3d | 1 | 0.58mi |
| 556 Sherwood Ave S Lehigh Acres, FL | 3.0 | 2.0 | 1582 | $2,175 | $1.37 | 23d | 1 | 0.58mi |
| 730 Holmes Ave Unit 728 Lehigh Acres, FL | 3.0 | 2.0 | 1080 | $1,500 | $1.39 | 11d | 1 | 0.61mi |
| 874 Apartment St Lehigh Acres, FL | 3.0 | 2.0 | 1200 | $1,750 | $1.46 | 23d | 1 | 0.61mi |
| 970 Lakeside Dr Lehigh Acres, FL | 3.0 | 2.0 | 1325 | $1,800 | $1.36 | 19d | 1 | 0.63mi |
| 862 Charles Sise St E Lehigh Acres, FL | 3.0 | 2.0 | 1582 | $2,664 | $1.68 | 23d | 1 | 0.65mi |
| 708 Genoa Ave S Lehigh Acres, FL | 3.0 | 2.0 | 1055 | $1,650 | $1.56 | 3d | 1 | 0.71mi |
| 756 Holmes Ave Lehigh Acres, FL | 3.0 | 2.0 | 1100 | $1,450 | $1.32 | 10d | 1 | 0.75mi |
| 1018 Kent St E Lehigh Acres, FL | 3.0 | 2.0 | 1600 | $2,000 | $1.25 | 15d | 1 | 0.77mi |
| 761 Kirkman Ave S Lehigh Acres, FL | 3.0 | 2.0 | 1188 | $1,900 | $1.60 | 23d | 1 | 0.79mi |
| 708 Godwid Ave S Lehigh Acres, FL | 3.0 | 2.0 | 1758 | $2,150 | $1.22 | 21d | 1 | 0.83mi |
| 710 Godwid Ave S Lehigh Acres, FL | 3.0 | 2.0 | 1758 | $2,150 | $1.22 | 2d | 1 | 0.84mi |
| 710 Godwid Ave S Lehigh Acres, FL | 3.0 | 2.0 | 1758 | $2,150 | $1.22 | 3d | 1 | 0.84mi |
| 710 Godwid Ave S Lehigh Acres, FL | 3.0 | 2.0 | 1758 | $2,150 | $1.22 | 21d | 1 | 0.84mi |
| 1144 Essex St E Lehigh Acres, FL | 3.0 | 2.0 | 1464 | $1,650 | $1.13 | 19d | 1 | 0.91mi |
| 459 Lockport Ave S Lehigh Acres, FL | 3.0 | 2.0 | 1650 | $2,000 | $1.21 | 23d | 1 | 0.94mi |
| 930 Ainsworth St W Lehigh Acres, FL | 3.0 | 2.0 | 1165 | $1,395 | $1.20 | 15d | 1 | 0.98mi |
| 1147 Antonio St E Lehigh Acres, FL | 3.0 | 2.0 | 1713 | $2,300 | $1.34 | 1d | 1 | 0.99mi |
| 442 Genoa Ave S Lehigh Acres, FL | 4.0 | 2.0 | 1365 | $1,750 | $1.28 | 3d | 1 | 0.99mi |
| 684 Thomas Sherwin Ave S Lehigh Acres, FL | 3.0 | 2.0 | 1288 | $1,695 | $1.32 | 3d | 1 | 0.99mi |
| 604 Thomas Sherwin Ave S Lehigh Acres, FL | 4.0 | 2.0 | 1493 | $2,200 | $1.47 | 3d | 1 | 1.00mi |
| 637 Montclair Ave S Lehigh Acres, FL | 3.0 | 2.0 | 1497 | $1,660 | $1.11 | 23d | 1 | 1.04mi |
| 947 Grant Blvd Lehigh Acres, FL | 4.0 | 2.0 | 1650 | $2,145 | $1.30 | 23d | 1 | 1.06mi |
| 819 Eisenhower Blvd Unit 819 Lehigh Acres, FL | 3.0 | 2.0 | 1390 | $1,650 | $1.19 | 23d | 1 | 1.07mi |
| 925 Chenault St Lehigh Acres, FL | 3.0 | 2.0 | 1132 | $1,700 | $1.50 | 23d | 1 | 1.08mi |
| 927 Chenault St Lehigh Acres, FL | 3.0 | 2.0 | 1132 | $1,700 | $1.50 | 23d | 1 | 1.08mi |
| 762 Gallo Ave S #764 Lehigh Acres, FL | 3.0 | 2.0 | 1127 | $1,195 | $1.06 | 21d | 1 | 1.09mi |
| 573 Bell Blvd S Lehigh Acres, FL | 3.0 | 2.0 | 1218 | $1,900 | $1.56 | 14d | 1 | 1.10mi |
| 827 Eisenhower Blvd Lehigh Acres, FL | 3.0 | 2.5 | 1640 | $1,780 | $1.09 | 11d | 1 | 1.11mi |
| 382 McArthur Blvd Lehigh Acres, FL | 3.0 | 2.0 | 1055 | $2,200 | $2.09 | 23d | 1 | 1.11mi |
| 763 Puccini Ave S Lehigh Acres, FL | 3.0 | 2.0 | 1055 | $1,699 | $1.61 | 2d | 1 | 1.13mi |
Listing history 12 events
-
2026-06-17days on market $309,900 Active 236 DOM
-
2026-06-16days on market $309,900 Active 235 DOM
-
2026-06-16days on market $309,900 Active 234 DOM
-
2026-06-13days on market $309,900 Active 232 DOM
-
2026-06-09days on market $309,900 Active 228 DOM
-
2026-06-07days on market $309,900 Active 226 DOM
-
2026-06-02days on market $309,900 Active 221 DOM
-
2026-06-01days on market $309,900 Active 220 DOM
-
2026-06-01days on market $309,900 Active 219 DOM
-
2026-05-04price $309,900
-
2026-03-31price $319,900
-
2025-10-24$329,900 Active
ⓘ Source: listings_history table (triggers on properties + properties_extension) + one-shot
backfill from property_details.listing_events for pre-trigger history.
Climate risk First Street
- Flood 1/10 Low FEMA zone X (unshaded) · 0% chance over 30 yrs
- Wildfire 2/10 Low
- Heat 9/10 Extreme 6 d/yr ≥109°F today · 22 d/yr by 30 yrs out
- Wind 10/10 Extreme 99% chance of damaging wind over 30 yrs
- Air quality 2/10 Low 1 unhealthy d/yr today · 2 by 30 yrs out
Nearby sold comps map
Loading sold comps map…
Walkable amenities ~0.75 mi
Loading nearby amenities…
Taxation est. · year 1
- Rental income
- $24,717
- − Mortgage interest
- −$17,359
- − Property taxes
- −$4,648
- − Insurance
- −$1,550
- − Repairs & maintenance
- −$1,977
- − Management
- −$1,977
- − Depreciation
- −$9,015
- Taxable loss
- −$11,810
- Est. tax savings @ 24.0%
- +$2,834
- After-tax cash flow
- $-3,339/yr
For passive investors: Depreciation is non-cash, so a rental often shows a tax loss while cash-flowing — sheltering income. Rental losses are passive: they offset passive income freely, and up to $25,000/yr can offset ordinary (W-2) income if you actively participate and your MAGI is under $100k (phasing out to $0 by $150k); unused losses carry forward. On sale, claimed depreciation is recaptured at up to 25%, and gains may owe capital-gains tax (a 1031 exchange can defer both). Figures are a year-1 estimate at your 24.0% rate — not tax advice; consult a CPA.
Schools (NCES district)
- District
- Lee
- NCES district ID
- 1201080
- Math proficiency
- 47% ▼ -11.00%
- Reading proficiency
- 50% ▼ -4.00%
- Median HH income
- $49,518
- Composite
- 41.49/100
- National rank
- #3458
- State rank
- #42 of 73 in FL
Livability — Lehigh Acres
- Score
- 59/100
- State rank
- #826
- US rank
- #20055
Category grades
Schools grade is shown separately in the Schools card above.
Census & demographics
- Census place
- Lehigh Acres, FL
- County
- Lee County · 788,662 people
- City population
- 130,638
- Metro
- Cape Coral-Fort Myers, FL
- Population (ZIP)
- 19,927
- Household income
- $72,192
- Rent vs Own
- Severe rent burden
- 434.0
Population outlook (Lee County) Hauer SSP2
- Today (2025)
- 871,946 people
- By 2030
- 955,468 · +9.6%
- By 2040
- 1,113,587 · +27.7%
- By 2050
- 1,256,891 · +44.1%
- By 2075
- 1,560,270 · +78.9%
- By 2100
- 1,726,848 · +98.0%
Race, ethnicity, and origin ACS 2023
- Neighborhood character
- Diverse neighborhood (Simpson 0.64)
- Race & ethnicity
- Hispanic / Latino 52% Two or more races 31% White 26% Black 18%
- Hispanic origin (detail)
- Mexican 12% Puerto Rican 7% Cuban 20% Dominican 4%
- Common ancestry
- Hispanic 7% Italian 1% Portuguese 1%
- Foreign-born
- 32% · Canada, Jamaica
- Languages at home
- 48% English-only · Spanish 43% French/Haitian/Cajun 7% Other Indo-European 1%
Political lean MEDSL · Lee
- 2024 margin
- Strong R (+28.4) · D 35.5% · R 63.9%
- 2008→2024 swing
- -18.0pp toward R · 2008: -10.4pp · 2024: -28.4pp
- All cycles
- 2024: R+28.4 2020: R+19.2 2016: R+20.4 2012: R+16.6 2008: R+10.4
Not yet ingested
- Civics
- —
Market trends
- HPI YoY
- ▲ 16.53%
- Current HPI
- 303.3399
- Rent YoY
- ▼ -4.68%
- Metro
- Cape Coral-Fort Myers, FL
- State GDP YoY
- ▲ 3.28%
- F500 in state
- 36
Industry mix (Fortune 500 HQ in FL)
| Industry | F500 HQs | Revenue |
|---|---|---|
| Industrial Technology | 2 | $29B |
|
||
| Insurance | 2 | $17B |
|
||
| Retail | 1 | $60B |
|
||
| Technology Distribution | 1 | $58B |
|
||
| Homebuilding | 1 | $35B |
|
||
| Technology Manufacturing | 1 | $35B |
|
||
Price history
-6.1% since first listed3 events — show timeline
- 2026-05-04 Price Changed $309,900 FORTMLS
- 2026-03-31 Price Changed $319,900 FORTMLS
- 2025-10-24 Listed $329,900 FORTMLS
Property tax history
+17.9%/yrLatest (2025): $442 · +17.0% YoY. Source: county tax records.
Cash-flow waterfall
monthlySold comps — $/sqft
last 12 mo · ≤1 miLoading sold comps…