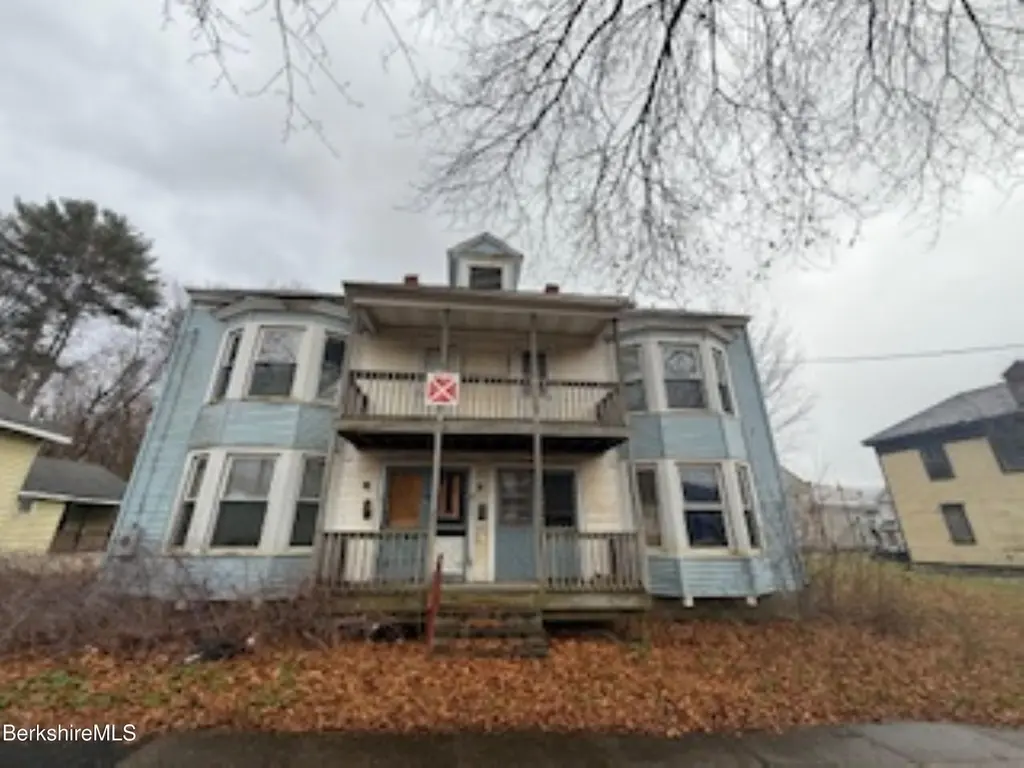
 Fourplex
32-38 Spring St · North Adams, MA
Flood risk 8/10 · Major
- FEMA flood zone
- X
- Chance of flooding over 30 yrs
- 0.99%
- Est. flood insurance / yr
- $473 – $860
Fire risk 1/10 · Minimal
- Est. fire insurance / yr
- $915 – $1,699
Heat risk 3/10 · Minor
- Hot days now (above 92°F)
- 9 days/yr
- Hot days in 30 yrs
- 20 days/yr
Wind risk 4/10 · Minor
- Chance of severe wind over 30 yrs
- 9.0%
Air-quality risk 2/10 · Minimal
- Unhealthy air days now
- 0 days/yr
- Unhealthy air days in 30 yrs
- 1 days/yr
Risk factors via First Street. Map © Google.
Why this score? — see what drove the B grade
The composite is a weighted blend of 9 inputs, each scored 0–100. Each bar is that input's sub-score; the figure is the points it added to the 100-point composite (weight × sub-score).
- Cash flow +30.0/30.0
- ARV discount +15.0/15.0
- 1% rule +10.0/10.0
- DSCR +10.0/10.0
- Livability +2.8/5.0
- Rent growth +2.5/5.0
- Appreciation +1.9/10.0
- Schools +1.8/10.0
- Condition / age +1.0/5.0
$200,000
🖨 Deal sheet 📄 Offer letter ✓ Due diligence
Multi-family units
County records classify this as Multi-Family (2-4 Unit). Listing-text estimate: 4 units. confirmed
Listing remarks MLS
This is a four-family property. Property is VACANT. Seller is conveying lot 56-A & Lot 56-B Updated mechanicals ready for the next owner to complete. Each unit has 2 bedrooms, 1 bathroom, and a bigger living room space with windows that allow lots of natural light to shine through. The kitchen is a moderate size giving enough area for people to maneuver. The property is located close to schools, restaurants, convenience stores, Mass College of Liberal Arts, and Mass MoCA.
Key facts
- Close to schools
- Natural light
- Updated mechanicals
Tags
Neighborhood map
What this means for you Summary
Snapshot
- This is a 4 × 2-bed/1.0-bath units multifamily listed at $200k. Condition is rated poor.
Deal economics
- At list price, monthly cash flow is $4k ($46k/yr) — positive. Per door: $967/mo.
- The deal already cash-flows at list — no discount required.
- Meets the 1% rule at list price ($7k rent vs $200k).
- Recommended offer: $176k (12.0% below list) — sets the bar for market timing.
- Cap rate 29.8% vs local median 5.8% in North Adams — top-decile yield for the area; either an underpriced asset or a hidden risk that comps aren't pricing in. Stress-test before assuming the spread holds.
Location & tenants
- Location reads 55/100 on livability (#242 in MA) — a working-class tenant base; expect higher turnover. Strengths: housing A+, cost of living A-; Watch: employment C-, health & safety D, schools F.
- North Adams (town): math 14% / reading 29% proficiency, ranked #291 of 302 in MA (top 96%) — low school quality limits family demand, transient renter base, plan for 1-2y turnover.
- Market conditions: 99 active listings in the ZIP; 130 units permitted in Berkshire County in 2024 (10 in 5+ unit buildings).
Forward outlook
- Local home prices are declining (-3.0%/yr); year-one equity from $1k of loan paydown is wiped out by about $6k of value loss. Plan a longer hold.
- Berkshire County population projected at -24% by 2050 — secular population decline; favor cash flow + early exit over multi-decade hold.
- At projected returns (-3.0% appreciation + 3.0% rent growth), your $56k cash investment doubles in ~2 years — after that, you're playing with house money.
Negotiation context
- It's been on market 184 days — a 12% lower offer ($176k) is reasonable based on typical stale-listing flexibility.
- 8 sale attempts since 22y ago with the ask held roughly flat each time — persistent listings suggest the price (not the market) is what's stuck; bring a comps-based counter.
- Current owner paid $27k; list at $200k implies a 641% gain — meaningful room to come down on a strong offer.
Risks & watch-outs
- Watch-outs: flood insurance adds $56/mo; built in 1860 — expect roof / HVAC / electrical / plumbing capex.
- Climate carrying-cost: severe flood risk — expect insurance premiums to compound above CPI over the hold.
Questions for the listing agent
- It's been on market 184 days. Have you received any prior offers? Is the seller open to a 12% concession, seller financing, or rate buy-down credit?
- Can we see the unit-by-unit rent roll, current vacancy, and any below-market leases? What's the average tenancy length?
- What capital expenditures (roof, boiler, parking lot, exteriors) have been made in the last 5 years, and what's planned in the next 2?
- Have any recent inspections been done? Can we get a copy of the seller's disclosures and any deferred-maintenance estimates?
- Built in 1860 — when were the roof, HVAC, electrical panel, plumbing, and water heater last replaced?
- What's the actual annual flood-insurance premium (NFIP or private), and is the property in a SFHA with mandatory coverage?
- Why hasn't it sold? Are there any deal-killer items the seller is aware of (foundation, flood, title, zoning, code violations)?
- Is there a deadline driving the sale (1031 exchange, divorce, estate, relocation)? That informs how much negotiation room exists.
- Schools are F-rated, which usually means shorter tenancies and higher turnover. Who's the typical renter profile here, and what's been the actual vacancy rate?
- Crime grade is F in this area — have there been break-ins, vandalism, or insurance claims at this property in the last 3 years? What carrier currently insures it and at what premium?
- What's the average days-on-market for RENTAL listings here right now (not sales)? A rising rental-DOM trend means longer vacancies and softer asking-rent achievability than the comps imply.
- What's the recent tenant-quality profile in this submarket — average credit score on applications, eviction rate, late-payment / NSF rate, and stable-employment percentage? A property-management company in the area should have these aggregated.
- How much new apartment / multifamily construction is in the pipeline within 1–3 miles? Heavy new supply (>2% of stock underway) typically softens rents 12–24 months out; light construction supports rent growth.
Investment metrics
- 1% rule
- 3.36% ✓
- Cap rate
- 29.84%
- Cash-on-cash
- 84.09%
- DSCR
- 4.74
- GRM
- 2.5
CMA / ARV
- ARV (median comp)
- $277,368
- List price
- $200,000
- Delta
- -27.89%
- Verdict
- UNDERPRICED
- Comps
- 20 within 1.0 mi
Projected returns pro-forma
-3.0% appreciation · 3.0% rent growth · sell at horizon
- IRR
- 83.2%
- Equity multiple
- 4.82×
- Total profit
- $214,129
- Equity at exit
- $29,821
- IRR
- 86.5%
- Equity multiple
- 10.01×
- Total profit
- $504,291
- Equity at exit
- $17,292
Cash invested: $56,000 (down + closing). Projections, not guarantees.
Landlord ↔ Tenant lean methodology
- Overall (STATE)
- 20 Strongly Tenant-Friendly
- State Massachusetts
- 20 Strongly Tenant-Friendly · D+15
- County
- — inherits STATE
- City
- — inherits STATE
ZIP-level market 01247
- Home prices YoY
- -2.0%
- Active inventory
- 99
- Price-to-rent
- 9.9×
Monthly cashflow live
- Estimated rent
- $6,717 high interval (Pro) →
- Mortgage (P&I)
- −$1,049
- Tax est. 1.5%
- −$250 /mo · $3,000/yr
- Insurance
- −$83
- Flood insurance flood zone
- −$56 /mo · $666/yr
- HOA
- −$0
- Vacancy / Maint / Mgmt
- −$1,411
- Net cashflow
- $3,869
Break-even live
4-unit breakdown (identical units grouped — click to expand)
| Units | Beds | Baths | Est. rent |
|---|---|---|---|
| 4× units | 2 | 1 | $6,716 |
| #1 | 2 | 1 | $1,679 |
| #2 | 2 | 1 | $1,679 |
| #3 | 2 | 1 | $1,679 |
| #4 | 2 | 1 | $1,679 |
| Total (4 units) | $6,717 | ||
UW: 25.0% down · 7.5% · 30yr · 1.5% tax · 5.0% vac · 8.0% maint · 8.0% mgmt
Financing live
Cash to close
- Down payment
- $50,000
- Closing costs
- $6,000
- Reserves months
- —
- Total cash needed
- —
Loan-product check · same deal, 3 products live
Conventional
25% down · 7.5% · 30yr
- Down + closing
- —
- Monthly P&I
- —
- Monthly cashflow
- —
- DSCR
- —
- Eligible?
- —
Personal DTI + credit; lowest rate.
DSCR
20% down · 8.5% · 30yr
- Down + closing
- —
- Monthly P&I
- —
- Monthly cashflow
- —
- DSCR
- —
- Eligible?
- —
No personal income docs; deal must DSCR.
Hard money
10% down · 12.0% · 12mo
- Down + closing
- —
- Monthly P&I
- —
- Monthly cashflow
- —
- DSCR
- —
- Eligible?
- —
Short-term bridge; refi at stabilization.
Listing history 21 events
-
2026-06-07statusdays on market $200,000 Pending 184 DOM
-
2026-06-04days on market $200,000 Active 183 DOM
-
2026-06-02days on market $200,000 Active 182 DOM
-
2026-06-01days on market $200,000 Active 181 DOM
-
2026-05-31days on market $200,000 Active 180 DOM
-
2026-05-31days on market $200,000 Active 179 DOM
-
2025-12-02$200,000 Active 481-char remark
Show marketing remark (481 chars)
This is a four-family property. Property is VACANT. Seller is conveying lot 56-A & Lot 56-B Updated mechanicals ready for the next owner to complete. Each unit has 2 bedrooms, 1 bathroom, and a bigger living room space with windows that allow lots of natural light to shine through. The kitchen is a moderate size giving enough area for people to maneuver. The property is located close to schools, restaurants, convenience stores, Mass College of Liberal Arts, and Mass MoCA.
-
2009-01-09soldstatus $27,000 206-char remark
Show marketing remark (206 chars)
Real Four Family being sold 'as-is...where is'. Subject property has had many updates. Plumbing is missing, there are broken windows, graffiti and residual personal items. Seller will not clean property.
-
2008-10-31$25,000 206-char remark
Show marketing remark (206 chars)
Real Four Family being sold 'as-is...where is'. Subject property has had many updates. Plumbing is missing, there are broken windows, graffiti and residual personal items. Seller will not clean property.
-
2008-06-13historical
-
2008-06-06$49,900
-
2008-03-01historical
-
2008-02-14$59,900
-
2005-05-03soldstatus $159,000
-
2005-03-31historical
-
2005-02-15$159,000
-
2005-02-15$159,000
-
2004-11-12soldstatus $144,000
-
2004-08-26$145,000
-
2004-06-29historical
-
2004-06-26$149,900
ⓘ Source: listings_history table (triggers on properties + properties_extension) + one-shot
backfill from property_details.listing_events for pre-trigger history.
Climate risk First Street
- Flood 8/10 Severe FEMA zone X · 99% chance over 30 yrs
- Wildfire 1/10 Low
- Heat 3/10 Moderate 9 d/yr ≥92°F today · 20 d/yr by 30 yrs out
- Wind 4/10 Moderate 9% chance of damaging wind over 30 yrs
- Air quality 2/10 Low 0 unhealthy d/yr today · 1 by 30 yrs out
Nearby sold comps map
Loading sold comps map…
Walkable amenities ~0.75 mi
Loading nearby amenities…
Taxation est. · year 1
- Rental income
- $80,604
- − Mortgage interest
- −$11,203
- − Property taxes
- −$3,000
- − Insurance
- −$1,666
- − Repairs & maintenance
- −$6,448
- − Management
- −$6,448
- − Depreciation
- −$5,818
- Taxable income
- $46,020
- Est. tax owed @ 24.0%
- −$11,045
- After-tax cash flow
- $35,380/yr
For passive investors: Depreciation is non-cash, so a rental often shows a tax loss while cash-flowing — sheltering income. Rental losses are passive: they offset passive income freely, and up to $25,000/yr can offset ordinary (W-2) income if you actively participate and your MAGI is under $100k (phasing out to $0 by $150k); unused losses carry forward. On sale, claimed depreciation is recaptured at up to 25%, and gains may owe capital-gains tax (a 1031 exchange can defer both). Figures are a year-1 estimate at your 24.0% rate — not tax advice; consult a CPA.
Condition & rehab AI · 12 photos
This four-family property requires extensive repairs and cleaning. Immediate safety and aesthetic issues need addressing to increase its value.
Repairs flagged
- Major Exposed wiring in kitchen — Safety hazard
- Major Exposed plumbing in bathrooms — Safety hazard
- Major Broken windows — Structural integrity
- Major Peeling paint — Safety hazard and aesthetic issue
- Major Debris throughout the property — Safety hazard and aesthetic issue
Value-add opportunities
- Both Clean and repair exposed wiring and plumbing — Safety and functionality
- Both Replace broken windows — Safety and aesthetics
- Both Paint interior walls and exterior — Aesthetics and safety
- Both Remove debris and clean property — Safety and aesthetics
Renovation cost estimate screening
| Repair item | Severity | Est. cost |
|---|---|---|
| Exposed wiring in kitchen · Safety hazard | Major | $15,000–50,000 |
| Exposed plumbing in bathrooms · Safety hazard | Major | $15,000–50,000 |
| Broken windows · Structural integrity | Major | $15,000–50,000 |
| Peeling paint · Safety hazard and aesthetic issue | Major | $15,000–50,000 |
| Debris throughout the property · Safety hazard and aesthetic issue | Major | $15,000–50,000 |
| Total estimated repair cost · 5 items | $75,000–250,000 |
Value-add ROI direction
- Both Clean and repair exposed wiring and plumbing — Safety and functionality ↑
- Both Replace broken windows — Safety and aesthetics ↑
- Both Paint interior walls and exterior — Aesthetics and safety ↑
- Both Remove debris and clean property — Safety and aesthetics ↑
ⓘ Cost ranges are severity-bucket heuristics (US national rule-of-thumb). Get contractor quotes + a written scope before underwriting a rehab budget.
Schools (NCES district)
- District
- North Adams
- NCES district ID
- 2508670
- Math proficiency
- 14% ▼ -13.00%
- Reading proficiency
- 29% ▼ -11.00%
- Median HH income
- $36,746
- Composite
- 17.83/100
- National rank
- #9006
- State rank
- #291 of 302 in MA
Livability — North Adams
- Score
- 55/100
- State rank
- #242
- US rank
- #23506
Category grades
Schools grade is shown separately in the Schools card above.
Census & demographics
- Census place
- North Adams, MA
- City population
- 14,967
- Population (ZIP)
- 14,967
Population outlook (Berkshire County) Hauer SSP2
- Today (2025)
- 119,723 people
- By 2030
- 114,608 · -4.3%
- By 2040
- 102,806 · -14.1%
- By 2050
- 91,305 · -23.7%
- By 2075
- 71,517 · -40.3%
- By 2100
- 57,988 · -51.6%
Race, ethnicity, and origin ACS 2023
- Neighborhood character
- Predominantly White (88%)
- Race & ethnicity
- White 88% Hispanic / Latino 5% Two or more races 4% Asian 3%
- Hispanic origin (detail)
- Puerto Rican 1%
- Common ancestry
- Lithuanian 15% Romanian 4% German 2%
- Foreign-born
- 5% · Canada
- Languages at home
- 95% English-only · Other Indo-European 2% Spanish 2% French/Haitian/Cajun 0%
Political lean MEDSL · Berkshire
- 2024 margin
- Solid D (+39.9) · D 68.9% · R 29.0% · Other 2.1%
- 2008→2024 swing
- -12.5pp toward R · 2008: 52.4pp · 2024: 39.9pp
- All cycles
- 2024: D+39.9 2020: D+47.1 2016: D+41.5 2012: D+53.7 2008: D+52.4
Not yet ingested
- Civics
- —
Market trends
- HPI YoY
- ▼ -6.22%
- Current HPI
- 298.8949
- Rent YoY
- —
- Metro
- —
- State GDP YoY
- ▲ 2.28%
- F500 in state
- 38
Industry mix (Fortune 500 HQ in MA)
| Industry | F500 HQs | Revenue |
|---|---|---|
| Technology | 3 | $17B |
|
||
| Insurance | 2 | $84B |
|
||
| Retail | 2 | $76B |
|
||
| Life Sciences | 1 | $43B |
|
||
| Energy Technology | 1 | $31B |
|
||
| Aerospace / Defense | 1 | $18B |
|
||
Price history
+33.4% since first listed15 events — show timeline
- 2025-12-02 Listed $200,000 BCMLS
- 2009-01-09 Sold (MLS) $27,000 BCMLS
- 2008-10-31 Listed $25,000 BCMLS
- 2008-06-13 Listing Removed — BCMLS
- 2008-06-06 Listed $49,900 BCMLS
- 2008-03-01 Listing Removed — BCMLS
- 2008-02-14 Listed $59,900 BCMLS
- 2005-05-03 Sold (MLS) $159,000 BCMLS
- 2005-03-31 Listing Removed — BCMLS
- 2005-02-15 Listed $159,000 BCMLS
- 2005-02-15 Listed $159,000 BCMLS
- 2004-11-12 Sold (MLS) $144,000 BCMLS
- 2004-08-26 Listed $145,000 BCMLS
- 2004-06-29 Listing Removed — BCMLS
- 2004-06-26 Listed $149,900 BCMLS
Cash-flow waterfall
monthlySold comps — $/sqft
last 12 mo · ≤1 miLoading sold comps…