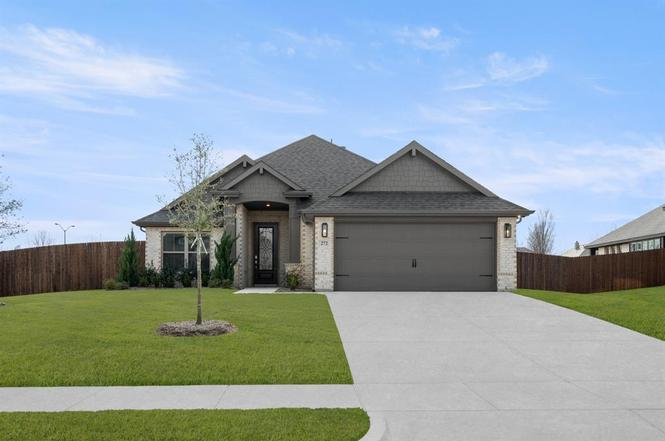
272 Sparkling Springs Dr · Waxahachie, TX
Flood risk No data
- FEMA flood zone
- —
- Chance of flooding over 30 yrs
- —
- Est. flood insurance / yr
- —
Fire risk No data
- Est. fire insurance / yr
- —
Heat risk No data
- Hot days now (above threshold)
- —
- Hot days in 30 yrs
- —
Wind risk No data
- Chance of severe wind over 30 yrs
- —
Air-quality risk No data
- Unhealthy air days now
- —
- Unhealthy air days in 30 yrs
- —
Risk factors via First Street. Map © Google.
Why this score? — see what drove the F grade
The composite is a weighted blend of 9 inputs, each scored 0–100. Each bar is that input's sub-score; the figure is the points it added to the 100-point composite (weight × sub-score).
- ARV discount +7.5/15.0
- Cash flow +7.3/30.0
- Schools +3.9/10.0
- Livability +3.9/5.0
- Rent growth +3.4/5.0
- Condition / age +2.5/5.0
- DSCR +1.5/10.0
- 1% rule +1.0/10.0
- Appreciation +0.0/10.0
$419,900
🖨 Deal sheet 📄 Offer letter ✓ Due diligence
Listing remarks
MLS# 21102518 - Built by J Houston Homes - Ready Now! ~ Welcome to your new home at 272 Sparkling Springs in Waxahachie, TX. This stunning single-story John Houston home was built in 2025 in the Oasis at North Grove community. This lovely home features an inviting craftsman-style brick exterior, a modern 8-foot front door, and numerous amenities to support a luxurious lifestyle. With four bedrooms and two baths, the Boston floor plan offers over 1,900 square feet of living space. One of the bedrooms could also be converted into a spacious office with a walk-in closet and muted, neutral colors. Experience the versatility of a spacious kitchen featuring exotic white and gray marble counters,
Key facts
- 0.27 acre lot
- 2 garage spots
- Community pool
Property features AI
Finance
- Other: Subdivision: The Oasis; Directions: From Hwy 77 North, Right on Northgrove Blvd to The Oasis of Northgrove entrance; County: Ellis
- Financial info: Treat as clear loan type; No second mortgage
- HOA & community: Mandatory association with annual fee; Annual association fee of $500 (management fees included); HOA managed by Jhouston (866-460-8528); Community features include a community pool, curbs, jogging/bike path, park, and sidewalks
Exterior
- Parking: Attached 2-car garage; Covered parking for 2 vehicles; 2-car single door garage
- Utilities: City water; City sewer; No municipal utility district
- Home design: Single family residence; One story; Residential property; New construction (completed in 2024)
- Construction: Brick and rock/stone exterior; Composition roof; Slab foundation; Built in 2024
- Exterior features: Wood fencing; Covered patio/porch
Interior
- Kitchen: Dishwasher; Disposal
- Bedrooms: Primary bedroom on main level (16 x 15); Bedroom on main level (10 x 11); Bedroom on second level (10 x 10); Bedroom on main level (11 x 10)
- Flooring: Carpet; Ceramic tile; Wood
- Bathrooms: 2 full bathrooms
- Heating & cooling: Central heating (electric); Central air conditioning (electric)
- Interior features: Cable TV available; Decorative lighting; One living area; One dining area; Six total rooms
Neighborhood map
What this means for you Summary
Snapshot
- This is a 4-bed/2.0-bath land listed at $420k.
Deal economics
- At list price, monthly cash flow is $-551 ($-7k/yr) — negative.
- To cash-flow at today's rent, offer at most $323k (23.2% below list).
- To meet the 1% rule (rent ≥ 1% of price), the offer needs to be $251k (40.2% below list).
- Recommended offer: $251k (40.2% below list) — sets the bar for 1% rule.
- Cap rate 4.7% vs local median 3.3% in Waxahachie — top-decile yield for the area; either an underpriced asset or a hidden risk that comps aren't pricing in. Stress-test before assuming the spread holds.
Location & tenants
- Location reads 78/100 on livability (#71 in TX, #2,592 nationally) — a middle-class / working-renter tenant base. Strengths: cost of living A+, housing A+, employment A-; Watch: commute F.
- Waxahachie ISD (suburban): math 45% / reading 44% proficiency, ranked #253 of 826 in TX (top 31%) — families likely to look elsewhere, expect single-tenant / working-renter base with shorter leases.
- Zoned schools: Simpson El (math 51% / reading 51%, grade C-, #818 of 4,322 statewide, top 19%, 627 students, 32% FRL) — zoned schools average 32% FRL vs 48% district-wide (16 pts lower); this property's tenant base skews higher-income than the district average.
- Market conditions: Rents rising (+3.4%/yr); 854 active listings in the ZIP; 23 comparable units currently listed for rent nearby; rentals at typical pace (median 19d on market — plan ~3-4 weeks tenant-placement turnaround); solid renter incomes; 3,016 units permitted in Ellis County in 2024 (20 in 5+ unit buildings).
- This rent runs 35% of the median local income ($86k/yr) — at the standard rent-burdened threshold; future hikes will face affordability resistance.
Forward outlook
- Local home prices are declining (-3.0%/yr); year-one equity from $3k of loan paydown is wiped out by about $13k of value loss. Plan a longer hold.
- Ellis County population projected at +36% by 2050 — long-run rental-demand tailwind backs the buy-and-hold thesis.
Negotiation context
- It's been on market 122 days — a 12% lower offer ($370k) is reasonable based on typical stale-listing flexibility.
- 2 sale attempts with the ask held roughly flat each time — persistent listings suggest the price (not the market) is what's stuck; bring a comps-based counter.
Questions for the listing agent
- What do current leases actually rent for vs. the listed asking? Can we see a recent rent roll and the last 12 months of T-12 income?
- It's been on market 122 days. Have you received any prior offers? Is the seller open to a 40% concession, seller financing, or rate buy-down credit?
- What does the HOA fee cover, when was the last increase, and are there any pending special assessments or reserve-fund shortfalls?
- Why hasn't it sold? Are there any deal-killer items the seller is aware of (foundation, flood, title, zoning, code violations)?
- Is there a deadline driving the sale (1031 exchange, divorce, estate, relocation)? That informs how much negotiation room exists.
- Schools are B-rated — typically a magnet for longer-tenancy family renters. What's the average tenant stay here, and is there a school-zone premium baked into asking?
- The area grade is low — what's the realistic commute time and amenity access for the typical tenant pool here? Any planned neighborhood developments (good or bad) we should know about?
- What's the average days-on-market for RENTAL listings here right now (not sales)? A rising rental-DOM trend means longer vacancies and softer asking-rent achievability than the comps imply.
- What's the recent tenant-quality profile in this submarket — average credit score on applications, eviction rate, late-payment / NSF rate, and stable-employment percentage? A property-management company in the area should have these aggregated.
- How much new for-sale + rental construction is in the pipeline within 1–3 miles? Heavy new supply typically softens prices + rents 12–24 months out; constrained supply supports both.
Investment metrics
- 1% rule
- 0.60% ✗
- Cap rate
- 4.72%
- Cash-on-cash
- -5.63%
- DSCR
- 0.75
- GRM
- 13.9
CMA / ARV
No comps found within radius.
Projected returns pro-forma
-3.0% appreciation · 3.4% rent growth · sell at horizon
- IRR
- -25.6%
- Equity multiple
- 0.13×
- Total profit
- $-102,328
- Equity at exit
- $62,608
- IRR
- -21.2%
- Equity multiple
- -0.11×
- Total profit
- $-130,882
- Equity at exit
- $36,305
Cash invested: $117,572 (down + closing). Projections, not guarantees.
Landlord ↔ Tenant lean methodology
- Overall (STATE)
- 87 Strongly Landlord-Friendly
- State Texas
- 87 Strongly Landlord-Friendly · R+5
- County
- — inherits STATE
- City
- — inherits STATE
ZIP-level market 75165
- Home prices YoY
- -24.5%
- Rents YoY
- 3.4%
- Active inventory
- 854
- Price-to-rent
- 13.9×
Monthly cashflow live
- Estimated rent
- $2,511 high interval (Pro) →
- Mortgage (P&I)
- −$2,202
- Tax from tax record
- −$116 /mo · $1,395/yr
- Insurance
- −$175
- HOA
- −$42
- Vacancy / Maint / Mgmt
- −$527
- Net cashflow
- $-551
Break-even live
UW: 25.0% down · 7.5% · 30yr · 1.5% tax · 5.0% vac · 8.0% maint · 8.0% mgmt
Financing live
Cash to close
- Down payment
- $104,975
- Closing costs
- $12,597
- Reserves months
- —
- Total cash needed
- —
Loan-product check · same deal, 3 products live
Conventional
25% down · 7.5% · 30yr
- Down + closing
- —
- Monthly P&I
- —
- Monthly cashflow
- —
- DSCR
- —
- Eligible?
- —
Personal DTI + credit; lowest rate.
DSCR
20% down · 8.5% · 30yr
- Down + closing
- —
- Monthly P&I
- —
- Monthly cashflow
- —
- DSCR
- —
- Eligible?
- —
No personal income docs; deal must DSCR.
Hard money
10% down · 12.0% · 12mo
- Down + closing
- —
- Monthly P&I
- —
- Monthly cashflow
- —
- DSCR
- —
- Eligible?
- —
Short-term bridge; refi at stabilization.
Rent comps 23 comps
| Address | Beds | Baths | Sqft | Rent | $/sqft | DOM | Units | Dist |
|---|---|---|---|---|---|---|---|---|
| 217 Resting Place Rd Waxahachie, TX | 3.0 | 3.0 | 2521 | $2,800 | $1.11 | 24d | 1 | 0.21mi |
| 217 Resting Place Rd Waxahachie, TX | 3.0 | 3.0 | 2533 | $2,800 | $1.11 | 22d | 1 | 0.21mi |
| 116 Aucuba Ln Waxahachie, TX | 4.0 | 2.0 | 2140 | $2,850 | $1.33 | 43d | 1 | 0.30mi |
| 1873 Ethereal Ln Waxahachie, TX | 3.0 | 2.5 | 1680 | $2,350 | $1.40 | 43d | 1 | 0.35mi |
| 1909 Ethereal Ln Waxahachie, TX | 3.0 | 2.5 | 1663 | $2,400 | $1.44 | 43d | 1 | 0.36mi |
| 1773 Refuge Way Waxahachie, TX | 3.0 | 2.5 | 1392 | $2,250 | $1.62 | 18d | 1 | 0.38mi |
| 2186 Liriope Ln Waxahachie, TX | 4.0 | 3.0 | 2590 | $2,829 | $1.09 | 22d | 1 | 0.39mi |
| 500 Restoration Rd Waxahachie, TX | 3.0 | 2.5 | 1361 | $2,250 | $1.65 | 18d | 1 | 0.39mi |
| 1785 Refuge Way Waxahachie, TX | 3.0 | 2.5 | 1365 | $2,250 | $1.65 | 43d | 1 | 0.40mi |
| 1785 Refuge Way Waxahachie, TX | 3.0 | 2.5 | 1365 | $2,250 | $1.65 | 13d | 1 | 0.40mi |
| 1789 Refuge Way Waxahachie, TX | 3.0 | 2.5 | 1392 | $2,250 | $1.62 | 18d | 1 | 0.41mi |
| 1789 Refuge Way Waxahachie, TX | 3.0 | 2.5 | 1392 | $2,250 | $1.62 | 13d | 1 | 0.41mi |
| 488 Restoration Rd Waxahachie, TX | 3.0 | 2.5 | 1362 | $2,250 | $1.65 | 18d | 1 | 0.41mi |
| 440 Restoration Rd Waxahachie, TX | 3.0 | 2.5 | 1362 | $2,250 | $1.65 | 11d | 1 | 0.41mi |
| 484 Restoration Rd Waxahachie, TX | 3.0 | 2.5 | 1392 | $2,250 | $1.62 | 18d | 1 | 0.41mi |
| 480 Restoration Rd Waxahachie, TX | 3.0 | 2.5 | 1392 | $2,250 | $1.62 | 43d | 1 | 0.42mi |
| 1801 Refuge Way Waxahachie, TX | 3.0 | 2.5 | 1392 | $2,250 | $1.62 | 7d | 1 | 0.43mi |
| 468 Restoration Rd Waxahachie, TX | 3.0 | 2.5 | 1392 | $2,400 | $1.72 | 10d | 1 | 0.43mi |
| 472 Restoration Rd Waxahachie, TX | 3.0 | 2.5 | 1392 | $2,250 | $1.62 | 18d | 1 | 0.44mi |
| 1566 Country Crest Dr Waxahachie, TX | 4.0 | 2.5 | 2568 | $2,900 | $1.13 | 43d | 1 | 0.62mi |
| 155 Lakeside Dr Waxahachie, TX | 1.0–3.0 | 1.0–2.0 | 990 | $1,999 | $2.02 | 1d | 7 | 0.89mi |
| 1250 U.S. 287 Waxahachie, TX | 1.0–3.0 | 1.0–2.0 | 1042 | $2,319 | $2.22 | 2d | 17 | 1.17mi |
| 213 Nocona Dr Waxahachie, TX | 5.0 | 2.0 | 2516 | $9,750 | $3.88 | 43d | 1 | 1.41mi |
HOA detail
- Monthly dues
- $42 · $504/yr
Listing history 10 events
-
2026-05-01status Pending
-
2026-03-26price $419,900
-
2026-02-02price $429,990
-
2026-01-31price $419,990
-
2026-01-24price $429,990
-
2025-12-31price $419,990
-
2025-12-30status Active
-
2025-11-04price $424,900
-
2025-11-03status Pending
-
2025-11-01$439,900 Active
ⓘ Source: listings_history table (triggers on properties + properties_extension) + one-shot
backfill from property_details.listing_events for pre-trigger history.
Tax reassessment forecast TX · Resets to sale price
- Current annual tax
- $1,395 · $116/mo
- Projected year-2 tax
- $7,684 · $640/mo
- Expected delta
- +$6,289/yr (+$524/mo · 450.7%)
ⓘ Screening estimate from a state-policy table — verify with the county assessor before closing.
Nearby sold comps map
Loading sold comps map…
Walkable amenities ~0.75 mi
Loading nearby amenities…
Taxation est. · year 1
- Rental income
- $30,136
- − Mortgage interest
- −$23,521
- − Property taxes
- −$1,395
- − Insurance
- −$2,100
- − Repairs & maintenance
- −$2,411
- − Management
- −$2,411
- − HOA
- −$504
- − Depreciation
- −$12,215
- Taxable loss
- −$14,421
- Est. tax savings @ 24.0%
- +$3,461
- After-tax cash flow
- $-3,155/yr
For passive investors: Depreciation is non-cash, so a rental often shows a tax loss while cash-flowing — sheltering income. Rental losses are passive: they offset passive income freely, and up to $25,000/yr can offset ordinary (W-2) income if you actively participate and your MAGI is under $100k (phasing out to $0 by $150k); unused losses carry forward. On sale, claimed depreciation is recaptured at up to 25%, and gains may owe capital-gains tax (a 1031 exchange can defer both). Figures are a year-1 estimate at your 24.0% rate — not tax advice; consult a CPA.
Schools (NCES district)
- District
- Waxahachie ISD
- NCES district ID
- 4844730
- Math proficiency
- 45% ▼ -7.00%
- Reading proficiency
- 44% ▼ -6.00%
- Median HH income
- $59,434
- Composite
- 39.14/100
- National rank
- #4034
- State rank
- #253 of 826 in TX
Livability — Waxahachie
- Score
- 78/100
- State rank
- #71
- US rank
- #2592
Category grades
Schools grade is shown separately in the Schools card above.
Census & demographics
- Census place
- Waxahachie, TX
- County
- Ellis County · 199,237 people
- City population
- 67,417
- Metro
- Dallas-Fort Worth-Arlington, TX
- Population (ZIP)
- 53,513
- Household income
- $86,391
- Rent vs Own
- Severe rent burden
- 1365.0
Population outlook (Ellis County) Hauer SSP2
- Today (2025)
- 194,556 people
- By 2030
- 209,679 · +7.8%
- By 2040
- 238,837 · +22.8%
- By 2050
- 265,451 · +36.4%
- By 2075
- 326,571 · +67.9%
- By 2100
- 362,156 · +86.1%
Race, ethnicity, and origin ACS 2023
- Neighborhood character
- Diverse neighborhood (Simpson 0.60)
- Race & ethnicity
- White 56% Hispanic / Latino 26% Black 14% Two or more races 13%
- Hispanic origin (detail)
- Mexican 22%
- Common ancestry
- Slovak 2% Lithuanian 2% Italian 2%
- Foreign-born
- 7% · Canada
- Languages at home
- 84% English-only · Spanish 15%
Political lean MEDSL · Ellis
- 2024 margin
- Solid R (+31.1) · D 34.0% · R 65.1%
- 2008→2024 swing
- +11.2pp toward D · 2008: -42.2pp · 2024: -31.1pp
- All cycles
- 2024: R+31.1 2020: R+34.1 2016: R+45.4 2012: R+47.5 2008: R+42.2
Not yet ingested
- Civics
- —
Market trends
- HPI YoY
- ▼ -82.58%
- Current HPI
- 255.0247
- Rent YoY
- ▲ 3.40%
- Metro
- Dallas-Fort Worth-Arlington, TX
- State GDP YoY
- ▲ 3.95%
- F500 in state
- 110
Industry mix (Fortune 500 HQ in TX)
| Industry | F500 HQs | Revenue |
|---|---|---|
| Energy | 16 | $1,198B |
|
||
| Technology | 5 | $198B |
|
||
| Engineering / Construction | 4 | $72B |
|
||
| Energy Services | 3 | $60B |
|
||
| Utilities | 3 | $41B |
|
||
| Healthcare | 2 | $330B |
|
||
Price history
-4.5% since first listed10 events — show timeline
- 2026-05-01 Pending — NTREIS
- 2026-03-26 Price Changed $419,900 NTREIS
- 2026-02-02 Price Changed $429,990 NTREIS
- 2026-01-31 Price Changed $419,990 NTREIS
- 2026-01-24 Price Changed $429,990 NTREIS
- 2025-12-31 Price Changed $419,990 NTREIS
- 2025-12-30 Relisted — NTREIS
- 2025-11-04 Price Changed $424,900 NTREIS
- 2025-11-03 Pending — NTREIS
- 2025-11-01 Listed $439,900 NTREIS
Property tax history
+90.2%/yrLatest (2025): $1,395 · +0.0% YoY. Source: county tax records.
Cash-flow waterfall
monthlySold comps — $/sqft
last 12 mo · ≤1 miLoading sold comps…