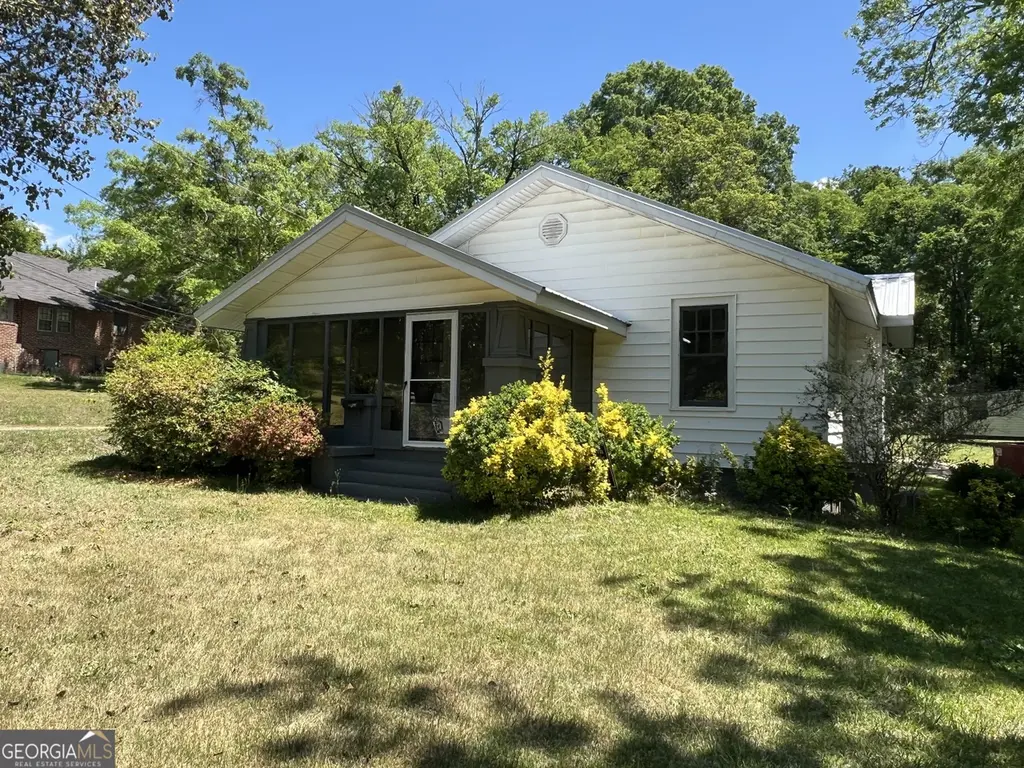
1604 Us Hwy 29 · West Point, GA
Flood risk 1/10 · Minimal
- FEMA flood zone
- X (unshaded)
- Chance of flooding over 30 yrs
- 0.0%
- Est. flood insurance / yr
- $507 – $1,088
Fire risk 4/10 · Minor
- Est. fire insurance / yr
- $963 – $1,789
Heat risk 6/10 · Moderate
- Hot days now (above 106°F)
- 7 days/yr
- Hot days in 30 yrs
- 19 days/yr
Wind risk 6/10 · Moderate
- Chance of severe wind over 30 yrs
- 59.0%
Air-quality risk 3/10 · Minor
- Unhealthy air days now
- 3 days/yr
- Unhealthy air days in 30 yrs
- 4 days/yr
Risk factors via First Street. Map © Google.
Why this score? — see what drove the C- grade
The composite is a weighted blend of 9 inputs, each scored 0–100. Each bar is that input's sub-score; the figure is the points it added to the 100-point composite (weight × sub-score).
- Cash flow +16.2/30.0
- ARV discount +15.0/15.0
- DSCR +5.0/10.0
- 1% rule +3.6/10.0
- Livability +2.9/5.0
- Rent growth +2.5/5.0
- Condition / age +2.5/5.0
- Schools +2.3/10.0
- Appreciation +0.0/10.0
$160,000
🖨 Deal sheet 📄 Offer letter ✓ Due diligence
Listing remarks MLS
Charming and well-loved! This adorable 3-bedroom, 1.5-bath home has been proudly owned and cared for by the same owner for 45 years-showing true pride of ownership throughout. Nestled in a great area, it offers inviting curb appeal and a yard with tons of potential to make your own. Full of warmth and character. Also has a tall crawl space that offers more than storage with ample headroom, it offers flexibility for hobbies or workshop. This is the perfect place to call home! Call today for your private viewing!
Key facts
- Yard with potential
- Curb appeal
- Tall crawl space
Tags
Neighborhood map
What this means for you Summary
Snapshot
- This is a 3-bed/1.5-bath single-family listed at $160k.
Deal economics
- At list price, monthly cash flow is $85 ($1k/yr) — positive.
- The deal already cash-flows at list — no discount required.
- To meet the 1% rule (rent ≥ 1% of price), the offer needs to be $138k (13.6% below list).
- Recommended offer: $138k (13.6% below list) — sets the bar for 1% rule.
- Cap rate 6.9% vs local median 3.2% in West Point — top-decile yield for the area; either an underpriced asset or a hidden risk that comps aren't pricing in. Stress-test before assuming the spread holds.
Location & tenants
- Location reads 57/100 on livability (#473 in GA) — a working-class tenant base; expect higher turnover. Strengths: cost of living A+, crime A, housing B+; Watch: schools F, amenities F, commute F.
- Troup County (rural): math 26% / reading 29% proficiency, ranked #109 of 174 in GA (top 63%) — low school quality limits family demand, transient renter base, plan for 1-2y turnover.
- Market conditions: 76 active listings in the ZIP; 3 comparable units currently listed for rent nearby; rentals at typical pace (median 21d on market — plan ~3-4 weeks tenant-placement turnaround); 474 units permitted in Troup County in 2024 (87 in 5+ unit buildings).
Forward outlook
- Local home prices are declining (-3.0%/yr); year-one equity from $1k of loan paydown is wiped out by about $5k of value loss. Plan a longer hold.
- Troup County population projected at +15% by 2050 — long-run rental-demand tailwind backs the buy-and-hold thesis.
Negotiation context
- It's been on market 60 days — a 3% lower offer ($155k) is reasonable based on typical stale-listing flexibility.
Risks & watch-outs
- Watch-outs: built in 1946 — expect roof / HVAC / electrical / plumbing capex.
- Climate carrying-cost: major wind risk, 59% chance of damaging wind over 30y; extreme-heat days projected 7→19/yr by 2055 (HVAC capex compounding) — expect insurance premiums to compound above CPI over the hold.
Questions for the listing agent
- It's been on market 60 days. Have you received any prior offers? Is the seller open to a 14% concession, seller financing, or rate buy-down credit?
- Built in 1946 — when were the roof, HVAC, electrical panel, plumbing, and water heater last replaced?
- Is there a deadline driving the sale (1031 exchange, divorce, estate, relocation)? That informs how much negotiation room exists.
- Schools are F-rated, which usually means shorter tenancies and higher turnover. Who's the typical renter profile here, and what's been the actual vacancy rate?
- What's the average days-on-market for RENTAL listings here right now (not sales)? A rising rental-DOM trend means longer vacancies and softer asking-rent achievability than the comps imply.
- What's the recent tenant-quality profile in this submarket — average credit score on applications, eviction rate, late-payment / NSF rate, and stable-employment percentage? A property-management company in the area should have these aggregated.
- How much new for-sale + rental construction is in the pipeline within 1–3 miles? Heavy new supply typically softens prices + rents 12–24 months out; constrained supply supports both.
Investment metrics
- 1% rule
- 0.86% ✗
- Cap rate
- 6.93%
- Cash-on-cash
- 2.28%
- DSCR
- 1.10
- GRM
- 9.6
CMA / ARV
- ARV (median comp)
- $223,062
- List price
- $160,000
- Delta
- -28.27%
- Verdict
- UNDERPRICED
- Comps
- 20 within 1.0 mi
Show comp detail 10 sales within ~0.75 mi
| Address | Dist | Beds/Ba | Sqft | Sold | Price | $/sf | Match |
|---|---|---|---|---|---|---|---|
| 1505 Wisteria Dr | 0.24mi | 3/2.0 | 1,483 (+5%) | 5mo | $282,000 | $190 | 75 |
| 1702 Rosemont Ave | 0.18mi | 3/1.5 | 1,499 (+6%) | 20mo | $220,000 | $147 | 65 |
| 1515 Wisteria Dr | 0.33mi | 3/2.0 | 1,504 (+6%) | 14mo | $250,000 | $166 | 61 |
| 1517 Wisteria Dr | 0.34mi | 3/2.0 | 1,483 (+5%) | 17mo | $249,900 | $169 | 61 |
| 1511 Wisteria Dr | 0.30mi | 3/2.0 | 1,523 (+7%) | 21mo | $275,000 | $181 | 54 |
| 1009 Avenue K | 0.62mi | 3/2.0 | 1,467 (+4%) | 12mo | $100,000 | $68 | 53 |
| 1806 Azalea Dr | 0.35mi | 4/2.0 (+1) | 1,564 (+10%) | 18mo | $229,900 | $147 | 45 |
| 106 Sunset Dr | 0.69mi | 3/1.5 | 1,219 (-14%) | 6mo | $199,900 | $164 | 39 |
| 1008 Avenue G Ave | 0.64mi | 3/2.0 | 1,586 (+12%) | 23mo | $178,000 | $112 | 29 |
| 112 Sunset Dr | 0.69mi | 4/2.0 (+1) | 1,630 (+15%) | 15mo | $225,000 | $138 | 24 |
Match score weights: distance 35% · size 25% · config 20% · recency 20%. Top-matched comps best support the ARV.
Projected returns pro-forma
-3.0% appreciation · 3.0% rent growth · sell at horizon
- IRR
- -12.7%
- Equity multiple
- 0.54×
- Total profit
- $-20,544
- Equity at exit
- $23,857
- IRR
- -3.7%
- Equity multiple
- 0.75×
- Total profit
- $-11,069
- Equity at exit
- $13,834
Cash invested: $44,800 (down + closing). Projections, not guarantees.
Landlord ↔ Tenant lean methodology
- Overall (STATE)
- 90 Strongly Landlord-Friendly
- State Georgia
- 90 Strongly Landlord-Friendly · R+3
- County
- — inherits STATE
- City
- — inherits STATE
ZIP-level market 31833
- Home prices YoY
- -13.3%
- Active inventory
- 76
- Price-to-rent
- 9.6×
Monthly cashflow live
- Estimated rent
- $1,382 medium interval (Pro) →
- Mortgage (P&I)
- −$839
- Tax from tax record
- −$101 /mo · $1,214/yr
- Insurance
- −$67
- HOA
- −$0
- Vacancy / Maint / Mgmt
- −$290
- Net cashflow
- $85
Break-even live
UW: 25.0% down · 7.5% · 30yr · 1.5% tax · 5.0% vac · 8.0% maint · 8.0% mgmt
Financing live
Cash to close
- Down payment
- $40,000
- Closing costs
- $4,800
- Reserves months
- —
- Total cash needed
- —
Loan-product check · same deal, 3 products live
Conventional
25% down · 7.5% · 30yr
- Down + closing
- —
- Monthly P&I
- —
- Monthly cashflow
- —
- DSCR
- —
- Eligible?
- —
Personal DTI + credit; lowest rate.
DSCR
20% down · 8.5% · 30yr
- Down + closing
- —
- Monthly P&I
- —
- Monthly cashflow
- —
- DSCR
- —
- Eligible?
- —
No personal income docs; deal must DSCR.
Hard money
10% down · 12.0% · 12mo
- Down + closing
- —
- Monthly P&I
- —
- Monthly cashflow
- —
- DSCR
- —
- Eligible?
- —
Short-term bridge; refi at stabilization.
Rent comps 3 comps
| Address | Beds | Baths | Sqft | Rent | $/sqft | DOM | Units | Dist |
|---|---|---|---|---|---|---|---|---|
| 500 E 7th St West Point, GA | 3.0 | 2.0 | 1308 | $1,600 | $1.22 | 21d | 1 | 0.92mi |
| 505 E 5th St West Point, GA | 3.0 | 1.0 | 1354 | $1,295 | $0.96 | 21d | 1 | 1.03mi |
| 813 3rd Ave Unit K West Point, GA | 2.0 | 2.5 | 1100 | $1,200 | $1.09 | 21d | 1 | 1.04mi |
Listing history 17 events
-
2026-06-19days on market $160,000 Active 60 DOM
-
2026-06-18days on market $160,000 Active 59 DOM
-
2026-06-17days on market $160,000 Active 58 DOM
-
2026-06-16days on market $160,000 Active 57 DOM
-
2026-06-15days on market $160,000 Active 56 DOM
-
2026-06-14days on market $160,000 Active 54 DOM
-
2026-06-12days on market $160,000 Active 53 DOM
-
2026-06-09days on market $160,000 Active 50 DOM
-
2026-06-08days on market $160,000 Active 49 DOM
-
2026-06-07statusdays on market $160,000 Active 48 DOM
-
2026-06-05days on market $160,000 Price Change 45 DOM
-
2026-06-03pricestatus $160,000 Price Change 43 DOM
-
2026-06-02days on market $167,500 Active 43 DOM
-
2026-06-01days on market $167,500 Active 42 DOM
-
2026-05-31days on market $167,500 Active 41 DOM
-
2026-05-30days on market $167,500 Active 40 DOM
-
2026-04-20$167,500 New 521-char remark
Show marketing remark (521 chars)
Charming and well-loved! This adorable 3-bedroom, 1.5-bath home has been proudly owned and cared for by the same owner for 45 years-showing true pride of ownership throughout. Nestled in a great area, it offers inviting curb appeal and a yard with tons of potential to make your own. Full of warmth and character. Also has a tall crawl space that offers more than storage with ample headroom, it offers flexibility for hobbies or workshop. This is the perfect place to call home! Call today for your private viewing!
ⓘ Source: listings_history table (triggers on properties + properties_extension) + one-shot
backfill from property_details.listing_events for pre-trigger history.
Tax reassessment forecast GA · Resets to sale price
- Current annual tax
- $1,214 · $101/mo
- Projected year-2 tax
- $1,472 · $123/mo
- Expected delta
- +$258/yr (+$21/mo · 21.2%)
ⓘ Screening estimate from a state-policy table — verify with the county assessor before closing.
Climate risk First Street
- Flood 1/10 Low FEMA zone X (unshaded) · 0% chance over 30 yrs
- Wildfire 4/10 Moderate
- Heat 6/10 Major 7 d/yr ≥106°F today · 19 d/yr by 30 yrs out
- Wind 6/10 Major 59% chance of damaging wind over 30 yrs
- Air quality 3/10 Moderate 3 unhealthy d/yr today · 4 by 30 yrs out
Nearby sold comps map
Loading sold comps map…
Walkable amenities ~0.75 mi
Loading nearby amenities…
Taxation est. · year 1
- Rental income
- $16,588
- − Mortgage interest
- −$8,962
- − Property taxes
- −$1,214
- − Insurance
- −$800
- − Repairs & maintenance
- −$1,327
- − Management
- −$1,327
- − Depreciation
- −$4,655
- Taxable loss
- −$1,697
- Est. tax savings @ 24.0%
- +$407
- After-tax cash flow
- $1,429/yr
For passive investors: Depreciation is non-cash, so a rental often shows a tax loss while cash-flowing — sheltering income. Rental losses are passive: they offset passive income freely, and up to $25,000/yr can offset ordinary (W-2) income if you actively participate and your MAGI is under $100k (phasing out to $0 by $150k); unused losses carry forward. On sale, claimed depreciation is recaptured at up to 25%, and gains may owe capital-gains tax (a 1031 exchange can defer both). Figures are a year-1 estimate at your 24.0% rate — not tax advice; consult a CPA.
Schools (NCES district)
- District
- Troup County
- NCES district ID
- 1300001
- Math proficiency
- 26% ▼ -10.00%
- Reading proficiency
- 29% ▼ -4.00%
- Median HH income
- $41,354
- Composite
- 23.3/100
- National rank
- #7920
- State rank
- #109 of 174 in GA
Livability — West Point
- Score
- 57/100
- State rank
- #473
- US rank
- #22231
Category grades
Schools grade is shown separately in the Schools card above.
Census & demographics
- Census place
- West Point, GA
- Population (ZIP)
- 6,718
Population outlook (Troup County) Hauer SSP2
- Today (2025)
- 75,537 people
- By 2030
- 78,250 · +3.6%
- By 2040
- 83,184 · +10.1%
- By 2050
- 87,167 · +15.4%
- By 2075
- 95,643 · +26.6%
- By 2100
- 94,234 · +24.8%
Race, ethnicity, and origin ACS 2023
- Neighborhood character
- Diverse neighborhood (Simpson 0.56)
- Race & ethnicity
- White 49% Black 45% Hispanic / Latino 5% Two or more races 2%
- Common ancestry
- Romanian 2% Iranian 1% Scottish 1%
- Foreign-born
- 2% · Canada
- Languages at home
- 94% English-only · Spanish 5% German/W. Germanic 2%
Political lean MEDSL · Troup
- 2024 margin
- Strong R (+24.4) · D 37.6% · R 62.0%
- 2008→2024 swing
- -5.4pp toward R · 2008: -19.0pp · 2024: -24.4pp
- All cycles
- 2024: R+24.4 2020: R+21.9 2016: R+23.4 2012: R+17.8 2008: R+19.0
Not yet ingested
- Civics
- —
Market trends
- HPI YoY
- ▼ -37.96%
- Current HPI
- 247.7196
- Rent YoY
- —
- Metro
- —
- State GDP YoY
- ▲ 2.66%
- F500 in state
- 28
Industry mix (Fortune 500 HQ in GA)
| Industry | F500 HQs | Revenue |
|---|---|---|
| Paper / Packaging | 2 | $29B |
|
||
| Retail | 1 | $160B |
|
||
| Transportation / Logistics | 1 | $91B |
|
||
| Airlines | 1 | $62B |
|
||
| Consumer Goods | 1 | $47B |
|
||
| Utilities | 1 | $25B |
|
||
Price history
1 event — show timeline
- 2026-04-20 Listed $167,500 GAMLS
Property tax history
+6.5%/yrLatest (2025): $1,214 · +130.0% YoY. Source: county tax records.
Cash-flow waterfall
monthlySold comps — $/sqft
last 12 mo · ≤1 miLoading sold comps…