665 Mount Hunger Rd · Lisle, NY
Flood risk 1/10 · Minimal
- FEMA flood zone
- X (unshaded)
- Chance of flooding over 30 yrs
- 0.0%
- Est. flood insurance / yr
- $507 – $1,088
Fire risk 3/10 · Minor
- Est. fire insurance / yr
- $691 – $1,283
Heat risk 2/10 · Minimal
- Hot days now (above 92°F)
- 7 days/yr
- Hot days in 30 yrs
- 14 days/yr
Wind risk 2/10 · Minimal
- Chance of severe wind over 30 yrs
- 1.0%
Air-quality risk 2/10 · Minimal
- Unhealthy air days now
- 0 days/yr
- Unhealthy air days in 30 yrs
- 1 days/yr
Risk factors via First Street. Map © Google.
Why this score? — see what drove the D+ grade
The composite is a weighted blend of 9 inputs, each scored 0–100. Each bar is that input's sub-score; the figure is the points it added to the 100-point composite (weight × sub-score).
- ARV discount +11.8/15.0
- Appreciation +8.8/10.0
- Cash flow +8.2/30.0
- Schools +4.3/10.0
- Livability +2.9/5.0
- Rent growth +2.5/5.0
- Condition / age +2.5/5.0
- DSCR +2.2/10.0
- 1% rule +2.0/10.0
$175,000
🖨 Deal sheet (PDF) 📄 Offer letter ✓ Due diligence
Listing remarks MLS
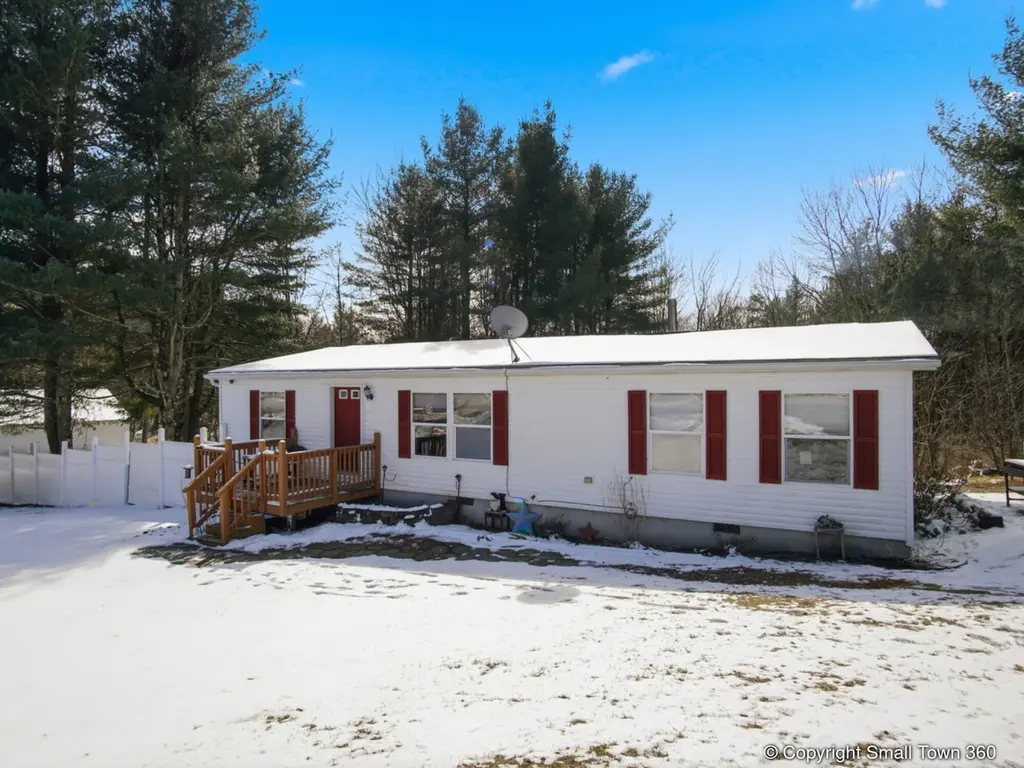
Back on the market due to financing - no issues with the property. Come see this beautiful, rural property, featuring 4 amazing acres with hiking trails and access to a pond, right out your back door. Hang out on the full length back deck and enjoy the quiet. The side yard is fully fenced in with access from the deck. One level living in this updated, well maintained mobile home. The kitchen has lots of cupboard and storage space and the island seats two, right next to the dining room table. Open layout with nice size living area and 3 bedrooms including the primary suite w/ newly updated bathroom. There is a second full bath right across from the two other bedrooms. The large laundry room is also a perfect mud room with plenty of space for storage. Plus, there are two sheds for additional storage.
Key facts
- Large deck
- Walk-in closet
- 4 acres
Tags
Neighborhood map
What this means for you Summary
Snapshot
- This is a 3-bed/2.0-bath manufactured listed at $175k.
Deal economics
- At list price, monthly cash flow is $-165 ($-2k/yr) — negative.
- To cash-flow at today's rent, offer at most $146k (16.6% below list).
- To meet the 1% rule (rent ≥ 1% of price), the offer needs to be $123k (29.8% below list).
- Recommended offer: $123k (29.8% below list) — sets the bar for 1% rule.
Location & tenants
- Location reads 57/100 on livability (#1,090 in NY) — a working-class tenant base; expect higher turnover. Strengths: cost of living A+, housing A+; Watch: health & safety D, crime F, amenities F.
- Whitney Point Central School District (rural): math 47% / reading 52% proficiency, ranked #390 of 590 in NY (top 66%) — families likely to look elsewhere, expect single-tenant / working-renter base with shorter leases.
- Zoned schools: Caryl E Adams Primary School (math 67% / reading 62%, grade B, #591 of 2,108 statewide, top 31%, 463 students, 54% FRL); Tioughnioga Riverside Academy (math 33% / reading 49%, grade F, #402 of 729 statewide, top 56%, 516 students, 54% FRL); Whitney Point Senior High School (math 92%, 402 students, 56% FRL).
- Market conditions: 3 active listings in the ZIP; 340 units permitted in Broome County in 2024 (269 in 5+ unit buildings).
Forward outlook
- In year one you build about $14k of equity ($1k loan paydown + $13k appreciation (7.6% local appreciation)).
- Broome County population projected at -13% by 2050 — secular population decline; favor cash flow + early exit over multi-decade hold.
- By year 3, paydown + projected appreciation supports a ~$36k cash-out refi (75% LTV) — recoverable capital for the next deal without selling this one.
Negotiation context
- Only 4 days on market — expect competitive offers; lowballing is unlikely to land.
- 8 sale attempts since 13y ago with the ask held roughly flat each time — persistent listings suggest the price (not the market) is what's stuck; bring a comps-based counter.
- Current owner paid $135k; 30% above their basis — modest negotiation headroom, anchor on the comps not their cost.
Questions for the listing agent
- What do current leases actually rent for vs. the listed asking? Can we see a recent rent roll and the last 12 months of T-12 income?
- Is there a deadline driving the sale (1031 exchange, divorce, estate, relocation)? That informs how much negotiation room exists.
- Schools are F-rated, which usually means shorter tenancies and higher turnover. Who's the typical renter profile here, and what's been the actual vacancy rate?
- Crime grade is F in this area — have there been break-ins, vandalism, or insurance claims at this property in the last 3 years? What carrier currently insures it and at what premium?
- The area grade is low — what's the realistic commute time and amenity access for the typical tenant pool here? Any planned neighborhood developments (good or bad) we should know about?
- What's the average days-on-market for RENTAL listings here right now (not sales)? A rising rental-DOM trend means longer vacancies and softer asking-rent achievability than the comps imply.
- What's the recent tenant-quality profile in this submarket — average credit score on applications, eviction rate, late-payment / NSF rate, and stable-employment percentage? A property-management company in the area should have these aggregated.
- How much new for-sale + rental construction is in the pipeline within 1–3 miles? Heavy new supply typically softens prices + rents 12–24 months out; constrained supply supports both.
Investment metrics
- 1% rule
- 0.70% ✗
- Cap rate
- 5.16%
- Cash-on-cash
- -4.04%
- DSCR
- 0.82
- GRM
- 11.9
CMA / ARV
- ARV (on-the-fly)
- $193,536
- Comps found
- 1
Show comp detail 1 sale within ~0.75 mi
| Address | Dist | Beds/Ba | Sqft | Sold | Price | $/sf | Match |
|---|---|---|---|---|---|---|---|
| 665 Mount Hunger Rd | 0.00mi | 3/2.0 | 1,310 (-2%) | 1mo | $188,000 | $144 | 95 |
Match score weights: distance 35% · size 25% · config 20% · recency 20%. Top-matched comps best support the ARV.
Projected returns pro-forma
7.57% appreciation · 3.0% rent growth · sell at horizon
- IRR
- 15.9%
- Equity multiple
- 2.16×
- Total profit
- $56,756
- Equity at exit
- $127,842
- IRR
- 15.5%
- Equity multiple
- 4.52×
- Total profit
- $172,378
- Equity at exit
- $249,040
Cash invested: $49,000 (down + closing). Projections, not guarantees.
Landlord ↔ Tenant lean methodology
- Overall (STATE)
- 15 Strongly Tenant-Friendly
- State New York
- 15 Strongly Tenant-Friendly · D+10
- County
- — inherits STATE
- City
- — inherits STATE
ZIP-level market 13797
- Home prices YoY
- 2.3%
- Active inventory
- 3
- Price-to-rent
- 11.9×
Monthly cashflow live
- Estimated rent
- $1,229 medium interval (Pro) →
- Mortgage (P&I)
- −$918
- Tax from tax record
- −$145 /mo · $1,738/yr
- Insurance
- −$73
- HOA
- −$0
- Vacancy / Maint / Mgmt
- −$258
- Net cashflow
- $-165
Break-even live
Sensitivity live
| Price | -10% $-66 | -5% $-115 | +0% $-165 | +5% $-214 | +10% $-264 |
|---|---|---|---|---|---|
| Rent | -10% $-262 | -5% $-213 | +0% $-165 | +5% $-116 | +10% $-68 |
| Rate | -1.0pp $-77 | -0.5pp $-120 | base $-165 | +0.5pp $-210 | +1.0pp $-256 |
UW: 25.0% down · 7.5% · 30yr · 1.5% tax · 5.0% vac · 8.0% maint · 8.0% mgmt
Financing live
Cash to close
- Down payment
- $43,750
- Closing costs
- $5,250
- Reserves months
- —
- Total cash needed
- —
Loan-product check · same deal, 3 products live
Conventional
25% down · 7.5% · 30yr
- Down + closing
- —
- Monthly P&I
- —
- Monthly cashflow
- —
- DSCR
- —
- Eligible?
- —
Personal DTI + credit; lowest rate.
DSCR
20% down · 8.5% · 30yr
- Down + closing
- —
- Monthly P&I
- —
- Monthly cashflow
- —
- DSCR
- —
- Eligible?
- —
No personal income docs; deal must DSCR.
Hard money
10% down · 12.0% · 12mo
- Down + closing
- —
- Monthly P&I
- —
- Monthly cashflow
- —
- DSCR
- —
- Eligible?
- —
Short-term bridge; refi at stabilization.
Listing history 19 events
-
2026-03-24status Pending
-
2026-03-19$175,000 Active
-
2021-09-01soldstatus $134,620
-
2021-08-23soldstatus $134,620 809-char remark
Show marketing remark (809 chars)
Back on the market due to financing - no issues with the property. Come see this beautiful, rural property, featuring 4 amazing acres with hiking trails and access to a pond, right out your back door. Hang out on the full length back deck and enjoy the quiet. The side yard is fully fenced in with access from the deck. One level living in this updated, well maintained mobile home. The kitchen has lots of cupboard and storage space and the island seats two, right next to the dining room table. Open layout with nice size living area and 3 bedrooms including the primary suite w/ newly updated bathroom. There is a second full bath right across from the two other bedrooms. The large laundry room is also a perfect mud room with plenty of space for storage. Plus, there are two sheds for additional storage.
-
2021-04-11$126,900 809-char remark
Show marketing remark (809 chars)
Back on the market due to financing - no issues with the property. Come see this beautiful, rural property, featuring 4 amazing acres with hiking trails and access to a pond, right out your back door. Hang out on the full length back deck and enjoy the quiet. The side yard is fully fenced in with access from the deck. One level living in this updated, well maintained mobile home. The kitchen has lots of cupboard and storage space and the island seats two, right next to the dining room table. Open layout with nice size living area and 3 bedrooms including the primary suite w/ newly updated bathroom. There is a second full bath right across from the two other bedrooms. The large laundry room is also a perfect mud room with plenty of space for storage. Plus, there are two sheds for additional storage.
-
2021-02-08historical
-
2021-01-17$126,900
-
2020-12-20$126,900
-
2019-07-31soldstatus $112,000
-
2019-07-29soldstatus $112,000
-
2019-05-07$114,900
-
2014-06-25soldstatus $96,000
-
2014-06-09soldstatus $96,000
-
2014-06-09soldstatus $96,000
-
2014-06-09soldstatus $96,000
-
2013-08-21$98,000
-
2013-05-25$98,000
-
2013-05-16$98,000
-
2008-06-04soldstatus $25,000
ⓘ Source: listings_history table (triggers on properties + properties_extension) + one-shot
backfill from property_details.listing_events for pre-trigger history.
Tax reassessment forecast NY · Partial reset (capped growth)
- Current annual tax
- $1,738 · $145/mo
- Projected year-2 tax
- $2,348 · $196/mo
- Expected delta
- +$610/yr (+$51/mo · 35.1%)
ⓘ Screening estimate from a state-policy table — verify with the county assessor before closing.
Climate risk First Street
- Flood 1/10 Low FEMA zone X (unshaded) · 0% chance over 30 yrs
- Wildfire 3/10 Moderate
- Heat 2/10 Low 7 d/yr ≥92°F today · 14 d/yr by 30 yrs out
- Wind 2/10 Low 100% chance of damaging wind over 30 yrs
- Air quality 2/10 Low 0 unhealthy d/yr today · 1 by 30 yrs out
Nearby sold comps map
Loading sold comps map…
Walkable amenities ~0.75 mi
Loading nearby amenities…
Taxation est. · year 1
- Rental income
- $14,743
- − Mortgage interest
- −$9,803
- − Property taxes
- −$1,738
- − Insurance
- −$875
- − Repairs & maintenance
- −$1,179
- − Management
- −$1,179
- − Depreciation
- −$5,091
- Taxable loss
- −$5,123
- Est. tax savings @ 24.0%
- +$1,229
- After-tax cash flow
- $-749/yr
For passive investors: Depreciation is non-cash, so a rental often shows a tax loss while cash-flowing — sheltering income. Rental losses are passive: they offset passive income freely, and up to $25,000/yr can offset ordinary (W-2) income if you actively participate and your MAGI is under $100k (phasing out to $0 by $150k); unused losses carry forward. On sale, claimed depreciation is recaptured at up to 25%, and gains may owe capital-gains tax (a 1031 exchange can defer both). Figures are a year-1 estimate at your 24.0% rate — not tax advice; consult a CPA.
Schools (NCES district)
- District
- Whitney Point Central School District
- NCES district ID
- 3631380
- Math proficiency
- 47% ▼ -6.00%
- Reading proficiency
- 52% ▲ 5.00%
- Median HH income
- $52,416
- Composite
- 42.59/100
- National rank
- #3192
- State rank
- #390 of 590 in NY
Livability — Lisle
- Score
- 57/100
- State rank
- #1090
- US rank
- #22122
Category grades
Schools grade is shown separately in the Schools card above.
Census & demographics
- Population (ZIP)
- 2,105
Population outlook (Broome County) Hauer SSP2
- Today (2025)
- 187,989 people
- By 2030
- 183,066 · -2.6%
- By 2040
- 172,228 · -8.4%
- By 2050
- 163,161 · -13.2%
- By 2075
- 153,641 · -18.3%
- By 2100
- 140,851 · -25.1%
Race, ethnicity, and origin ACS 2023
- Neighborhood character
- Predominantly White (96%)
- Race & ethnicity
- White 96% Two or more races 3%
- Common ancestry
- Romanian 8% Italian 2% Lithuanian 2%
- Foreign-born
- 0%
- Languages at home
- 99% English-only · Spanish 1%
Political lean MEDSL · Broome
- 2024 margin
- Toss-up / Even · D 50.2% · R 49.8%
- 2008→2024 swing
- -7.6pp toward R · 2008: 8.0pp · 2024: 0.4pp
- All cycles
- 2024: D+0.4 2020: D+3.5 2016: R+3.7 2012: D+4.6 2008: D+8.0
Not yet ingested
- Civics
- —
Market trends
- HPI YoY
- ▲ 7.57%
- Current HPI
- 340.355
- Rent YoY
- —
- Metro
- —
- State GDP YoY
- ▲ 2.60%
- F500 in state
- 92
Industry mix (Fortune 500 HQ in NY)
| Industry | F500 HQs | Revenue |
|---|---|---|
| Financial Services | 10 | $950B |
|
||
| Consumer Goods | 9 | $162B |
|
||
| Insurance | 4 | $225B |
|
||
| Telecommunications | 2 | $144B |
|
||
| Pharmaceuticals | 2 | $112B |
|
||
| Media / Entertainment | 2 | $69B |
|
||
Price history
+600.0% since first listed19 events — show timeline
- 2026-03-24 Pending — GBAOR
- 2026-03-19 Listed $175,000 GBAOR
- 2021-09-01 Sold (Public Records) $134,620 Public Records
- 2021-08-23 Sold (MLS) $134,620 CNYIS
- 2021-04-11 Listed $126,900 CNYIS
- 2021-02-08 Listing Removed — CNYIS
- 2021-01-17 Listed $126,900 GBAOR
- 2020-12-20 Listed $126,900 CNYIS
- 2019-07-31 Sold (Public Records) $112,000 Public Records
- 2019-07-29 Sold (MLS) $112,000 GBAOR
- 2019-05-07 Listed $114,900 GBAOR
- 2014-06-25 Sold (Public Records) $96,000 Public Records
- 2014-06-09 Sold (MLS) $96,000 IBRMLS
- 2014-06-09 Sold (MLS) $96,000 GBAOR
- 2014-06-09 Sold (MLS) $96,000 CNYIS
- 2013-08-21 Listed $98,000 IBRMLS
- 2013-05-25 Listed $98,000 CNYIS
- 2013-05-16 Listed $98,000 GBAOR
- 2008-06-04 Sold (Public Records) $25,000 Public Records
Property tax history
+0.3%/yrLatest (2025): $1,738 · -0.3% YoY. Source: county tax records.
Cash-flow waterfall
monthlySold comps — $/sqft
last 12 mo · ≤1 miLoading sold comps…