 🏷️ Likely Rental
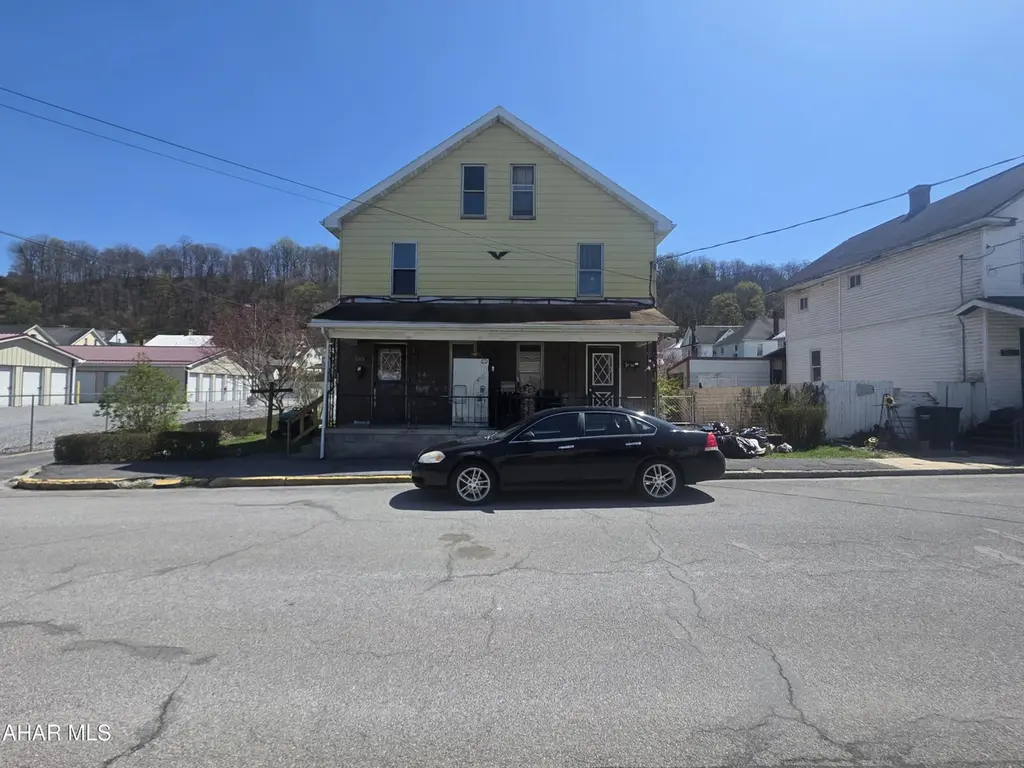
115 Liberty St · Williamsburg, PA
Flood risk 9/10 · Severe
- FEMA flood zone
- AE
- Chance of flooding over 30 yrs
- 0.99%
- Est. flood insurance / yr
- $1,737 – $8,500
Fire risk 1/10 · Minimal
- Est. fire insurance / yr
- $511 – $949
Heat risk 4/10 · Minor
- Hot days now (above 95°F)
- 8 days/yr
- Hot days in 30 yrs
- 19 days/yr
Wind risk 2/10 · Minimal
- Chance of severe wind over 30 yrs
- —
Air-quality risk 2/10 · Minimal
- Unhealthy air days now
- 1 days/yr
- Unhealthy air days in 30 yrs
- 2 days/yr
Risk factors via First Street. Map © Google.
Why this score? — see what drove the A- grade
The composite is a weighted blend of 9 inputs, each scored 0–100. Each bar is that input's sub-score; the figure is the points it added to the 100-point composite (weight × sub-score).
- Cash flow +30.0/30.0
- ARV discount +15.0/15.0
- 1% rule +10.0/10.0
- DSCR +10.0/10.0
- Appreciation +7.4/10.0
- Schools +3.9/10.0
- Livability +3.7/5.0
- Rent growth +2.5/5.0
- Condition / age +1.5/5.0
$69,000
🖨 Deal sheet 📄 Offer letter ✓ Due diligence
Multi-family units
County records classify this as Multi-Family (2-4 Unit). Listing-text estimate: 2 units. confirmed
Listing remarks MLS
This side-by-side duplex features two units, each with a living room, dining room, and kitchen on the main floor. The second floors contain two bedrooms, one bathroom, and a bonus room. Both units need TLC. Currently one side is rented a on month to month lease. Schedule a tour.
Key facts
- 2,613 sq ft lot
- Built 1900
- Listed 60 days
Neighborhood map
What this means for you Summary
Snapshot
- This is a 2 × 2-bed/1-bath units multifamily listed at $69k. Condition is rated poor.
Deal economics
- At list price, monthly cash flow is $858 ($10k/yr) — positive. Per door: $429/mo.
- The deal already cash-flows at list — no discount required.
- Meets the 1% rule at list price ($2k rent vs $69k).
- Recommended offer: $67k (3.0% below list) — sets the bar for market timing.
Location & tenants
- Location reads 73/100 on livability (#561 in PA) — a middle-class / working-renter tenant base. Strengths: crime A+, cost of living A+, housing A+; Watch: employment C-, amenities F, commute F.
- Williamsburg Community SD (rural): math 35% / reading 58% proficiency, ranked #260 of 539 in PA (top 48%) — families likely to look elsewhere, expect single-tenant / working-renter base with shorter leases.
- Market conditions: 15 active listings in the ZIP; 99 units permitted in Blair County in 2024 (0 in 5+ unit buildings).
Forward outlook
- In year one you build about $4k of equity ($477 loan paydown + $3k appreciation (4.9% local appreciation)).
- Blair County population projected at -18% by 2050 — secular population decline; favor cash flow + early exit over multi-decade hold.
- At projected returns (4.9% appreciation + 3.0% rent growth), your $19k cash investment doubles in ~2 years — after that, you're playing with house money.
- By year 9, paydown + projected appreciation supports a ~$33k cash-out refi (75% LTV) — recoverable capital for the next deal without selling this one.
Negotiation context
- It's been on market 60 days — a 3% lower offer ($67k) is reasonable based on typical stale-listing flexibility.
Risks & watch-outs
- Watch-outs: flood insurance adds $427/mo; built in 1900 — expect roof / HVAC / electrical / plumbing capex.
- Climate carrying-cost: in FEMA flood zone AE (mandatory federal flood insurance) — expect insurance premiums to compound above CPI over the hold.
Questions for the listing agent
- It's been on market 60 days. Have you received any prior offers? Is the seller open to a 3% concession, seller financing, or rate buy-down credit?
- Can we see the unit-by-unit rent roll, current vacancy, and any below-market leases? What's the average tenancy length?
- What capital expenditures (roof, boiler, parking lot, exteriors) have been made in the last 5 years, and what's planned in the next 2?
- Have any recent inspections been done? Can we get a copy of the seller's disclosures and any deferred-maintenance estimates?
- Built in 1900 — when were the roof, HVAC, electrical panel, plumbing, and water heater last replaced?
- What's the actual annual flood-insurance premium (NFIP or private), and is the property in a SFHA with mandatory coverage?
- Is there a deadline driving the sale (1031 exchange, divorce, estate, relocation)? That informs how much negotiation room exists.
- What's the average days-on-market for RENTAL listings here right now (not sales)? A rising rental-DOM trend means longer vacancies and softer asking-rent achievability than the comps imply.
- What's the recent tenant-quality profile in this submarket — average credit score on applications, eviction rate, late-payment / NSF rate, and stable-employment percentage? A property-management company in the area should have these aggregated.
- How much new apartment / multifamily construction is in the pipeline within 1–3 miles? Heavy new supply (>2% of stock underway) typically softens rents 12–24 months out; light construction supports rent growth.
Investment metrics
- 1% rule
- 3.23% ✓
- Cap rate
- 28.62%
- Cash-on-cash
- 79.76%
- DSCR
- 4.55
- GRM
- 2.6
CMA / ARV
- ARV (median comp)
- $114,234
- List price
- $69,000
- Delta
- -39.60%
- Verdict
- UNDERPRICED
- Comps
- 6 within 1.0 mi
Show comp detail 2 sales within ~0.75 mi
| Address | Dist | Beds/Ba | Sqft | Sold | Price | $/sf | Match |
|---|---|---|---|---|---|---|---|
| 918/920 Yellow Springs Dr | 0.33mi | —/2.0 | 2,378 (-11%) | 11mo | $145,000 | $61 | 50 |
| 1215-1217 Yellow Springs Dr | 0.56mi | —/3.0 | 2,560 (-4%) | 18mo | $300,000 | $117 | 48 |
Match score weights: distance 35% · size 25% · config 20% · recency 20%. Top-matched comps best support the ARV.
Projected returns pro-forma
4.86% appreciation · 3.0% rent growth · sell at horizon
- IRR
- 60.6%
- Equity multiple
- 4.64×
- Total profit
- $70,269
- Equity at exit
- $38,520
- IRR
- 58.6%
- Equity multiple
- 9.59×
- Total profit
- $166,045
- Equity at exit
- $66,005
Cash invested: $19,320 (down + closing). Projections, not guarantees.
Landlord ↔ Tenant lean methodology
- Overall (STATE)
- 62 Landlord-Friendly
- State Pennsylvania
- 62 Landlord-Friendly · EVEN
- County
- — inherits STATE
- City
- — inherits STATE
ZIP-level market 16693
- Home prices YoY
- 3.8%
- Active inventory
- 15
- Price-to-rent
- 5.2×
Monthly cashflow live
- Estimated rent
- $2,229 medium interval (Pro) →
- Mortgage (P&I)
- −$362
- Tax est. 1.5%
- −$86 /mo · $1,035/yr
- Insurance
- −$29
- Flood insurance flood zone
- −$427 /mo · $5,118/yr
- HOA
- −$0
- Vacancy / Maint / Mgmt
- −$468
- Net cashflow
- $858
Break-even live
2-unit breakdown (identical units grouped — click to expand)
| Units | Beds | Baths | Est. rent |
|---|---|---|---|
| 2× units | 2 | 1 | $2,230 |
| #1 | 2 | 1 | $1,115 |
| #2 | 2 | 1 | $1,115 |
| Total (2 units) | $2,229 | ||
UW: 25.0% down · 7.5% · 30yr · 1.5% tax · 5.0% vac · 8.0% maint · 8.0% mgmt
Financing live
Cash to close
- Down payment
- $17,250
- Closing costs
- $2,070
- Reserves months
- —
- Total cash needed
- —
Loan-product check · same deal, 3 products live
Conventional
25% down · 7.5% · 30yr
- Down + closing
- —
- Monthly P&I
- —
- Monthly cashflow
- —
- DSCR
- —
- Eligible?
- —
Personal DTI + credit; lowest rate.
DSCR
20% down · 8.5% · 30yr
- Down + closing
- —
- Monthly P&I
- —
- Monthly cashflow
- —
- DSCR
- —
- Eligible?
- —
No personal income docs; deal must DSCR.
Hard money
10% down · 12.0% · 12mo
- Down + closing
- —
- Monthly P&I
- —
- Monthly cashflow
- —
- DSCR
- —
- Eligible?
- —
Short-term bridge; refi at stabilization.
Listing history 10 events
-
2026-06-10status $69,000 Pending 60 DOM
-
2026-06-09days on market $69,000 Active 60 DOM
-
2026-06-08days on market $69,000 Active 59 DOM
-
2026-06-07days on market $69,000 Active 58 DOM
-
2026-06-02days on market $69,000 Active 53 DOM
-
2026-06-01days on market $69,000 Active 52 DOM
-
2026-05-31days on market $69,000 Active 51 DOM
-
2026-05-30days on market $69,000 Active 50 DOM
-
2026-04-22price $69,000 280-char remark
Show marketing remark (280 chars)
This side-by-side duplex features two units, each with a living room, dining room, and kitchen on the main floor. The second floors contain two bedrooms, one bathroom, and a bonus room. Both units need TLC. Currently one side is rented a on month to month lease. Schedule a tour.
-
2026-04-10$79,900 Active 280-char remark
Show marketing remark (280 chars)
This side-by-side duplex features two units, each with a living room, dining room, and kitchen on the main floor. The second floors contain two bedrooms, one bathroom, and a bonus room. Both units need TLC. Currently one side is rented a on month to month lease. Schedule a tour.
ⓘ Source: listings_history table (triggers on properties + properties_extension) + one-shot
backfill from property_details.listing_events for pre-trigger history.
Climate risk First Street
- Flood 9/10 Extreme FEMA zone AE · 99% chance over 30 yrs
- Wildfire 1/10 Low
- Heat 4/10 Moderate 8 d/yr ≥95°F today · 19 d/yr by 30 yrs out
- Wind 2/10 Low
- Air quality 2/10 Low 1 unhealthy d/yr today · 2 by 30 yrs out
Nearby sold comps map
Loading sold comps map…
Walkable amenities ~0.75 mi
Loading nearby amenities…
Taxation est. · year 1
- Rental income
- $26,748
- − Mortgage interest
- −$3,865
- − Property taxes
- −$1,035
- − Insurance
- −$5,464
- − Repairs & maintenance
- −$2,140
- − Management
- −$2,140
- − Depreciation
- −$2,007
- Taxable income
- $10,097
- Est. tax owed @ 24.0%
- −$2,423
- After-tax cash flow
- $7,867/yr
For passive investors: Depreciation is non-cash, so a rental often shows a tax loss while cash-flowing — sheltering income. Rental losses are passive: they offset passive income freely, and up to $25,000/yr can offset ordinary (W-2) income if you actively participate and your MAGI is under $100k (phasing out to $0 by $150k); unused losses carry forward. On sale, claimed depreciation is recaptured at up to 25%, and gains may owe capital-gains tax (a 1031 exchange can defer both). Figures are a year-1 estimate at your 24.0% rate — not tax advice; consult a CPA.
Condition & rehab AI · 13 photos
This two-unit duplex requires extensive repairs and updates to improve its condition and increase its resale and rental value.
Repairs flagged
- Major Exterior siding — Weathered and peeling
- Major Flooring — Worn and outdated
- Major Interior walls/paint — Outdated and in need of freshening
- Major Windows — Old and may need replacement
- Major HVAC/mechanicals — No photos, but likely outdated
Value-add opportunities
- Both New exterior siding — Improves curb appeal and value
- Both New flooring — Enhances interior space and value
- Both Fresh paint — Refreshes interior and exterior, improving value
- Both New windows — Enhances energy efficiency and value
- Both HVAC upgrade — Improves comfort and energy efficiency, increasing value
Renovation cost estimate screening
| Repair item | Severity | Est. cost |
|---|---|---|
| Exterior siding · Weathered and peeling | Major | $15,000–50,000 |
| Flooring · Worn and outdated | Major | $15,000–50,000 |
| Interior walls/paint · Outdated and in need of freshening | Major | $15,000–50,000 |
| Windows · Old and may need replacement | Major | $15,000–50,000 |
| HVAC/mechanicals · No photos, but likely outdated | Major | $15,000–50,000 |
| Total estimated repair cost · 5 items | $75,000–250,000 |
Value-add ROI direction
- Both New exterior siding — Improves curb appeal and value ↑
- Both New flooring — Enhances interior space and value ↑
- Both Fresh paint — Refreshes interior and exterior, improving value ↑
- Both New windows — Enhances energy efficiency and value ↑
- Both HVAC upgrade — Improves comfort and energy efficiency, increasing value ↑
ⓘ Cost ranges are severity-bucket heuristics (US national rule-of-thumb). Get contractor quotes + a written scope before underwriting a rehab budget.
Schools (NCES district)
- District
- Williamsburg Community SD
- NCES district ID
- 4226430
- Math proficiency
- 35% ▼ -7.00%
- Reading proficiency
- 58% ▼ -4.00%
- Median HH income
- $43,977
- Composite
- 39.22/100
- National rank
- #4014
- State rank
- #260 of 539 in PA
Livability — Williamsburg
- Score
- 73/100
- State rank
- #561
- US rank
- #5279
Category grades
Schools grade is shown separately in the Schools card above.
Census & demographics
- Census place
- Williamsburg, PA
- Population (ZIP)
- 4,015
Population outlook (Blair County) Hauer SSP2
- Today (2025)
- 121,571 people
- By 2030
- 117,966 · -3.0%
- By 2040
- 109,174 · -10.2%
- By 2050
- 99,542 · -18.1%
- By 2075
- 76,775 · -36.8%
- By 2100
- 54,326 · -55.3%
Race, ethnicity, and origin ACS 2023
- Neighborhood character
- Predominantly White (93%)
- Race & ethnicity
- White 93% Two or more races 5% Hispanic / Latino 2%
- Common ancestry
- Slovak 3% Serbian 2% Romanian 1%
- Foreign-born
- 1% · Canada
- Languages at home
- 96% English-only · German/W. Germanic 3%
Political lean MEDSL · Blair
- 2024 margin
- Solid R (+43.5) · D 27.9% · R 71.4%
- 2008→2024 swing
- -19.2pp toward R · 2008: -24.3pp · 2024: -43.5pp
- All cycles
- 2024: R+43.5 2020: R+43.5 2016: R+46.4 2012: R+33.5 2008: R+24.3
Not yet ingested
- Civics
- —
Market trends
- HPI YoY
- ▲ 4.86%
- Current HPI
- 133.0129
- Rent YoY
- —
- Metro
- —
- State GDP YoY
- ▲ 1.68%
- F500 in state
- 34
Industry mix (Fortune 500 HQ in PA)
| Industry | F500 HQs | Revenue |
|---|---|---|
| Healthcare | 2 | $309B |
|
||
| Insurance | 2 | $27B |
|
||
| Telecommunications / Media | 1 | $124B |
|
||
| Industrial Distribution | 1 | $22B |
|
||
| Financial Services | 1 | $20B |
|
||
| Chemicals / Materials | 1 | $18B |
|
||
Price history
-13.6% since first listed2 events — show timeline
- 2026-04-22 Price Changed $69,000 AHARMLS
- 2026-04-10 Listed $79,900 AHARMLS
Cash-flow waterfall
monthlySold comps — $/sqft
last 12 mo · ≤1 miLoading sold comps…