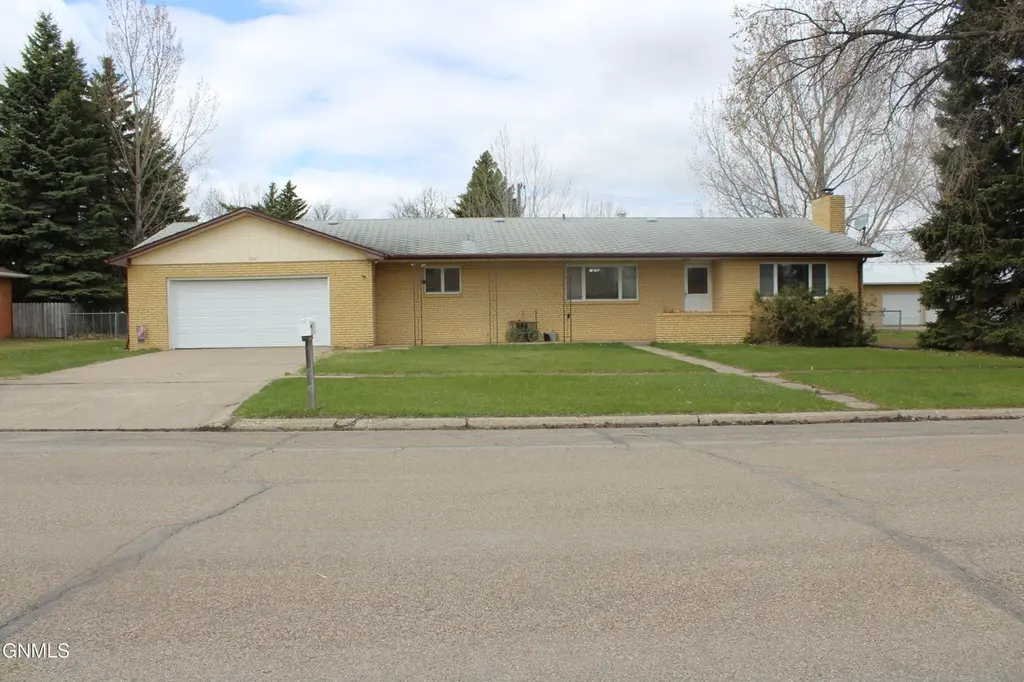
504 Kundert St · Turtle Lake, ND
Flood risk 1/10 · Minimal
- FEMA flood zone
- X (unshaded)
- Chance of flooding over 30 yrs
- 0.0%
- Est. flood insurance / yr
- $473 – $860
Fire risk 1/10 · Minimal
- Est. fire insurance / yr
- $1,289 – $2,393
Heat risk 2/10 · Minimal
- Hot days now (above 95°F)
- 7 days/yr
- Hot days in 30 yrs
- 13 days/yr
Wind risk 1/10 · Minimal
- Chance of severe wind over 30 yrs
- —
Air-quality risk 4/10 · Minor
- Unhealthy air days now
- 5 days/yr
- Unhealthy air days in 30 yrs
- 5 days/yr
Risk factors via First Street. Map © Google.
Why this score? — see what drove the D- grade
The composite is a weighted blend of 9 inputs, each scored 0–100. Each bar is that input's sub-score; the figure is the points it added to the 100-point composite (weight × sub-score).
- Cash flow +9.6/30.0
- Appreciation +6.7/10.0
- Schools +4.3/10.0
- ARV discount +4.2/15.0
- Livability +3.2/5.0
- DSCR +2.7/10.0
- 1% rule +2.5/10.0
- Rent growth +2.5/5.0
- Condition / age +2.5/5.0
$179,900
🖨 Deal sheet (PDF) 📄 Offer letter ✓ Due diligence
Listing remarks MLS
Very large home features living room with gas fireplace, formal dining room, eat in kitchen with oak cabinets, main floor laundry. Main floor family room could be 4th bedroom. Massive amount of closet space in this home. Basement has large finished family room, bedroom and bathroom. Other Rooms - Office/Den, Workshop. Basement - BLOCK.
Key facts
- Alley access
- 28x36 shop
- Main-floor laundry
Tags
Property features AI
Exterior
- Parking: 2-car garage with alley access
- Utilities: Public water; Public sewer
- Home design: Single-family residence; Two levels; Brick construction
- Construction: Shingle roof; Workshop on the property
- Exterior features: Patio; Level lot
Interior
- Kitchen: Dishwasher; Oven
- Flooring: Vinyl; Carpet; Laminate
- Bathrooms: One full bathroom; One three-quarter bathroom
- Heating & cooling: Baseboard heating; Hot water heating; Ceiling fan cooling; Other cooling
- Interior features: Ceiling fans; Window treatments; Gas fireplace in the living room; Full unfinished basement with sump pump
Neighborhood map
What this means for you Summary
Snapshot
- This is a 4-bed/2.0-bath single-family listed at $180k.
Deal economics
- At list price, monthly cash flow is $-123 ($-1k/yr) — negative.
- To cash-flow at today's rent, offer at most $158k (12.1% below list).
- To meet the 1% rule (rent ≥ 1% of price), the offer needs to be $134k (25.5% below list).
- Recommended offer: $134k (25.5% below list) — sets the bar for 1% rule.
Location & tenants
- Location reads 64/100 on livability (#198 in ND) — a middle-class / working-renter tenant base. Strengths: cost of living A+, housing A+; Watch: schools C-, crime C-, employment D+.
- Turtle Lake-Mercer 72 (rural): math 50% / reading 45% proficiency, ranked #69 of 169 in ND (top 41%) — families likely to look elsewhere, expect single-tenant / working-renter base with shorter leases; only 20% free/reduced lunch — higher-income household profile.
- Market conditions: 10 active listings in the ZIP; 43 units permitted in McLean County in 2024 (0 in 5+ unit buildings).
Forward outlook
- In year one you build about $7k of equity ($1k loan paydown + $6k appreciation (3.4% local appreciation)).
- McLean County population projected at +48% by 2050 — long-run rental-demand tailwind backs the buy-and-hold thesis.
- By year 5, paydown + projected appreciation supports a ~$32k cash-out refi (75% LTV) — recoverable capital for the next deal without selling this one.
Negotiation context
- It's been on market 44 days — a 3% lower offer ($175k) is reasonable based on typical stale-listing flexibility.
- 2 sale attempts since 23y ago with the ask held roughly flat each time — persistent listings suggest the price (not the market) is what's stuck; bring a comps-based counter.
Questions for the listing agent
- What do current leases actually rent for vs. the listed asking? Can we see a recent rent roll and the last 12 months of T-12 income?
- It's been on market 44 days. Have you received any prior offers? Is the seller open to a 25% concession, seller financing, or rate buy-down credit?
- Built in 1967 — when were the roof, HVAC, electrical panel, plumbing, and water heater last replaced?
- Is there a deadline driving the sale (1031 exchange, divorce, estate, relocation)? That informs how much negotiation room exists.
- The area grade is low — what's the realistic commute time and amenity access for the typical tenant pool here? Any planned neighborhood developments (good or bad) we should know about?
- What's the average days-on-market for RENTAL listings here right now (not sales)? A rising rental-DOM trend means longer vacancies and softer asking-rent achievability than the comps imply.
- What's the recent tenant-quality profile in this submarket — average credit score on applications, eviction rate, late-payment / NSF rate, and stable-employment percentage? A property-management company in the area should have these aggregated.
- How much new for-sale + rental construction is in the pipeline within 1–3 miles? Heavy new supply typically softens prices + rents 12–24 months out; constrained supply supports both.
Investment metrics
- 1% rule
- 0.75% ✗
- Cap rate
- 5.47%
- Cash-on-cash
- -2.93%
- DSCR
- 0.87
- GRM
- 11.2
CMA / ARV
- ARV (on-the-fly)
- $167,608
- Comps found
- 6
Show comp detail 6 sales within ~0.75 mi
| Address | Dist | Beds/Ba | Sqft | Sold | Price | $/sf | Match |
|---|---|---|---|---|---|---|---|
| 544 Jefferson Dr | 0.28mi | 4/2.0 | 2,132 (+4%) | 16mo | $175,000 | $82 | 66 |
| 321 Kundert St | 0.13mi | 4/2.0 | 2,193 (+7%) | 22mo | $169,000 | $77 | 64 |
| 120 Eggert St | 0.32mi | 4/2.0 | 1,885 (-8%) | 17mo | $160,280 | $85 | 58 |
| 320 Walnut St | 0.14mi | 3/2.0 (-1) | 1,770 (-13%) | 11mo | $92,500 | $52 | 57 |
| 311 Becker St | 0.20mi | 4/2.0 | 2,276 (+11%) | 22mo | $206,000 | $91 | 54 |
| 522 Eastside St | 0.49mi | 3/2.0 (-1) | 1,841 (-10%) | 21mo | $79,900 | $43 | 38 |
Match score weights: distance 35% · size 25% · config 20% · recency 20%. Top-matched comps best support the ARV.
Projected returns pro-forma
3.38% appreciation · 3.0% rent growth · sell at horizon
- IRR
- 5.9%
- Equity multiple
- 1.35×
- Total profit
- $17,427
- Equity at exit
- $84,730
- IRR
- 8.7%
- Equity multiple
- 2.36×
- Total profit
- $68,623
- Equity at exit
- $133,647
Cash invested: $50,372 (down + closing). Projections, not guarantees.
Landlord ↔ Tenant lean methodology
- Overall (STATE)
- 82 Strongly Landlord-Friendly
- State North Dakota
- 82 Strongly Landlord-Friendly · R+20
- County
- — inherits STATE
- City
- — inherits STATE
ZIP-level market 58575
- Home prices YoY
- 3.2%
- Active inventory
- 10
- Price-to-rent
- 11.2×
Monthly cashflow live
- Estimated rent
- $1,340 medium interval (Pro) →
- Mortgage (P&I)
- −$943
- Tax from tax record
- −$164 /mo · $1,963/yr
- Insurance
- −$75
- HOA
- −$0
- Vacancy / Maint / Mgmt
- −$281
- Net cashflow
- $-123
Break-even live
Sensitivity live
| Price | -10% $-21 | -5% $-72 | +0% $-123 | +5% $-174 | +10% $-225 |
|---|---|---|---|---|---|
| Rent | -10% $-229 | -5% $-176 | +0% $-123 | +5% $-70 | +10% $-17 |
| Rate | -1.0pp $-32 | -0.5pp $-77 | base $-123 | +0.5pp $-170 | +1.0pp $-217 |
UW: 25.0% down · 7.5% · 30yr · 1.5% tax · 5.0% vac · 8.0% maint · 8.0% mgmt
Financing live
Cash to close
- Down payment
- $44,975
- Closing costs
- $5,397
- Reserves months
- —
- Total cash needed
- —
Loan-product check · same deal, 3 products live
Conventional
25% down · 7.5% · 30yr
- Down + closing
- —
- Monthly P&I
- —
- Monthly cashflow
- —
- DSCR
- —
- Eligible?
- —
Personal DTI + credit; lowest rate.
DSCR
20% down · 8.5% · 30yr
- Down + closing
- —
- Monthly P&I
- —
- Monthly cashflow
- —
- DSCR
- —
- Eligible?
- —
No personal income docs; deal must DSCR.
Hard money
10% down · 12.0% · 12mo
- Down + closing
- —
- Monthly P&I
- —
- Monthly cashflow
- —
- DSCR
- —
- Eligible?
- —
Short-term bridge; refi at stabilization.
Listing history 19 events
-
2026-06-21days on market $179,900 Active 44 DOM
-
2026-06-18days on market $179,900 Active 42 DOM
-
2026-06-17days on market $179,900 Active 41 DOM
-
2026-06-16days on market $179,900 Active 40 DOM
-
2026-06-15days on market $179,900 Active 39 DOM
-
2026-06-13days on market $179,900 Active 37 DOM
-
2026-06-12days on market $179,900 Active 36 DOM
-
2026-06-09days on market $179,900 Active 33 DOM
-
2026-06-08days on market $179,900 Active 32 DOM
-
2026-06-07days on market $179,900 Active 31 DOM
-
2026-06-05days on market $179,900 Active 29 DOM
-
2026-06-04days on market $179,900 Active 27 DOM
-
2026-06-02days on market $179,900 Active 26 DOM
-
2026-06-01days on market $179,900 Active 25 DOM
-
2026-05-31days on market $179,900 Active 24 DOM
-
2026-05-07$179,900 Active
-
2025-07-24soldstatus
-
2004-07-30soldstatus 337-char remark
Show marketing remark (337 chars)
Very large home features living room with gas fireplace, formal dining room, eat in kitchen with oak cabinets, main floor laundry. Main floor family room could be 4th bedroom. Massive amount of closet space in this home. Basement has large finished family room, bedroom and bathroom. Other Rooms - Office/Den, Workshop. Basement - BLOCK.
-
2003-10-19$69,900 337-char remark
Show marketing remark (337 chars)
Very large home features living room with gas fireplace, formal dining room, eat in kitchen with oak cabinets, main floor laundry. Main floor family room could be 4th bedroom. Massive amount of closet space in this home. Basement has large finished family room, bedroom and bathroom. Other Rooms - Office/Den, Workshop. Basement - BLOCK.
ⓘ Source: listings_history table (triggers on properties + properties_extension) + one-shot
backfill from property_details.listing_events for pre-trigger history.
Tax reassessment forecast ND · Resets to sale price
- Current annual tax
- $1,963 · $164/mo
- Projected year-2 tax
- $1,963 · $164/mo
- Expected delta
- $0/yr ($0/mo · 0.0%)
ⓘ Screening estimate from a state-policy table — verify with the county assessor before closing.
Climate risk First Street
- Flood 1/10 Low FEMA zone X (unshaded) · 0% chance over 30 yrs
- Wildfire 1/10 Low
- Heat 2/10 Low 7 d/yr ≥95°F today · 13 d/yr by 30 yrs out
- Wind 1/10 Low
- Air quality 4/10 Moderate 5 unhealthy d/yr today · 5 by 30 yrs out
Nearby sold comps map
Loading sold comps map…
Walkable amenities ~0.75 mi
Loading nearby amenities…
Taxation est. · year 1
- Rental income
- $16,085
- − Mortgage interest
- −$10,077
- − Property taxes
- −$1,963
- − Insurance
- −$900
- − Repairs & maintenance
- −$1,287
- − Management
- −$1,287
- − Depreciation
- −$5,233
- Taxable loss
- −$4,662
- Est. tax savings @ 24.0%
- +$1,119
- After-tax cash flow
- $-358/yr
For passive investors: Depreciation is non-cash, so a rental often shows a tax loss while cash-flowing — sheltering income. Rental losses are passive: they offset passive income freely, and up to $25,000/yr can offset ordinary (W-2) income if you actively participate and your MAGI is under $100k (phasing out to $0 by $150k); unused losses carry forward. On sale, claimed depreciation is recaptured at up to 25%, and gains may owe capital-gains tax (a 1031 exchange can defer both). Figures are a year-1 estimate at your 24.0% rate — not tax advice; consult a CPA.
Schools (NCES district)
- District
- Turtle Lake-Mercer 72
- NCES district ID
- 3818500
- Math proficiency
- 50% ▲ 20.00%
- Reading proficiency
- 45% ▬ 0.00%
- Median HH income
- $48,052
- Composite
- 42.66/100
- National rank
- #6804
- State rank
- #69 of 169 in ND
Livability — Turtle Lake
- Score
- 64/100
- State rank
- #198
- US rank
- #13852
Category grades
Schools grade is shown separately in the Schools card above.
Census & demographics
- Census place
- Turtle Lake, ND
- Population (ZIP)
- 904
Population outlook (McLean County) Hauer SSP2
- Today (2025)
- 11,405 people
- By 2030
- 12,337 · +8.2%
- By 2040
- 14,426 · +26.5%
- By 2050
- 16,850 · +47.7%
- By 2075
- 24,191 · +112.1%
- By 2100
- 30,714 · +169.3%
Race, ethnicity, and origin ACS 2023
- Neighborhood character
- Predominantly White (95%)
- Race & ethnicity
- White 95% Two or more races 2% Hispanic / Latino 1% Asian 1%
- Common ancestry
- Portuguese 17% Scottish 5% Estonian 3%
- Foreign-born
- 5% · Canada
- Languages at home
- 93% English-only · Other Indo-European 5% Spanish 1% German/W. Germanic 1%
Political lean MEDSL · McLean
- 2024 margin
- Solid R (+58.1) · D 20.2% · R 78.4% · Other 1.4%
- 2008→2024 swing
- -39.1pp toward R · 2008: -19.0pp · 2024: -58.1pp
- All cycles
- 2024: R+58.1 2020: R+53.6 2016: R+53.0 2012: R+30.0 2008: R+19.0
Not yet ingested
- Civics
- —
Market trends
- HPI YoY
- ▲ 3.38%
- Current HPI
- 108.0978
- Rent YoY
- —
- Metro
- —
- State GDP YoY
- ▲ 2.09%
- F500 in state
- 2
Industry mix (Fortune 500 HQ in ND)
| Industry | F500 HQs | Revenue |
|---|---|---|
| Utilities / Construction | 1 | $6B |
|
||
Price history
+157.4% since first listed4 events — show timeline
- 2026-05-07 Listed $179,900 GNMLS
- 2025-07-24 Sold (Public Records) — Public Records
- 2004-07-30 Sold (MLS) — GNMLS
- 2003-10-19 Listed $69,900 GNMLS
Property tax history
+8.2%/yrLatest (2025): $1,963 · +5.0% YoY. Source: county tax records.
Cash-flow waterfall
monthlySold comps — $/sqft
last 12 mo · ≤1 miLoading sold comps…