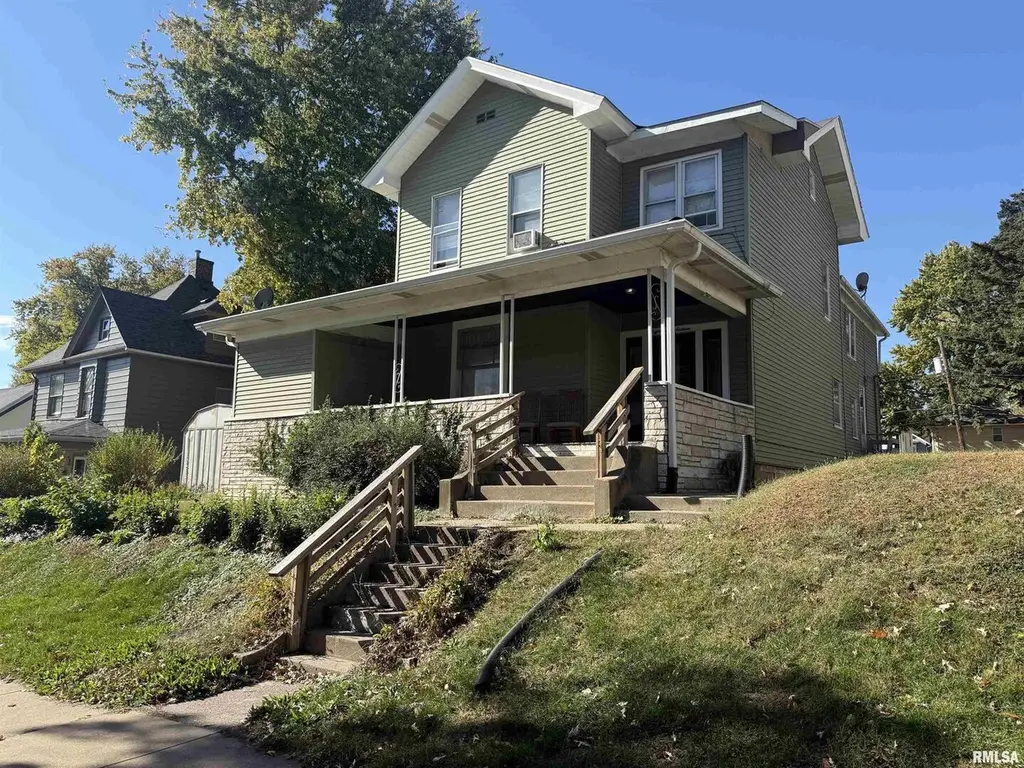
1816 Davenport Ave · Davenport, IA
Flood risk 1/10 · Minimal
- FEMA flood zone
- X (unshaded)
- Chance of flooding over 30 yrs
- 0.0%
- Est. flood insurance / yr
- $473 – $860
Fire risk 1/10 · Minimal
- Est. fire insurance / yr
- $902 – $1,676
Heat risk 3/10 · Minor
- Hot days now (above 103°F)
- 7 days/yr
- Hot days in 30 yrs
- 16 days/yr
Wind risk 2/10 · Minimal
- Chance of severe wind over 30 yrs
- —
Air-quality risk 3/10 · Minor
- Unhealthy air days now
- 2 days/yr
- Unhealthy air days in 30 yrs
- 3 days/yr
Risk factors via First Street. Map © Google.
Why this score? — see what drove the C- grade
The composite is a weighted blend of 9 inputs, each scored 0–100. Each bar is that input's sub-score; the figure is the points it added to the 100-point composite (weight × sub-score).
- ARV discount +15.0/15.0
- Cash flow +13.5/30.0
- DSCR +4.1/10.0
- Livability +4.0/5.0
- Schools +3.9/10.0
- 1% rule +3.7/10.0
- Rent growth +3.6/5.0
- Condition / age +2.5/5.0
- Appreciation +0.0/10.0
$110,000
🖨 Deal sheet (PDF) 📄 Offer letter ✓ Due diligence
Listing remarks MLS
Four-unit multifamily investment property located just off E. Locust Street, within close proximity to shopping corridors and neighborhood amenities. Fully occupied and generating a Net Operating Income of $8,725. 2,568 SF two-story structure on 0.17 acres featuring efficient unit layouts and a strong rental history. Tenants are responsible for electric service, while ownership covers water, sewer, and trash. Property includes rear alley access with a small lot providing off-street parking. Ideal for investors seeking dependable returns in the Quad Cities market.
Key facts
- 7,308 sq ft lot
- Built 1889
- Listed 28 days
Neighborhood map
What this means for you Summary
Snapshot
- This is a ?-bed/5.5-bath other listed at $110k.
Deal economics
- At list price, monthly cash flow is $4 ($51/yr) — positive.
- The deal already cash-flows at list — no discount required.
- To meet the 1% rule (rent ≥ 1% of price), the offer needs to be $96k (13.0% below list).
- Recommended offer: $96k (13.0% below list) — sets the bar for 1% rule.
- Cap rate 6.3% vs local median 4.4% in Davenport — top-decile yield for the area; either an underpriced asset or a hidden risk that comps aren't pricing in. Stress-test before assuming the spread holds.
Location & tenants
- Location reads 79/100 on livability (#126 in IA, #2,312 nationally) — a middle-class / working-renter tenant base. Strengths: cost of living A+, housing A+, health & safety A+; Watch: employment C-, crime F.
- Davenport Community School District (urban): math 43% / reading 50% proficiency, ranked #288 of 289 in IA (top 100%) — families likely to look elsewhere, expect single-tenant / working-renter base with shorter leases.
- Zoned schools: Madison Elementary School (math 28% / reading 25%, grade F, #611 of 616 statewide, top 99%, 379 students, 73% FRL); Central High School (math 45% / reading 64%, grade C-, #290 of 336 statewide, top 87%, 1,505 students, 47% FRL) — zoned schools at 60% FRL track the district average.
- Market conditions: Rents rising fast (+4.6%/yr); 165 active listings in the ZIP; 2 comparable units currently listed for rent nearby; 805 units permitted in Scott County in 2024 (479 in 5+ unit buildings).
- This rent is only 18% of the median local income ($65k/yr) — well below the 30% rent-burden line; pricing power to push rent on renewal without tenant pushback.
Forward outlook
- Local home prices are declining (-3.0%/yr); year-one equity from $761 of loan paydown is wiped out by about $3k of value loss. Plan a longer hold.
- Scott County population projected at +19% by 2050 — long-run rental-demand tailwind backs the buy-and-hold thesis.
Negotiation context
- It's been on market 28 days — a 2% lower offer ($108k) is reasonable based on typical stale-listing flexibility.
- 2 sale attempts since 14y ago; this cycle's ask is 10% above the opening price — seller raised mid-cycle; expect resistance to lowballs.
Risks & watch-outs
- Watch-outs: built in 1889 — expect roof / HVAC / electrical / plumbing capex.
Questions for the listing agent
- Built in 1889 — when were the roof, HVAC, electrical panel, plumbing, and water heater last replaced?
- Is there a deadline driving the sale (1031 exchange, divorce, estate, relocation)? That informs how much negotiation room exists.
- Crime grade is F in this area — have there been break-ins, vandalism, or insurance claims at this property in the last 3 years? What carrier currently insures it and at what premium?
- What's the average days-on-market for RENTAL listings here right now (not sales)? A rising rental-DOM trend means longer vacancies and softer asking-rent achievability than the comps imply.
- What's the recent tenant-quality profile in this submarket — average credit score on applications, eviction rate, late-payment / NSF rate, and stable-employment percentage? A property-management company in the area should have these aggregated.
- How much new for-sale + rental construction is in the pipeline within 1–3 miles? Heavy new supply typically softens prices + rents 12–24 months out; constrained supply supports both.
Investment metrics
- 1% rule
- 0.87% ✗
- Cap rate
- 6.34%
- Cash-on-cash
- 0.17%
- DSCR
- 1.01
- GRM
- 9.6
CMA / ARV
- ARV (median comp)
- $143,849
- List price
- $110,000
- Delta
- -23.53%
- Verdict
- UNDERPRICED
- Comps
- 20 within 1.0 mi
Projected returns pro-forma
-3.0% appreciation · 4.57% rent growth · sell at horizon
- IRR
- -14.3%
- Equity multiple
- 0.48×
- Total profit
- $-16,010
- Equity at exit
- $16,401
- IRR
- -3.2%
- Equity multiple
- 0.77×
- Total profit
- $-7,052
- Equity at exit
- $9,511
Cash invested: $30,800 (down + closing). Projections, not guarantees.
Landlord ↔ Tenant lean methodology
- Overall (STATE)
- 83 Strongly Landlord-Friendly
- State Iowa
- 83 Strongly Landlord-Friendly · R+6
- County
- — inherits STATE
- City
- — inherits STATE
ZIP-level market 52803
- Home prices YoY
- -34.5%
- Rents YoY
- 4.6%
- Active inventory
- 165
- Price-to-rent
- 9.6×
Monthly cashflow live
- Estimated rent
- $957 medium interval (Pro) →
- Mortgage (P&I)
- −$577
- Tax from tax record
- −$129 /mo · $1,546/yr
- Insurance
- −$46
- HOA
- −$0
- Vacancy / Maint / Mgmt
- −$201
- Net cashflow
- $4
Break-even live
Sensitivity live
| Price | -10% $67 | -5% $35 | +0% $4 | +5% $-27 | +10% $-58 |
|---|---|---|---|---|---|
| Rent | -10% $-71 | -5% $-34 | +0% $4 | +5% $42 | +10% $80 |
| Rate | -1.0pp $60 | -0.5pp $32 | base $4 | +0.5pp $-24 | +1.0pp $-53 |
UW: 25.0% down · 7.5% · 30yr · 1.5% tax · 5.0% vac · 8.0% maint · 8.0% mgmt
Financing live
Cash to close
- Down payment
- $27,500
- Closing costs
- $3,300
- Reserves months
- —
- Total cash needed
- —
Loan-product check · same deal, 3 products live
Conventional
25% down · 7.5% · 30yr
- Down + closing
- —
- Monthly P&I
- —
- Monthly cashflow
- —
- DSCR
- —
- Eligible?
- —
Personal DTI + credit; lowest rate.
DSCR
20% down · 8.5% · 30yr
- Down + closing
- —
- Monthly P&I
- —
- Monthly cashflow
- —
- DSCR
- —
- Eligible?
- —
No personal income docs; deal must DSCR.
Hard money
10% down · 12.0% · 12mo
- Down + closing
- —
- Monthly P&I
- —
- Monthly cashflow
- —
- DSCR
- —
- Eligible?
- —
Short-term bridge; refi at stabilization.
Rent comps 2 comps
| Address | Beds | Baths | Sqft | Rent | $/sqft | DOM | Units | Dist |
|---|---|---|---|---|---|---|---|---|
| 234 E Pleasant St Davenport, IA | 2.0 | 1.0 | 3452 | $1,025 | $0.30 | 22d | 1 | 0.40mi |
| 1407 Bridge Ave Unit 2 Davenport, IA | 2.0 | 1.0 | 3704 | $895 | $0.24 | 45d | 1 | 0.42mi |
Listing history 23 events
-
2026-06-21days on market $110,000 Active 28 DOM
-
2026-06-18days on market $110,000 Active 25 DOM
-
2026-06-17days on market $110,000 Active 24 DOM
-
2026-06-16days on market $110,000 Active 23 DOM
-
2026-06-15days on market $110,000 Active 22 DOM
-
2026-06-14days on market $110,000 Active 20 DOM
-
2026-06-13days on market $110,000 Active 19 DOM
-
2026-06-10days on market $110,000 Active 17 DOM
-
2026-06-09days on market $110,000 Active 16 DOM
-
2026-06-08days on market $110,000 Active 15 DOM
-
2026-06-07days on market $110,000 Active 14 DOM
-
2026-06-03days on market $110,000 Active 10 DOM
-
2026-06-02days on market $110,000 Active 9 DOM
-
2026-06-01days on market $110,000 Active 8 DOM
-
2026-05-31days on market $110,000 Active 7 DOM
-
2026-05-30days on market $110,000 Active 6 DOM
-
2026-02-03status Active 569-char remark
Show marketing remark (569 chars)
Four-unit multifamily investment property located just off E. Locust Street, within close proximity to shopping corridors and neighborhood amenities. Fully occupied and generating a Net Operating Income of $8,725. 2,568 SF two-story structure on 0.17 acres featuring efficient unit layouts and a strong rental history. Tenants are responsible for electric service, while ownership covers water, sewer, and trash. Property includes rear alley access with a small lot providing off-street parking. Ideal for investors seeking dependable returns in the Quad Cities market.
-
2025-12-18historical 569-char remark
Show marketing remark (569 chars)
Four-unit multifamily investment property located just off E. Locust Street, within close proximity to shopping corridors and neighborhood amenities. Fully occupied and generating a Net Operating Income of $8,725. 2,568 SF two-story structure on 0.17 acres featuring efficient unit layouts and a strong rental history. Tenants are responsible for electric service, while ownership covers water, sewer, and trash. Property includes rear alley access with a small lot providing off-street parking. Ideal for investors seeking dependable returns in the Quad Cities market.
-
2021-08-06historical
-
2013-04-01soldstatus $215,000
-
2013-03-29soldstatus
-
2012-10-02$99,900
-
2008-02-19soldstatus $45,500
ⓘ Source: listings_history table (triggers on properties + properties_extension) + one-shot
backfill from property_details.listing_events for pre-trigger history.
Tax reassessment forecast IA · Partial reset (capped growth)
- Current annual tax
- $1,546 · $129/mo
- Projected year-2 tax
- $1,636 · $136/mo
- Expected delta
- +$90/yr (+$8/mo · 5.9%)
ⓘ Screening estimate from a state-policy table — verify with the county assessor before closing.
Climate risk First Street
- Flood 1/10 Low FEMA zone X (unshaded) · 0% chance over 30 yrs
- Wildfire 1/10 Low
- Heat 3/10 Moderate 7 d/yr ≥103°F today · 16 d/yr by 30 yrs out
- Wind 2/10 Low
- Air quality 3/10 Moderate 2 unhealthy d/yr today · 3 by 30 yrs out
Nearby sold comps map
Loading sold comps map…
Walkable amenities ~0.75 mi
Loading nearby amenities…
Taxation est. · year 1
- Rental income
- $11,480
- − Mortgage interest
- −$6,162
- − Property taxes
- −$1,546
- − Insurance
- −$550
- − Repairs & maintenance
- −$918
- − Management
- −$918
- − Depreciation
- −$3,200
- Taxable loss
- −$1,814
- Est. tax savings @ 24.0%
- +$435
- After-tax cash flow
- $486/yr
For passive investors: Depreciation is non-cash, so a rental often shows a tax loss while cash-flowing — sheltering income. Rental losses are passive: they offset passive income freely, and up to $25,000/yr can offset ordinary (W-2) income if you actively participate and your MAGI is under $100k (phasing out to $0 by $150k); unused losses carry forward. On sale, claimed depreciation is recaptured at up to 25%, and gains may owe capital-gains tax (a 1031 exchange can defer both). Figures are a year-1 estimate at your 24.0% rate — not tax advice; consult a CPA.
Schools (NCES district)
- District
- Davenport Community School District
- NCES district ID
- 1908580
- Math proficiency
- 43% ▼ -11.00%
- Reading proficiency
- 50% ▼ -3.00%
- Median HH income
- $46,157
- Composite
- 39.49/100
- National rank
- #3951
- State rank
- #288 of 289 in IA
Livability — Davenport
- Score
- 79/100
- State rank
- #126
- US rank
- #2312
Category grades
Schools grade is shown separately in the Schools card above.
Census & demographics
- Census place
- Davenport, IA
- County
- Scott County · 144,583 people
- City population
- 103,319
- Metro
- Davenport-Moline-Rock Island, IA-IL
- Population (ZIP)
- 22,742
- Household income
- $64,543
- Rent vs Own
- Severe rent burden
- 630.0
Population outlook (Scott County) Hauer SSP2
- Today (2025)
- 188,878 people
- By 2030
- 196,648 · +4.1%
- By 2040
- 210,860 · +11.6%
- By 2050
- 224,359 · +18.8%
- By 2075
- 258,884 · +37.1%
- By 2100
- 286,447 · +51.7%
Race, ethnicity, and origin ACS 2023
- Neighborhood character
- Predominantly White (69%)
- Race & ethnicity
- White 69% Black 14% Two or more races 10% Hispanic / Latino 9%
- Hispanic origin (detail)
- Mexican 7%
- Common ancestry
- Romanian 2% Portuguese 2% Iranian 2%
- Foreign-born
- 5% · Canada, United Kingdom, South Korea
- Languages at home
- 93% English-only · Spanish 4% French/Haitian/Cajun 1%
Political lean MEDSL · Scott
- 2024 margin
- Toss-up / Even · D 47.3% · R 51.2% · Other 1.4%
- 2008→2024 swing
- -18.4pp toward R · 2008: 14.6pp · 2024: -3.9pp
- All cycles
- 2024: R+3.9 2020: D+3.5 2016: D+1.4 2012: D+13.8 2008: D+14.6
Not yet ingested
- Civics
- —
Market trends
- HPI YoY
- ▼ -96.00%
- Current HPI
- 182.0976
- Rent YoY
- ▲ 4.57%
- Metro
- Davenport-Moline-Rock Island, IA-IL
- State GDP YoY
- ▲ 2.48%
- F500 in state
- 4
Industry mix (Fortune 500 HQ in IA)
| Industry | F500 HQs | Revenue |
|---|---|---|
| Financial Services | 1 | $16B |
|
||
| Retail / Convenience | 1 | $15B |
|
||
Price history
+372.5% since first listed7 events — show timeline
- 2026-02-03 Relisted — MRED as Distributed by MLS Grid
- 2025-12-18 Listing Removed — MRED as Distributed by MLS Grid
- 2021-08-06 Listing Removed — RMLSA as Distributed by MLS Grid
- 2013-04-01 Sold (Public Records) $215,000 Public Records
- 2013-03-29 Sold (MLS) — MRED as Distributed by MLS Grid
- 2012-10-02 Listed $99,900 MRED as Distributed by MLS Grid
- 2008-02-19 Sold (Public Records) $45,500 Public Records
Property tax history
-4.6%/yrLatest (2025): $1,546 · +2.4% YoY. Source: county tax records.
Cash-flow waterfall
monthlySold comps — $/sqft
last 12 mo · ≤1 miLoading sold comps…